. 2024 Dec 25;7(1):1699.
doi: 10.1038/s42003-024-07404-x.

mFusion: a multiscale fusion method bridging neuroimages to genes through neurotransmissions in mental health disorders

Affiliations

mFusion: a multiscale fusion method bridging neuroimages to genes through neurotransmissions in mental health disorders

Luolong Cao et al. Commun Biol. .

Abstract

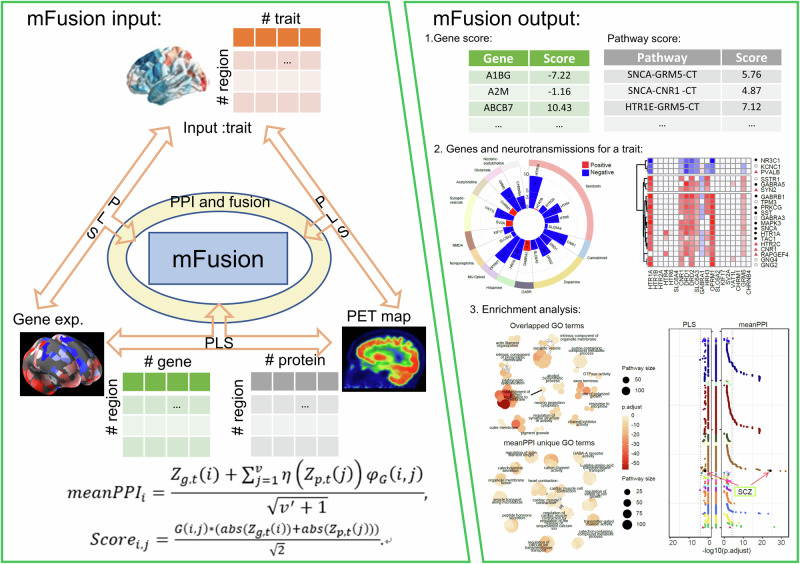
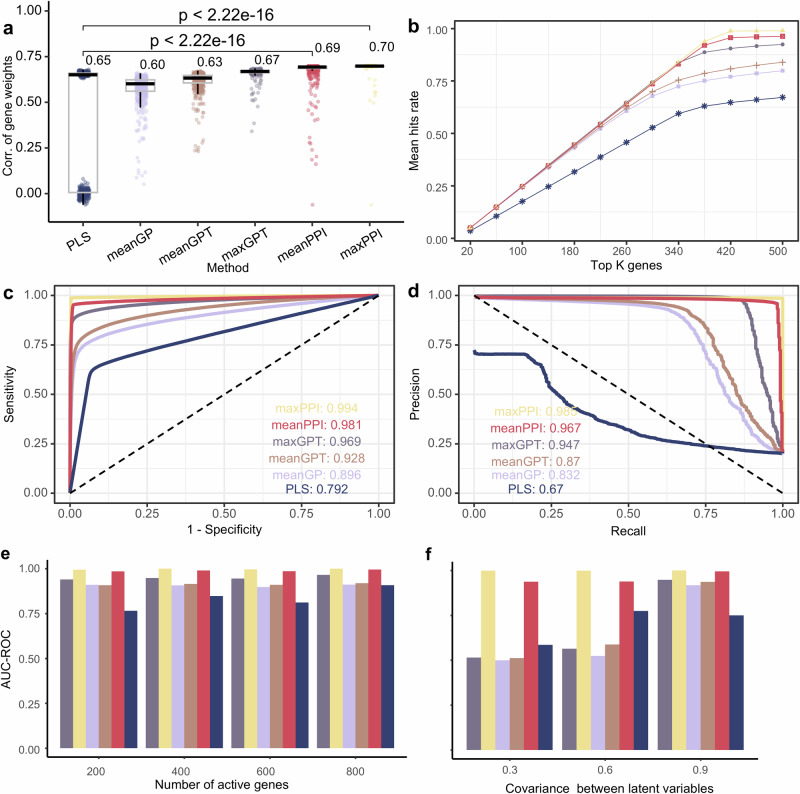
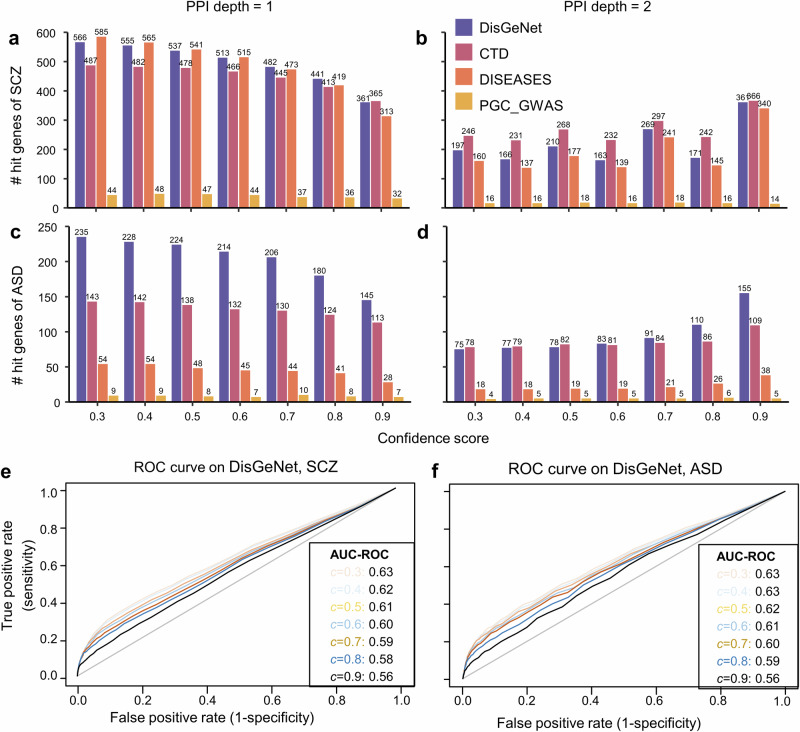
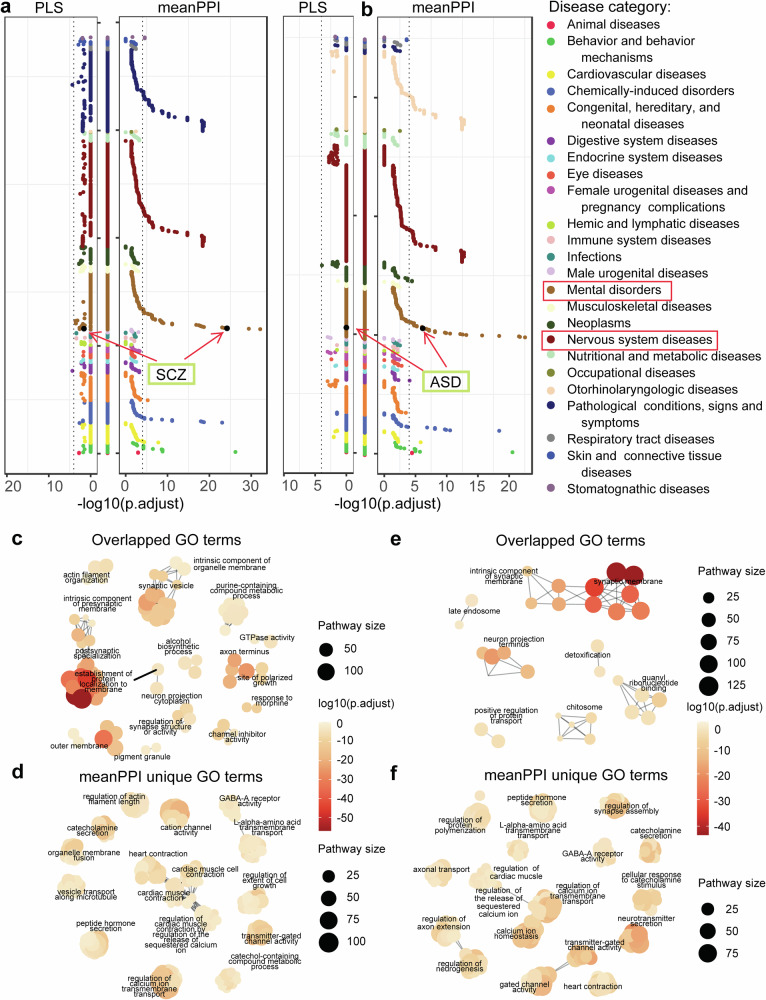
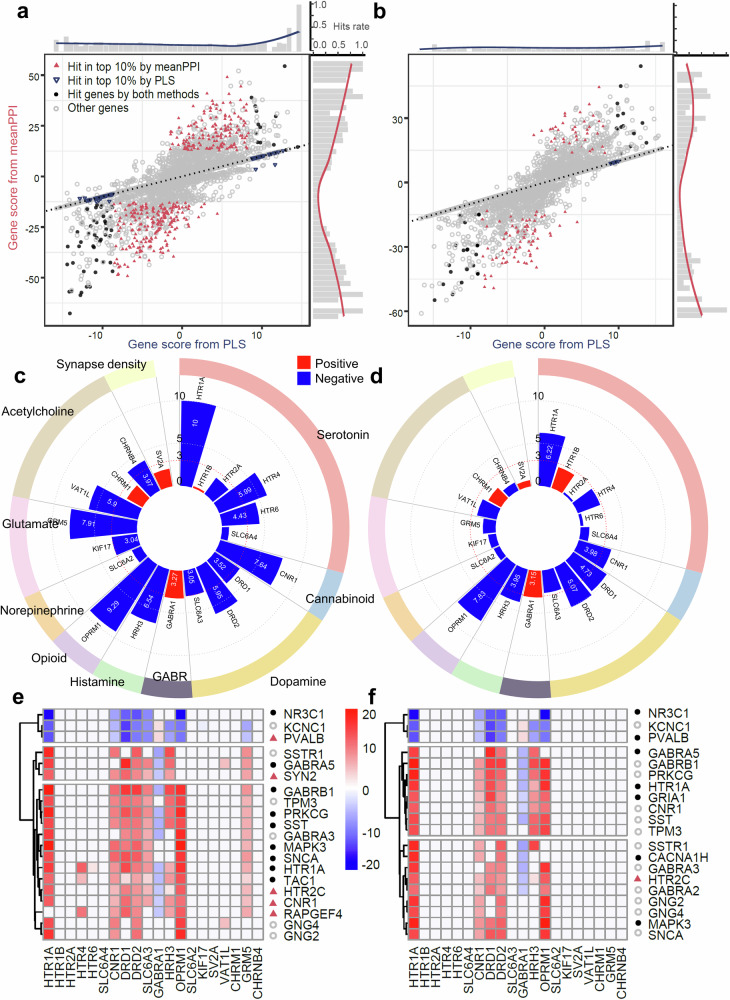
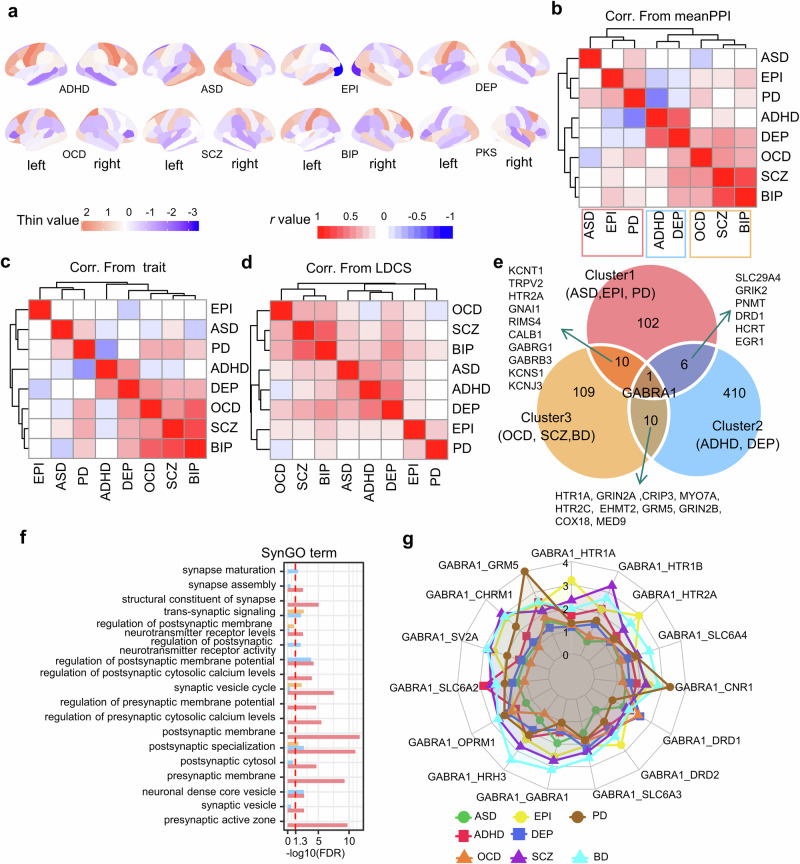
Mental health disorders emerge from complex interactions among neurobiological processes across multiple scales, which poses challenges in uncovering pathological pathways from molecular dysfunction to neuroimaging changes. Here, we proposed a multiscale fusion (mFusion) method to evaluate the relevance of each gene to the neuroimaging traits of mental health disorders. We combined gene-neuroimaging associations with gene-positron emission tomography (PET) and PET-neuroimaging associations using protein-protein interaction networks, where various genes traced by PET maps are involved in neurotransmission. Compared with previous methods, the proposed algorithm identified more disease genes on both simulated and empirical data sets. Applying mFusion to eight mental health disorders, we found that these disorders formed three clusters with distinct associated genes. In summary, mFusion is a promising tool of prioritizing genes for mental health disorders by establishing gene-PET-neuroimaging pathways.


Conflict of interest statement

Competing interests: The authors declare no competing interests.

Figures

Fig. 1
Fig. 1. The framework and working interface of the “mFusion” method.
By using partial least square association to integrate spatial correlations of gene expressions in the human brain with information about neurotransmission and neuroimaging, the mFusion method yields a relevance score for each gene and pathway associated with a mental disorder, facilitating the identification of top-ranked genes and pathways. This fusion method additively provided the potential reasons for neurochemical architectures (neurotransmissions) in PET images influencing gene scores. Subsequent enrichment analysis of top genes identifies biological process and pathways relate to the mental disorder.
Fig. 2
Fig. 2. Evaluation of fusion methods from simulated datasets.
a The correlation between real gene weights and fusion weights measured by different fusion methods of 500 simulated experiments. The lower whisker extends from the first quartile (Q1) to the smallest data point that is within 1.5 * interquartile range (IQR) below Q1. The upper whisker extends from the third quartile (Q3) to the largest data point that is within 1.5 * IQR above Q3. The number next to bar represents the median of the population (using unpaired Wilcoxon test). b Average hit rates of genes in all 500 simulations. The hit rate was measured by the rate of really active genes in top K genes ranked by specific fusion method. c ROC (Receiver Operating Characteristic) curve of different fusion methods on simulation data. In simulation experiments, w~X×w~MT is completely accurate connection matrix, and this noiseless PPI information greatly improves the performance of maxPPI and meanPPI methods, so the AUC-ROC of maxPPI is 1. d PR (precision-recall) curve of different fusion methods on simulation data. e AUC-ROC value of different fusion method when number of active genes changed. f AUC-ROC value of different fusion method when covariance between latent variables changed.
Fig. 3
Fig. 3. Performance on SCZ and ASD disease of fusion methods under different disease databases.
a ROC curve of different fusion methods on DisGeNet database for SCZ. b ROC curve of different fusion methods on DisGeNet database for ASD. cj Number of overlapped genes for SCZ (cf) and ASD (gj) in different standard datebases: DisGeNet, CTD, DISEASES, and PGC-GWAS datasets (corresponding to Table 1). Line types mean different fusion methods.
Fig. 4
Fig. 4. Performance of meanPPI method on DisgeNet database with different threshold for pruning the PPI network.
a, b Number of hit genes for SCZ with different PPI depth d and confidence scores c, d = 1 in A and 2 in B, respectively. c, d Number of hit genes for ASD with different PPI depth and confidence scores, d = 1 in C and 2 in D, respectively. e ROC curve at different PPI confidence for SCZ. f ROC curve at different PPI confidence for ASD.
Fig. 5
Fig. 5. Enrichment analysis of top-ranked genes related to SCZ and ASD traits.
a, b Disease enrichment results in DisGeNet diseases on top 1541 trait-related genes for SCZ (a) and ASD (b). The Y-axis lists disease with categories in alphabetical order. c–f Clusters of GO terms enrichment results on top 1541 genes for SCZ (overlapped terms in c, terms uniquely enriched by meanPPI method in d) and ASD (overlapped terms in (e), terms uniquely enriched by meanPPI method in (f). The size and color of the dots were proportional to the number of pathway genes and enrichment significance, respectively. The p-values were adjusted using Bonferroni correction. Clusters were generated from enriched GO terms by aPEAR (Advanced Pathway Enrichment Analysis Representation) package. It exploits the similarities between pathway gene sets and represents them as a network of interconnected clusters. Each cluster is assigned a meaningful name that highlights the main biological theme of the experiment.
Fig. 6
Fig. 6. Differential plot of genes by different fusion methods and neurotransmissions for SCZ and ASD.
a, b Gene scores from meanPPI method and PLS method. Black dots: genes overlapped among the genes from DisGeNet standard database, top 10% genes from meanPPI method, and top 10% genes from PLS method simultaneously. Blue triangles: genes overlapped between the genes from DisGeNet database and 10% genes from PLS method. Magenta triangles: genes overlapped between the genes from DisGeNet database and 10% genes from meanPPI methods. The bar chart at the edge shows the hit rates of these disease related genes. c, d Associations measured by PLS Z-score between all PET maps of various neurotransmission process and disease trait (c: SCZ; d: ASD). e, f Top 20 candidate genes identified by meanPPI method, and the gene-PET effects measured by PLS Z- score for SCZ (e) and ASD (f) disease trait. Point shapes of genes in (ef) have the same meanings as in (a, b).
Fig. 7
Fig. 7. Correlation of eight brain disorders from multiple biomolecular levels.
a Cohen’s d maps of cortical thickness difference for eight disorders on Desikan–Killiany atlas regions. b Heatmap of expressional correlations across eight disorders (Spearman’s r value). c Heatmap of morphological correlations across eight disorders (Pearson r value). d Heatmap of genetic correlations across eight disorders (LDCS rg value). e The overlap of top10% genes among three disease clusters is shown in the Veen map. f GO:MF (molecular function) terms enrichment results for three groups of cluster-specific genes (Cluster1: 102; Cluster 2: 410; Cluster 3: 109). g GABRA1 related pathway scores across different neurotransmissions. ADHD Attention-deficit/hyperactivity disorder, ASD Autism spectrum disease, BIP Bipolar disorder, DEP Depression, EPI Epilepsy, OCD Obsessive-compulsive disorder, PD Parkinson’s disease, SCZ Schizophrenia.

References

    1. Arias, D., Saxena, S. & Verguet, S. Quantifying the global burden of mental disorders and their economic value. eClinicalMedicine54, 10.1016/j.eclinm.2022.101675 (2022). - PMC - PubMed
    1. World Health Organization. World mental health report: Transforming mental health for all. World Health Organization (2022).
    1. Andersen, P. H. et al. Securing the future of drug discovery for central nervous system disorders. Nat. Rev. Drug Discov.13, 871–872, (2014). - PubMed
    1. Wang, Z. et al. MarkovHC: Markov hierarchical clustering for the topological structure of high-dimensional single-cell omics data with transition pathway and critical point detection. Nucleic Acids Res.50, 46–56 (2022). - PMC - PubMed
    1. Piñero, J. et al. The DisGeNET knowledge platform for disease genomics: 2019 update. Nucleic Acids Res.48, D845–D855 (2020). - PMC - PubMed

LinkOut - more resources