

Predicting higher risk factors for COVID-19 short-term reinfection in patients with rheumatic diseases: a modeling study based on XGBoost algorithm
- PMID: 39719617
- PMCID: PMC11668030
- DOI: 10.1186/s12967-024-05982-2
Predicting higher risk factors for COVID-19 short-term reinfection in patients with rheumatic diseases: a modeling study based on XGBoost algorithm
Abstract
Background: Corona virus disease 2019 (COVID-19) reinfection, particularly short-term reinfection, poses challenges to the management of rheumatic diseases and may increase adverse clinical outcomes. This study aims to develop machine learning models to predict and identify the risk of short-term COVID-19 reinfection in patients with rheumatic diseases.
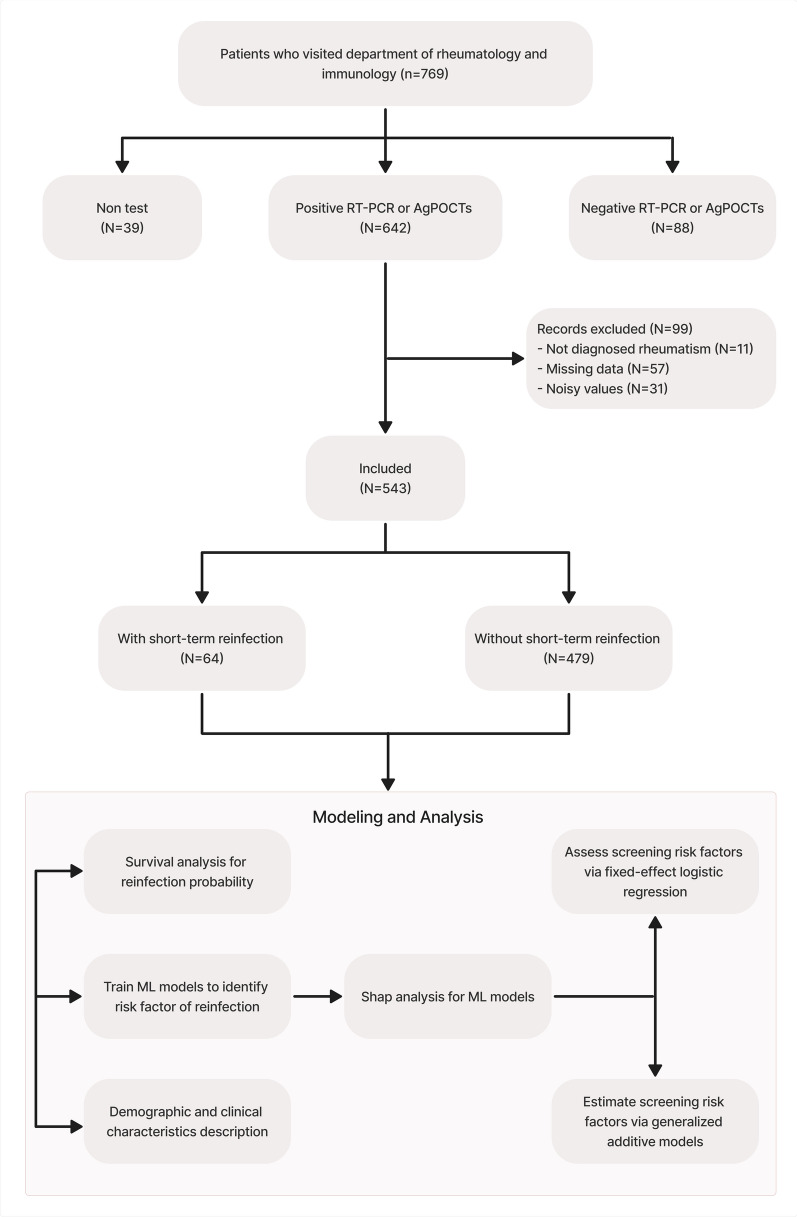
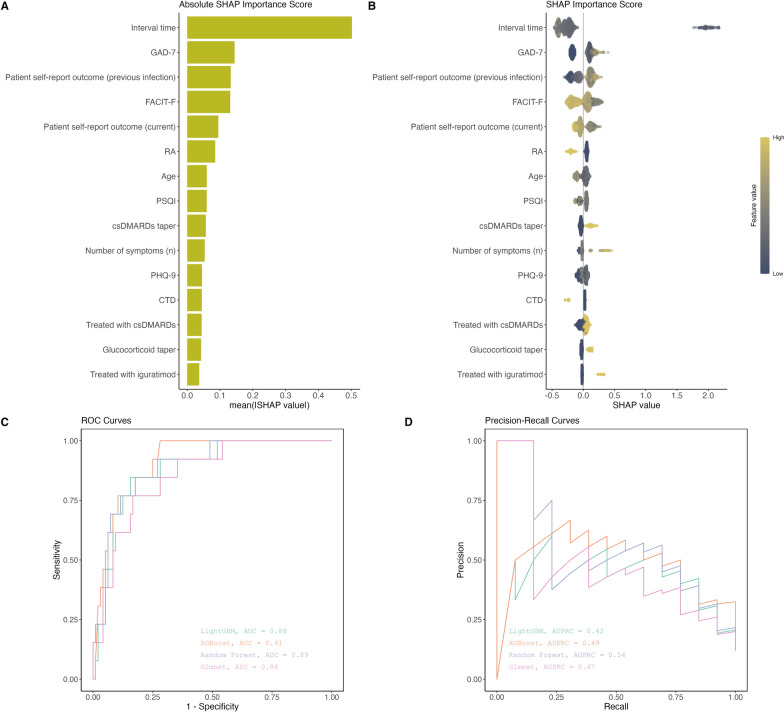
Methods: We developed four prediction models using explainable machine learning to assess the risk of short-term COVID-19 reinfection in 543 patients with rheumatic diseases. Psychological health was evaluated using the Functional Assessment of Chronic Illness Therapy Fatigue (FACIT-F) scale, the Patient Health Questionnaire-9 (PHQ-9), the Generalized Anxiety Disorder 7-item (GAD-7) questionnaire, and the Pittsburgh Sleep Quality Index (PSQI) scale. Health status and disease activity were assessed using the EuroQol-5 Dimension-3 Level (EQ-5D-3L) descriptive system and the Visual Analogue Score (VAS) scale. The model performance was assessed by Area Under the Receiver Operating Characteristic Curve (AUC), Area Under the Precision-Recall Curve (AUPRC), and the geometric mean of sensitivity and specificity (G-mean). SHapley Additive exPlanations (SHAP) analysis was used to interpret the contribution of each predictor to the model outcomes.
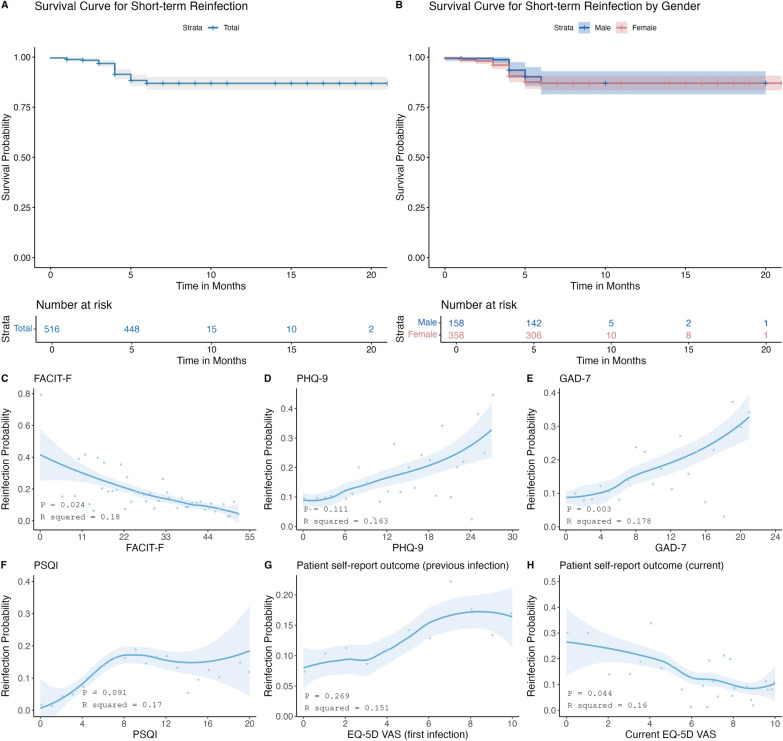
Results: The eXtreme Gradient Boosting (XGBoost) model demonstrated superior performance with an AUC of 0.91 (95% CI 0.87-0.95). Significant factors of short-term reinfection included glucocorticoid taper (OR = 2.61, 95% CI 1.38-4.92), conventional synthetic disease-modifying antirheumatic drugs (csDMARDs) taper (OR = 2.97, 95% CI 1.90-4.64), the number of symptoms (OR = 1.24, 95% CI 1.08-1.42), and GAD-7 scores (OR = 1.07, 95% CI 1.02-1.13). FACIT-F scores were associated with a lower likelihood of short-term reinfection (OR = 0.95, 95% CI 0.93-0.96). Besides, we found that the GAD-7 score was one of the most important predictors.
Conclusion: We developed explainable machine learning models to predict the risk of short-term COVID-19 reinfection in patients with rheumatic diseases. SHAP analysis highlighted the importance of clinical and psychological factors. Factors included anxiety, fatigue, depression, poor sleep quality, high disease activity during initial infection, and the use of glucocorticoid taper were significant predictors. These findings underscore the need for targeted preventive measures in this patient population.
Keywords: COVID-19; Machine learning; Psychological factors; Rheumatism; SHAP analysis; Short-term reinfection; XGBoost.
© 2024. The Author(s).
Conflict of interest statement
Declarations. Ethics approval and consent to participate: The participants provided their written informed consent to participate in this study. Aligned with the Helsinki Declaration, ethical approval of the Institutional Review Board (IRB) for the current study was obtained from the third affiliated hospital of Sun Yat-sen university ethical committee (Number: II2023-090–02). Consent for publication: Not applicable. Competing interests: The authors have no competing interests to disclose.
Figures
Similar articles
-
Machine learning algorithms for predicting COVID-19 mortality in Ethiopia.BMC Public Health. 2024 Jun 28;24(1):1728. doi: 10.1186/s12889-024-19196-0. BMC Public Health. 2024. PMID: 38943093 Free PMC article.
-
Machine learning-based predictive models for perioperative major adverse cardiovascular events in patients with stable coronary artery disease undergoing noncardiac surgery.Comput Methods Programs Biomed. 2025 Mar;260:108561. doi: 10.1016/j.cmpb.2024.108561. Epub 2024 Dec 13. Comput Methods Programs Biomed. 2025. PMID: 39708562
-
Development of interpretable machine learning models to predict in-hospital prognosis of acute heart failure patients.ESC Heart Fail. 2024 Oct;11(5):2798-2812. doi: 10.1002/ehf2.14834. Epub 2024 May 15. ESC Heart Fail. 2024. PMID: 38751135 Free PMC article.
-
Prediction of preterm birth using machine learning: a comprehensive analysis based on large-scale preschool children survey data in Shenzhen of China.BMC Pregnancy Childbirth. 2024 Dec 4;24(1):810. doi: 10.1186/s12884-024-06980-4. BMC Pregnancy Childbirth. 2024. PMID: 39633287 Free PMC article.
-
A Risk Prediction Model for Physical Restraints Among Older Chinese Adults in Long-term Care Facilities: Machine Learning Study.J Med Internet Res. 2023 Apr 6;25:e43815. doi: 10.2196/43815. J Med Internet Res. 2023. PMID: 37023416 Free PMC article.
References
-
- Edridge AWD, Kaczorowska J, Hoste ACR, et al. Seasonal coronavirus protective immunity is short-lasting. Nat Med. 2020;26:1691. - PubMed
MeSH terms
Grants and funding
LinkOut - more resources
Full Text Sources
Medical
