. 2024 Dec 24;19(1):487.
doi: 10.1186/s13023-024-03511-4.

Multisystem clinicopathologic and genetic analysis of MELAS

Affiliations

Multisystem clinicopathologic and genetic analysis of MELAS

Shuai Xu et al. Orphanet J Rare Dis. .

Abstract

Background and objectives: Mitochondrial encephalomyopathy with lactic acidosis and stroke-like episodes (MELAS) syndrome is a maternally inherited mitochondrial disorder that mostly affects the central nervous system and skeletal muscle. This study provides a comprehensive summary of the clinical symptoms, multisystemic pathogenesis, and genetic characteristics of MELAS syndrome. The aim was to improve comprehension of clinical practice and gain a deeper understanding of the latest pathophysiological theories.

Methods: The present investigation involved a cohort of patients diagnosed with MELAS at Nanjing Drum Tower Hospital between January 2014 and December 2022. Multisystem symptoms, magnetic resonance imaging/spectroscopy (MRI/MRS), muscle biopsy, and mitochondrial DNA (mtDNA) data were summarized and subsequently analysed.

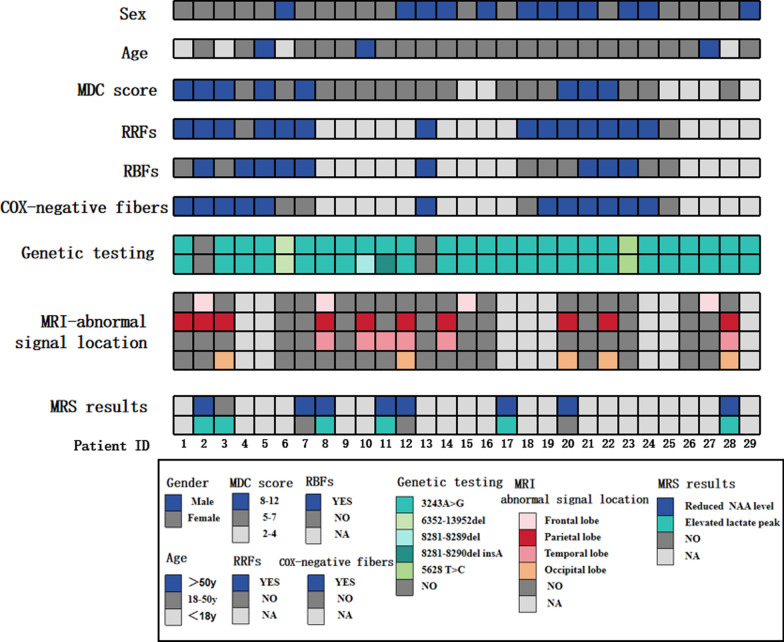
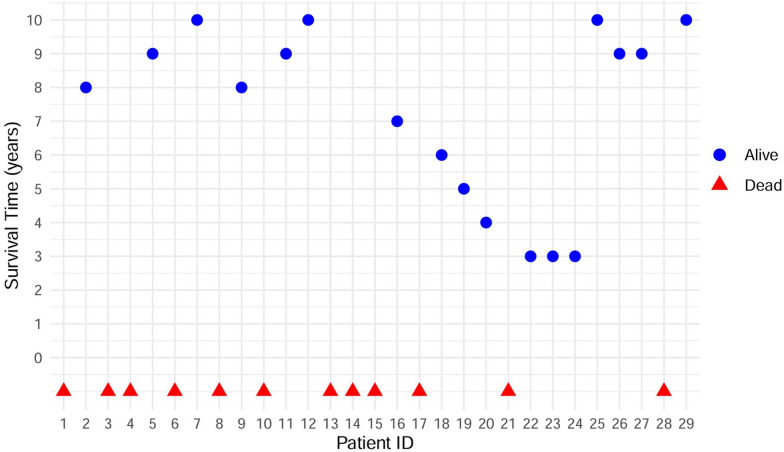
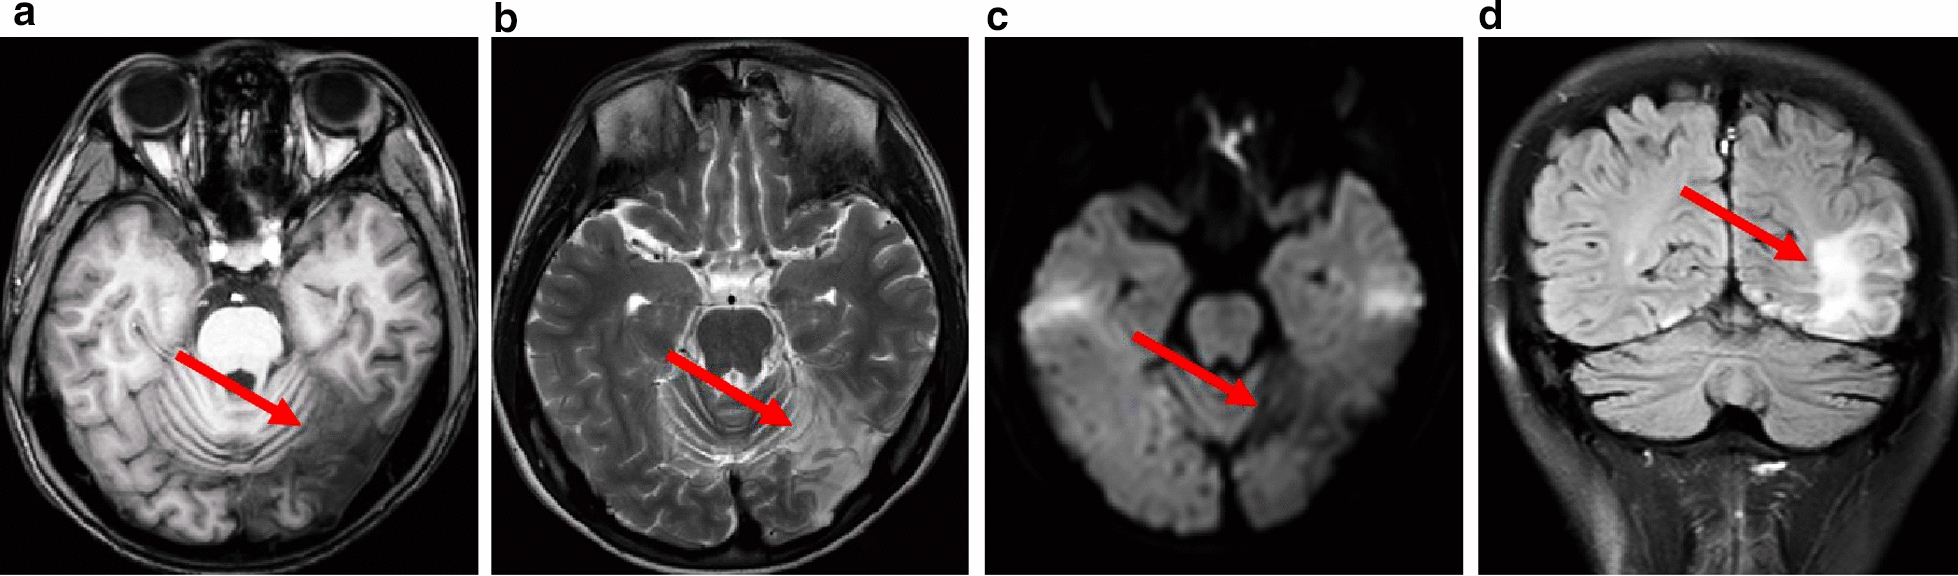
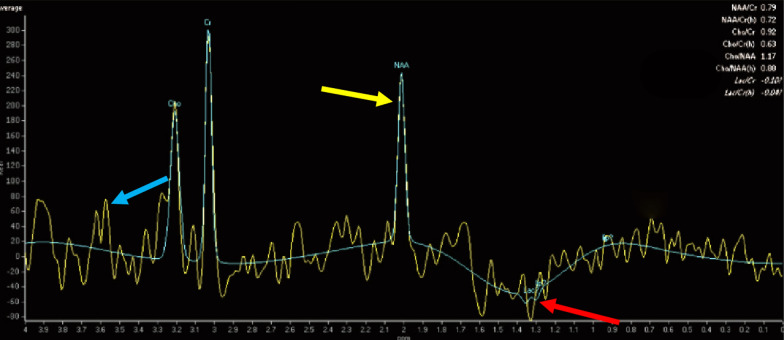
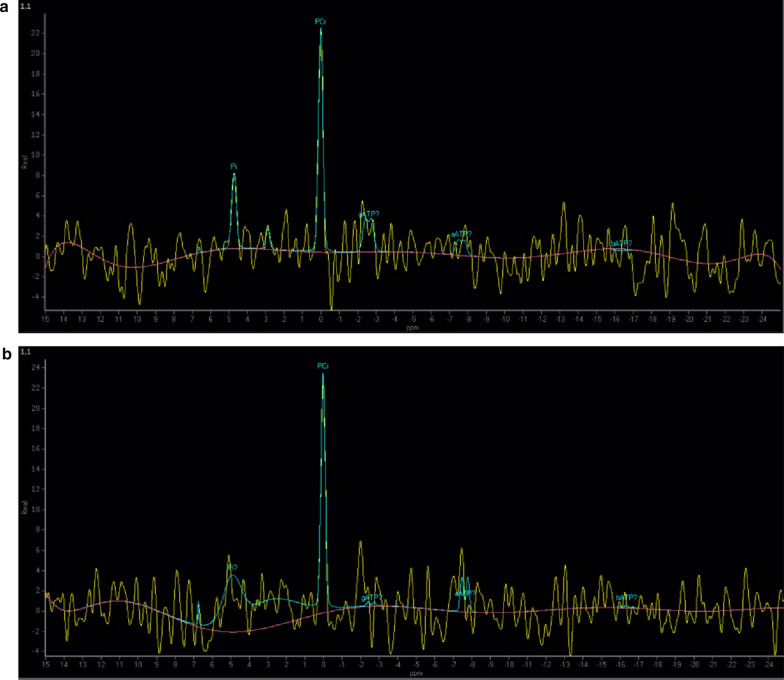
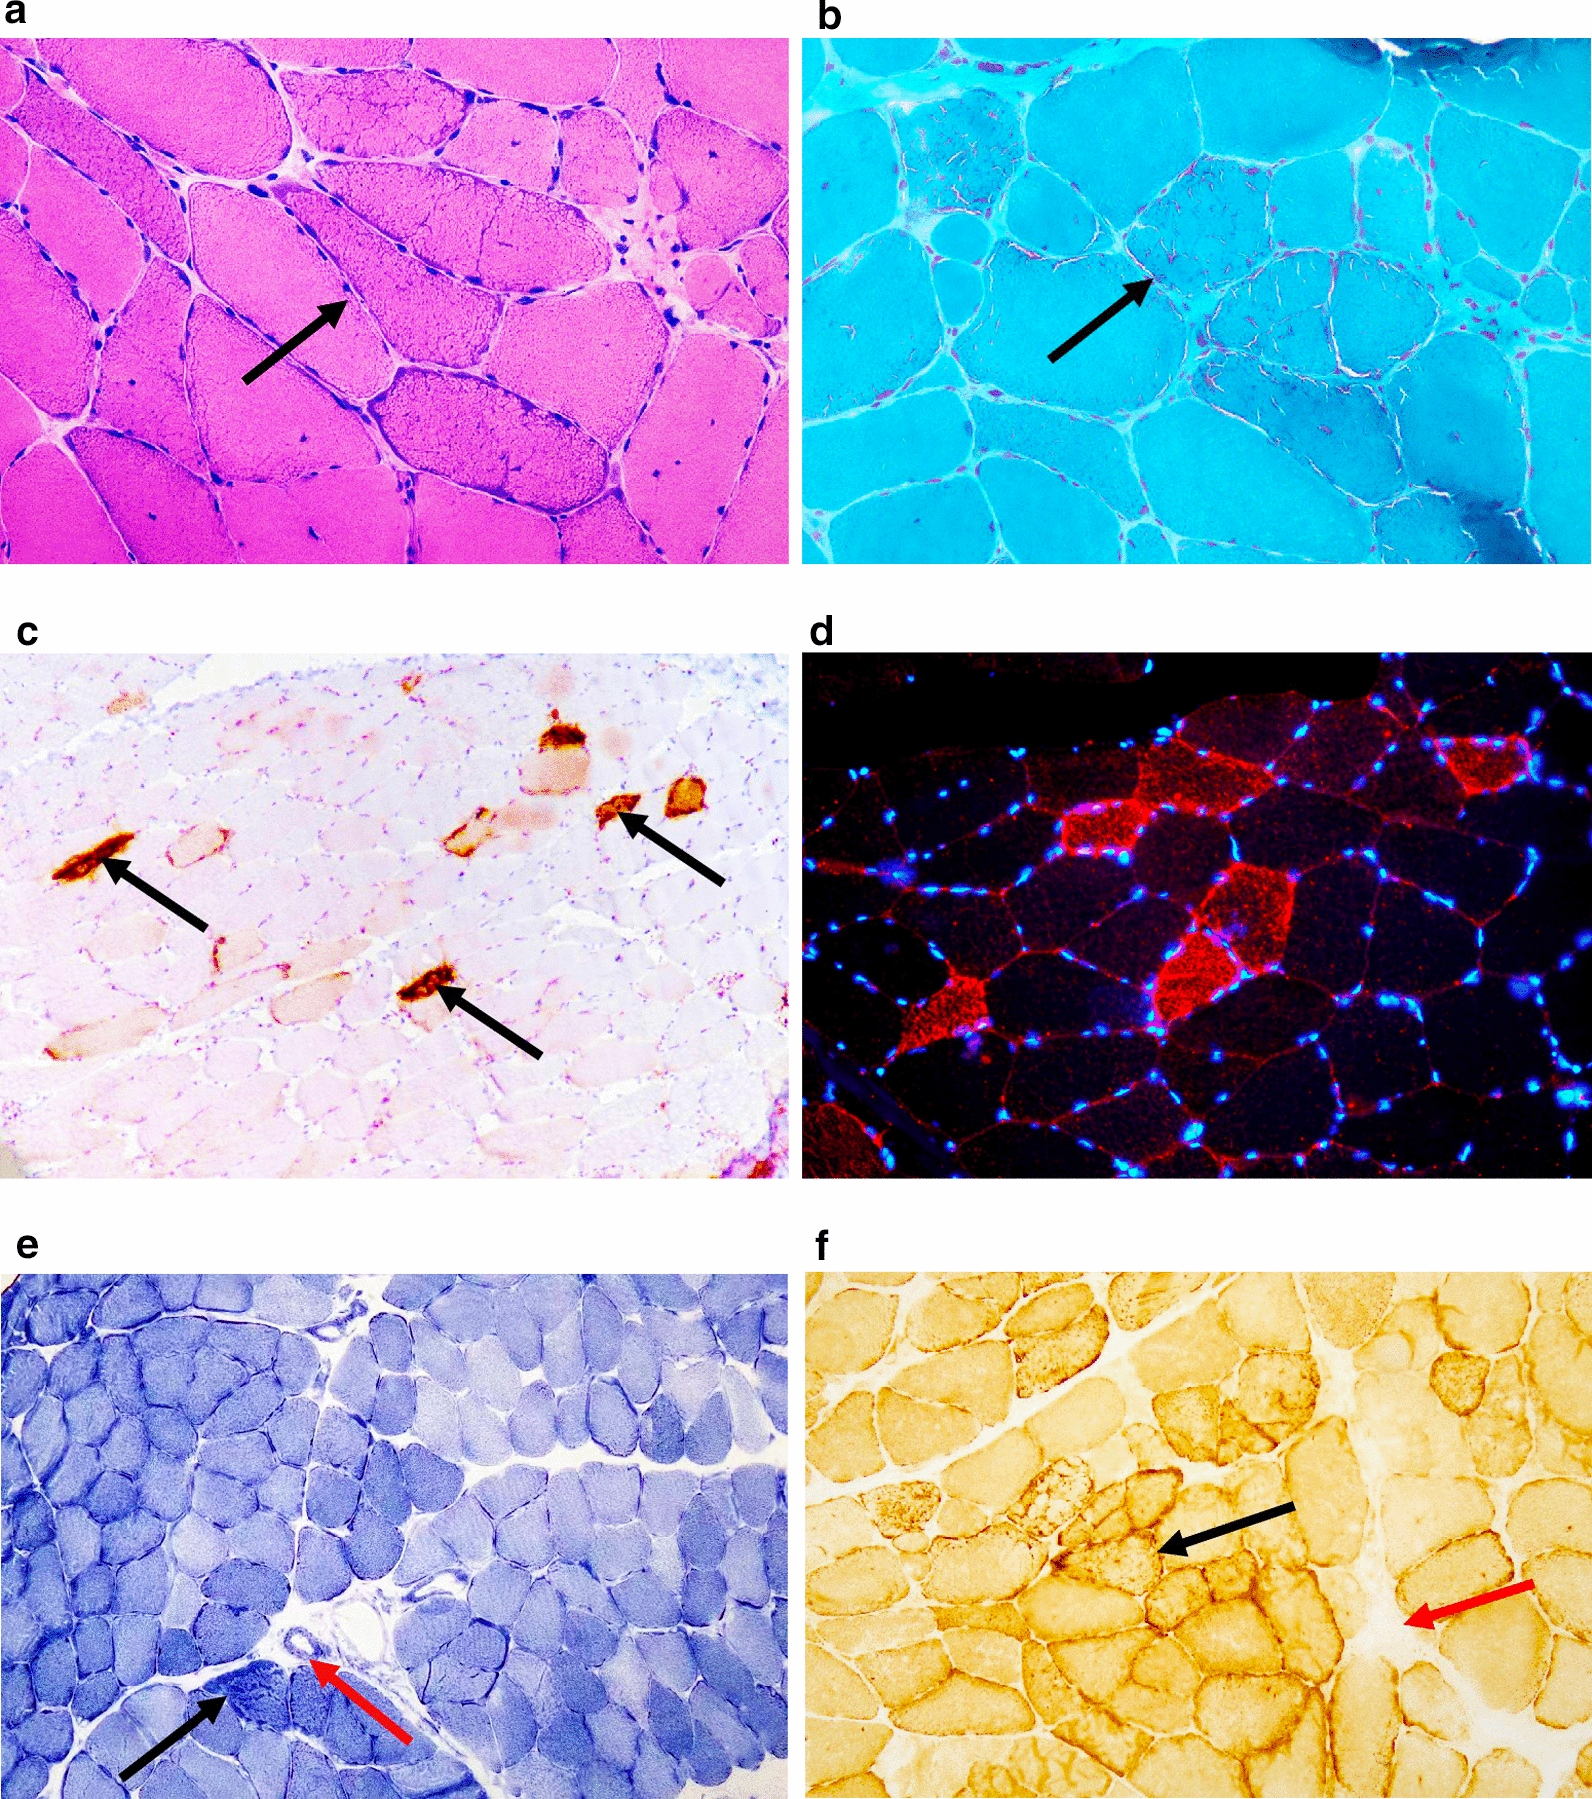
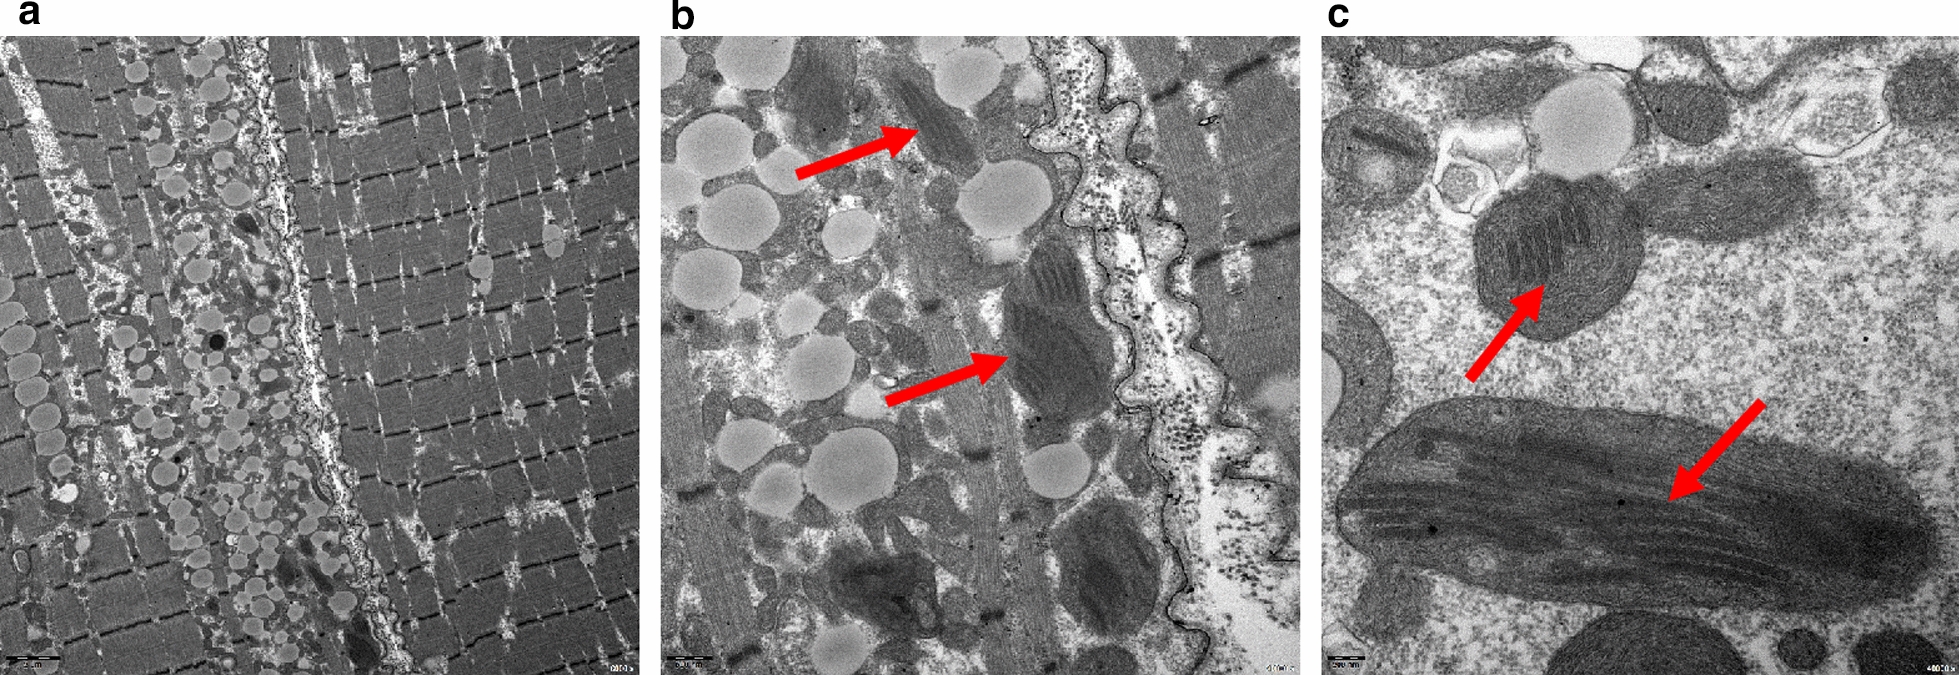
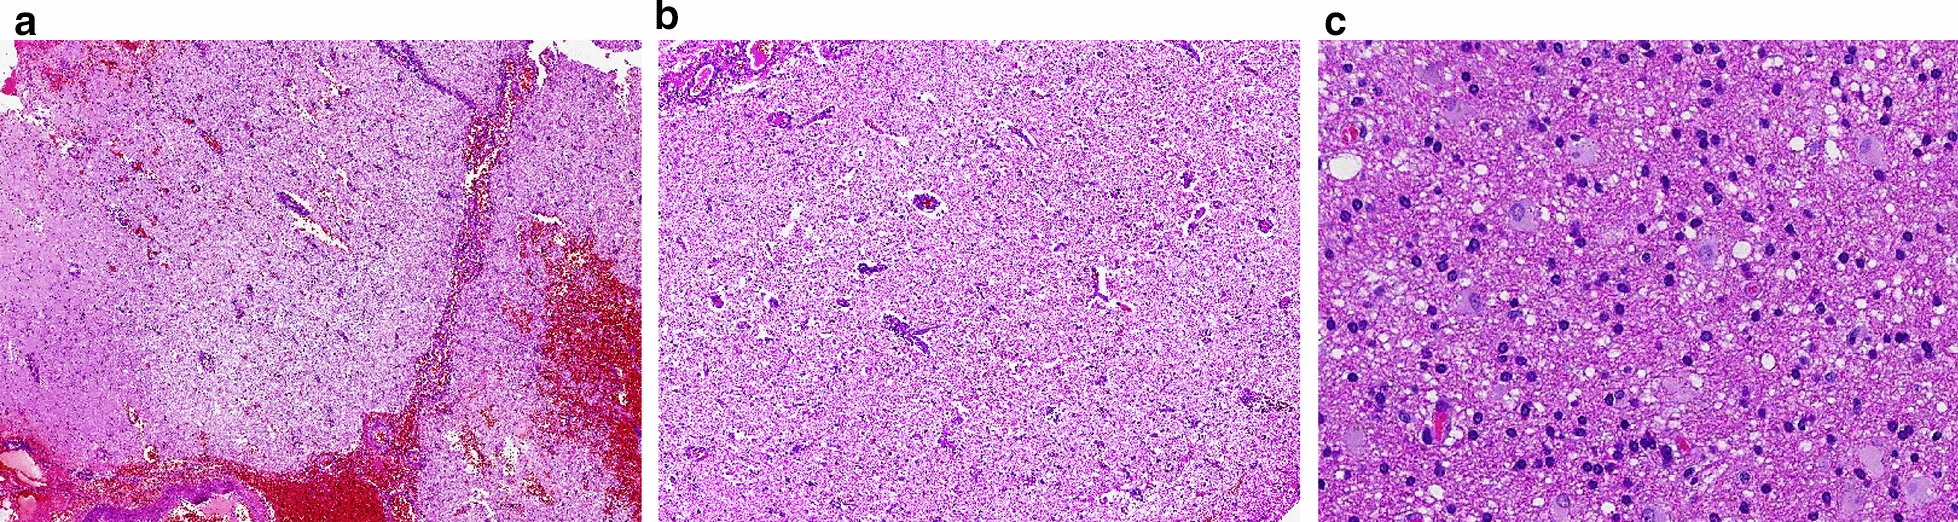
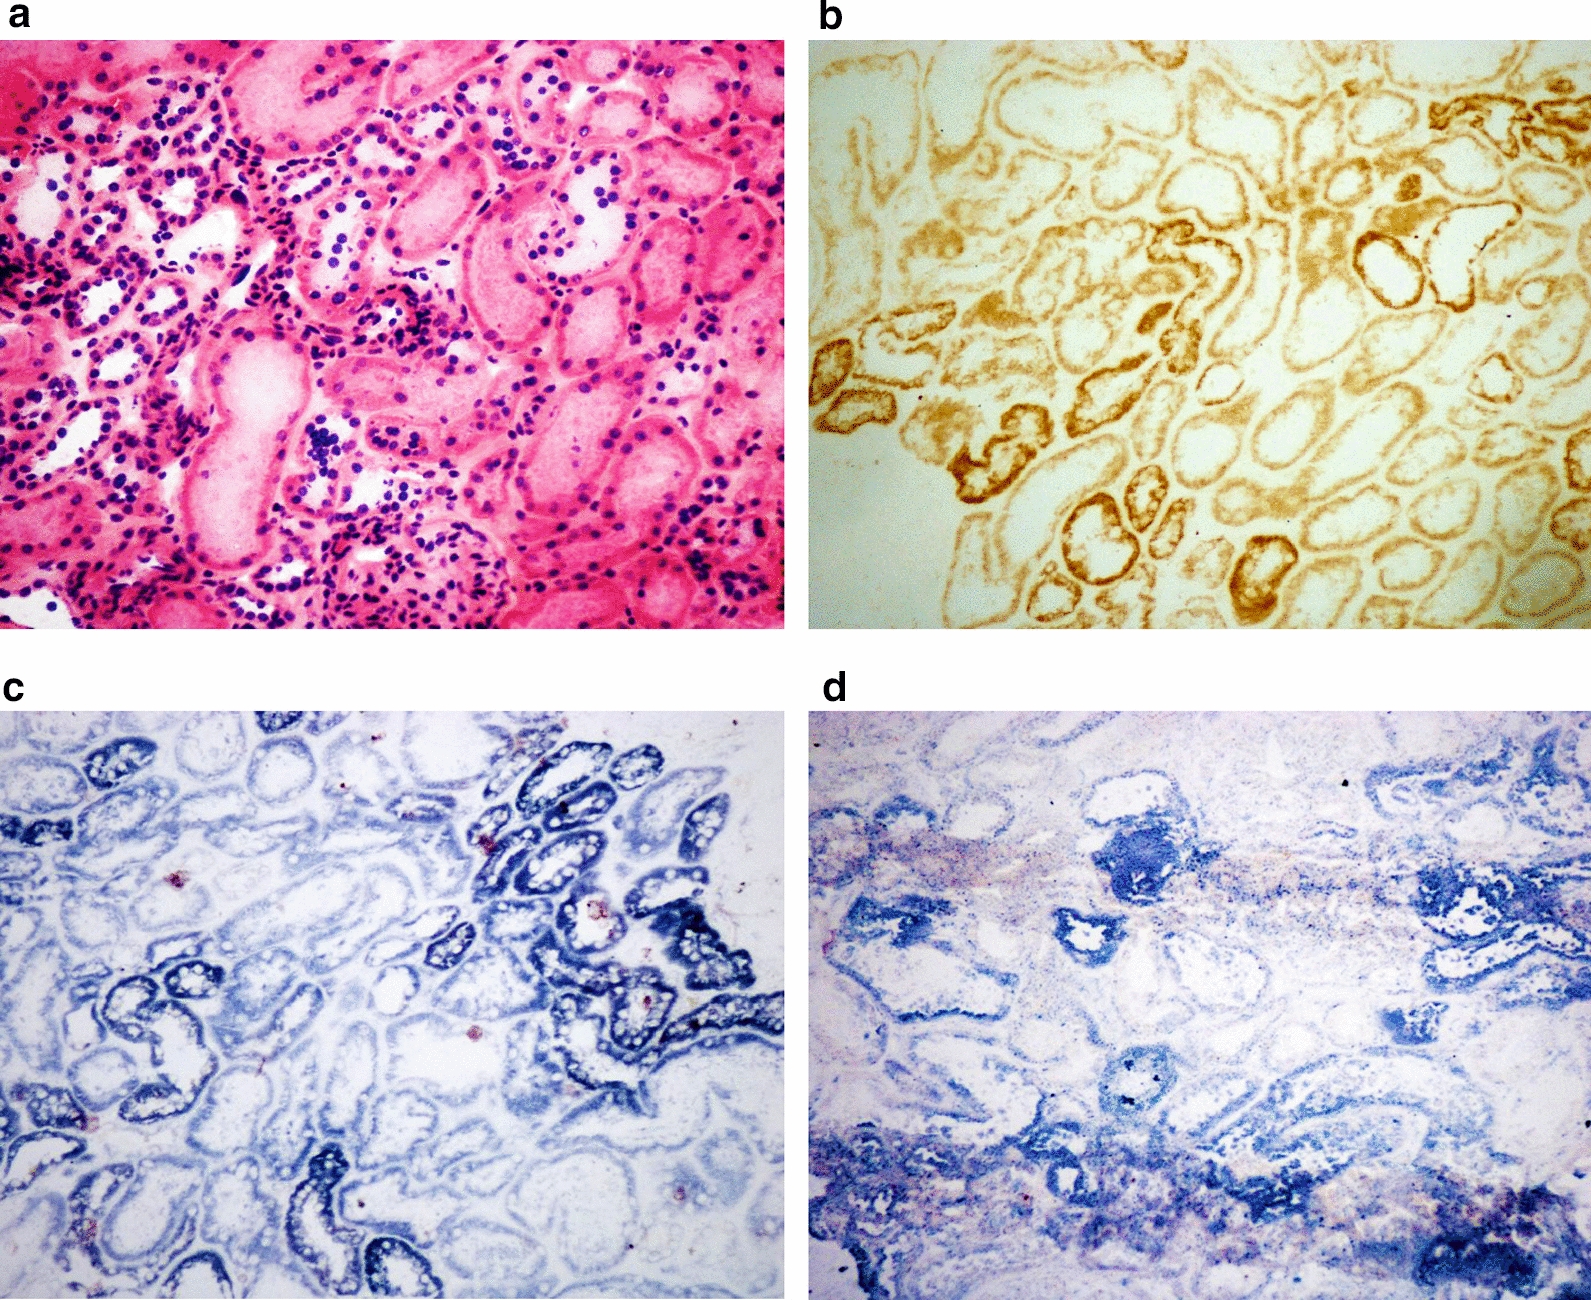
Results: This retrospective study included a cohort of 29 MELAS patients who predominantly presented symptoms such as stroke-like episodes, proximal muscle weakness, and exercise intolerance. MRI scans revealed very small infarcts beneath the deep cortex during stroke-like episodes, indicating nonvascular brain damage. Pathology analyses of the brain also showed neuronal degeneration and glial cell proliferation in the cerebral parenchyma. Proton magnetic resonance spectroscopy (1H-MRS) analysis revealed an increase in the lactate peak and a reduction in the N-acetylaspartate (NAA) level. Similarly, the phosphorus magnetic resonance spectroscopy (31P-MRS) analysis revealed an abnormal ratio of inorganic phosphate (Pi) to phosphocreatine (PCr). Muscle biopsy revealed the presence of ragged red fibres (RRFs) and cytochrome c oxidase (COX) enzyme-defective cells. These abnormalities indicate structural abnormalities in the mitochondria and deficiencies in oxidative phosphorylation, respectively. In addition to the common m.3243A > G variant, other prevalent variants, including m.5628 T > C, m.6352-13952del, and a 9-bp small deletion combined with m.3243A > G, exist.

Conclusions: MELAS is a rare mitochondrial syndrome characterized by clinical heterogeneity and genetic heteroplasmy. Abnormalities in mitochondrial metabolic function and impairments in enzyme activity are the pathogenic processes underlying MELAS. Mitochondrial vasculopathy and mitochondrial neuropathy may provide a partial explanation for the unique aetiology of stroke-like episodes.

Keywords: COX enzyme defects; MELAS; MRS; RRFs; Stroke-like episodes.


Conflict of interest statement

Declarations. Ethics approval and consent to participate: All procedures followed Chinese legal regulations and this study was approved by the Medical Ethics Committee of the Affiliated Drum Tower Hospital of Nanjing University Medicine School, under approval number 2020-349-03. All participants provided written informed consent and the procedures used in this study adhere to the tenets of the Declaration of Helsinki. Consent for publication: Not applicable. Competing interests: The authors have no competing interests to declare that are relevant to the content of this article.

Figures

Fig. 1
Fig. 1
Statistical features and diagnostic examination results of 29 patients with MELAS syndrome.The grid displays the details of 29 MELAS patients, including sex, age, MDC score, presence of RRFs, RBFs, COX-negative fibres, genomic analysis results, and different sites of lesions observed on MRI (frontal lobe, parietal lobe, temporal lobe, and occipital lobe). Each piece of information is represented by a different colour, as shown in the figure
Fig. 2
Fig. 2
Scatter plots depicting the survival and mortality outcomes of 29 patients diagnosed with MELAS syndrome. The x-axis (horizontal) depicts the case number, whereas the y-axis (vertical, above zero) denotes the duration of survival from the diagnosis of MELAS syndrome to the current year. The red triangles indicate patients who have passed away, whereas the blue dots reflect those who are still alive
Fig. 3
Fig. 3
Brain MR image of a patient with MELAS syndrome. Neuroimaging revealed that the left occipital location did not align with the vascular territories affected by ischaemic stroke during stroke-like episodes: patchy T1WI hypointensity (A) and T2WI hyperintensity (B). The DWI sequence exhibited scattered slight diffusion limitations, with a scattered strip with a high signal in a gyriform pattern (C). The FLAIR sequence revealed occipital subcortical hyperintensity (D)
Fig. 4
Fig. 4
Brain 1H-MRS image of a patient with MELAS syndrome. The 1H-MRS analysis revealed an inverted lactate double peak at 1.33 ppm, indicating the presence of accumulated lactate within the lesion (red arrow). In addition, the concentration of N-acetylaspartate (NAA) was reduced at 2.02 ppm (yellow arrow), with an NAA/Cr ratio of 0.79 (the normal range for NAA/Cr is 1.8–2.2), which indicates impaired neuronal function. There was a mild increase in the mI/Cr ratio at 3.56 ppm (blue arrow), but this increase was not statistically significant
Fig. 5
Fig. 5
Quadriceps muscle 31P-MRS image of a patient with MELAS syndrome. Immediately after exercise, the Pi levels rapidly increased and the PCr levels decreased, leading to a remarkable increase in the Pi/PCr ratio (A). During the recovery period after exercise, PCr levels gradually returned to their resting phase level, accompanied by a slow decline in the Pi/PCr ratio (B)
Fig. 6
Fig. 6
Muscle biopsy from the biceps brachii and immunohistochemical/ immunofluorescence staining of a patient with MELAS syndrome due to m.3243 A > G. H&E staining revealed the presence of several RRFs with basophilic sarcoplasmic masses that were irregular in shape (A. 400 × magnification), indicating abnormally proliferated mitochondria. MGT staining revealed that these RRFs were intensely red in colour, especially in the subsarcolemmal zones but also throughout the fibres (B 400 × magnification). RRFs showed notable positivity in AMA staining (C. 200 × magnification) in the paraffin-embedded section and in the frozen section (D 400 × magnification). SDH staining revealed the appearance of RBFs (black arrow) and SSVs (red arrow) (E 200 × magnification). COX staining revealed COX-positive (black arrow) and COX-deficient fibres (red arrow) (F 200 × magnification)
Fig. 7
Fig. 7
Electron microscopy examination of a patient with MELAS syndrome due to m.3243 A > G. Electron micrographs illustrated the buildup of lipid droplets and the presence of abnormal mitochondria of various sizes between myofibrils in the subsarcolemmal zone (A 6000 × magnification). The red arrow highlights different forms of mitochondrial abnormalities, such as giant, structurally abnormal mitochondria and paracrystalline inclusions (B 20,000 × magnification, C 40,000 × magnification)
Fig. 8
Fig. 8
Brain lesion in a patient with MELAS syndrome in the left frontotemporal lobe. The small blood vessels showed dilation and congestion on the surface of the meninges (A 40 × magnification). A magnified view of a portion of the infarct reveals the proliferation of glial cells, vacuolization of the adjacent neuropil, and prominent capillaries (B 100 × magnification). Note the neuronal swelling of the cerebral parenchyma at higher magnification (C 200 × magnification), which represented neuronal degeneration to a certain extent [11]
Fig. 9
Fig. 9
Renal biopsy of a patient with MELAS syndrome. The kidney samples were processed into frozen sections and were examined via COX, SDH and NADH enzyme activity staining. H&E staining (A 20 × magnification) revealed the structure of the renal glomerulus and tubules, which appeared basically normal. Enzymatic staining suggested decreased mitochondrial activity due to defective OXPHOS. Serial sections demonstrate decreased activity of COX (B 20 × magnification), SDH (C 20 × magnification), and NADH (D 20 × magnification) in renal tubules

References

    1. Ikeda T, Osaka H, Shimbo H, Tajika M, Yamazaki M, Ueda A, et al. Mitochondrial DNA 3243A>T mutation in a patient with MELAS syndrome. Hum Genome Var. 2018;5:25. 10.1038/s41439-018-0026-6. - DOI - PMC - PubMed
    1. Chae HW, Na JH, Kim HS, Lee YM. Mitochondrial diabetes and mitochondrial DNA mutation load in MELAS syndrome. Eur J Endocrinol. 2020;183:505–12. 10.1530/eje-20-0189. - DOI - PubMed
    1. El-Hattab AW, Adesina AM, Jones J, Scaglia F. MELAS syndrome: clinical manifestations, pathogenesis, and treatment options. Mol Genet Metab. 2015;116:4–12. 10.1016/j.ymgme.2015.06.004. - DOI - PubMed
    1. Seidowsky A, Hoffmann M, Glowacki F, Dhaenens CM, Devaux JP, de Sainte Foy CL, et al. Renal involvement in MELAS syndrome - a series of 5 cases and review of the literature. Clin Nephrol. 2013;80:456–63. 10.5414/cn107063. - DOI - PubMed
    1. Saneto RP, Friedman SD, Shaw DW. Neuroimaging of mitochondrial disease. Mitochondrion. 2008;8:396–413. 10.1016/j.mito.2008.05.003. - DOI - PMC - PubMed

Substances

LinkOut - more resources