. 2025 May;73(5):928-947.
doi: 10.1002/glia.24662. Epub 2024 Dec 24.

Dysregulation of Myelination in Focal Cortical Dysplasia Type II of the Human Frontal Lobe

Affiliations

Dysregulation of Myelination in Focal Cortical Dysplasia Type II of the Human Frontal Lobe

Catharina Donkels et al. Glia. 2025 May.

Abstract

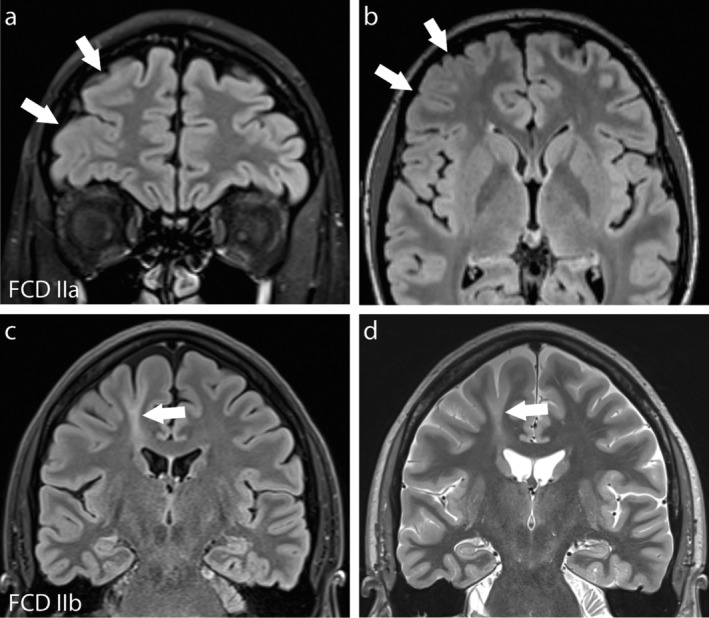
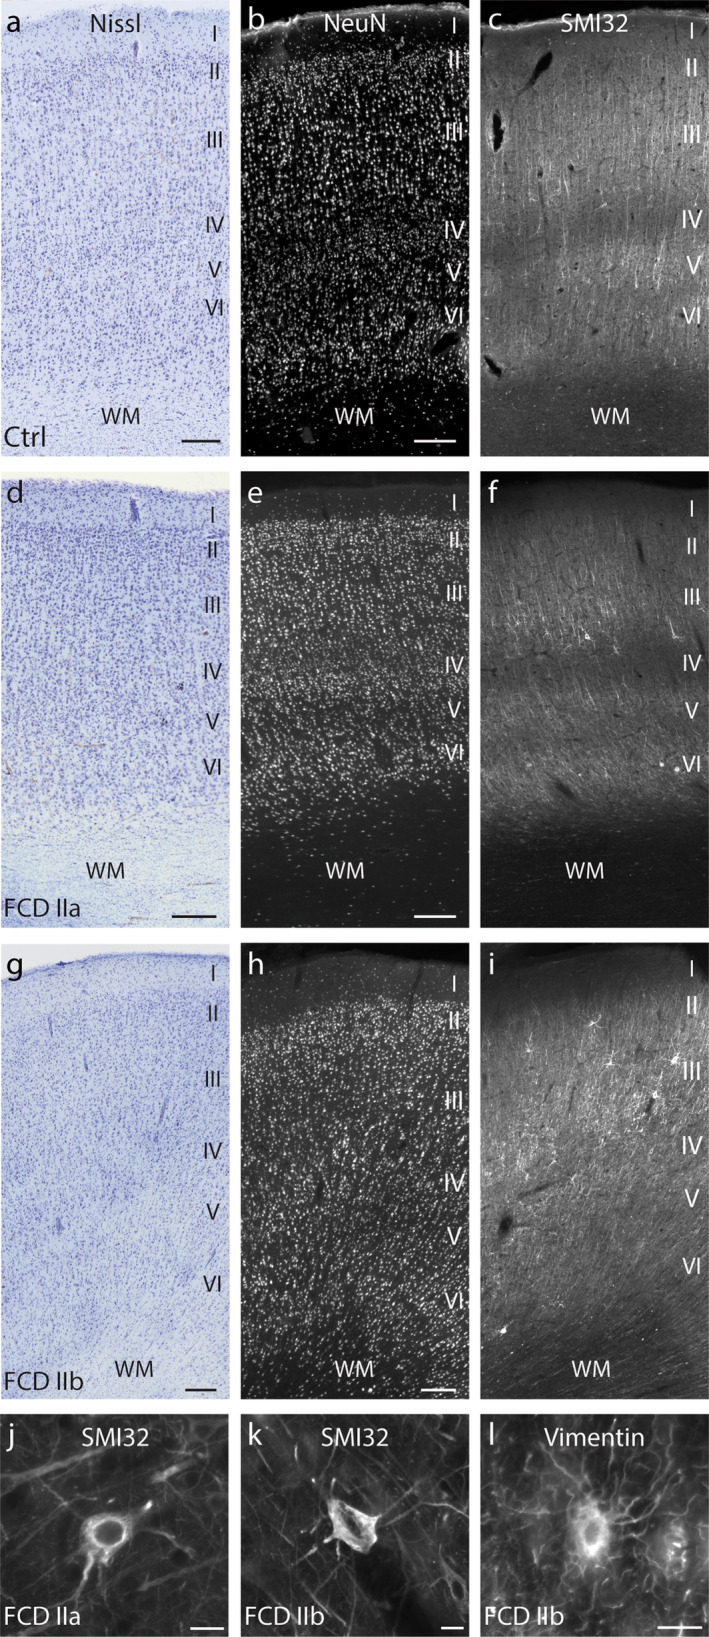
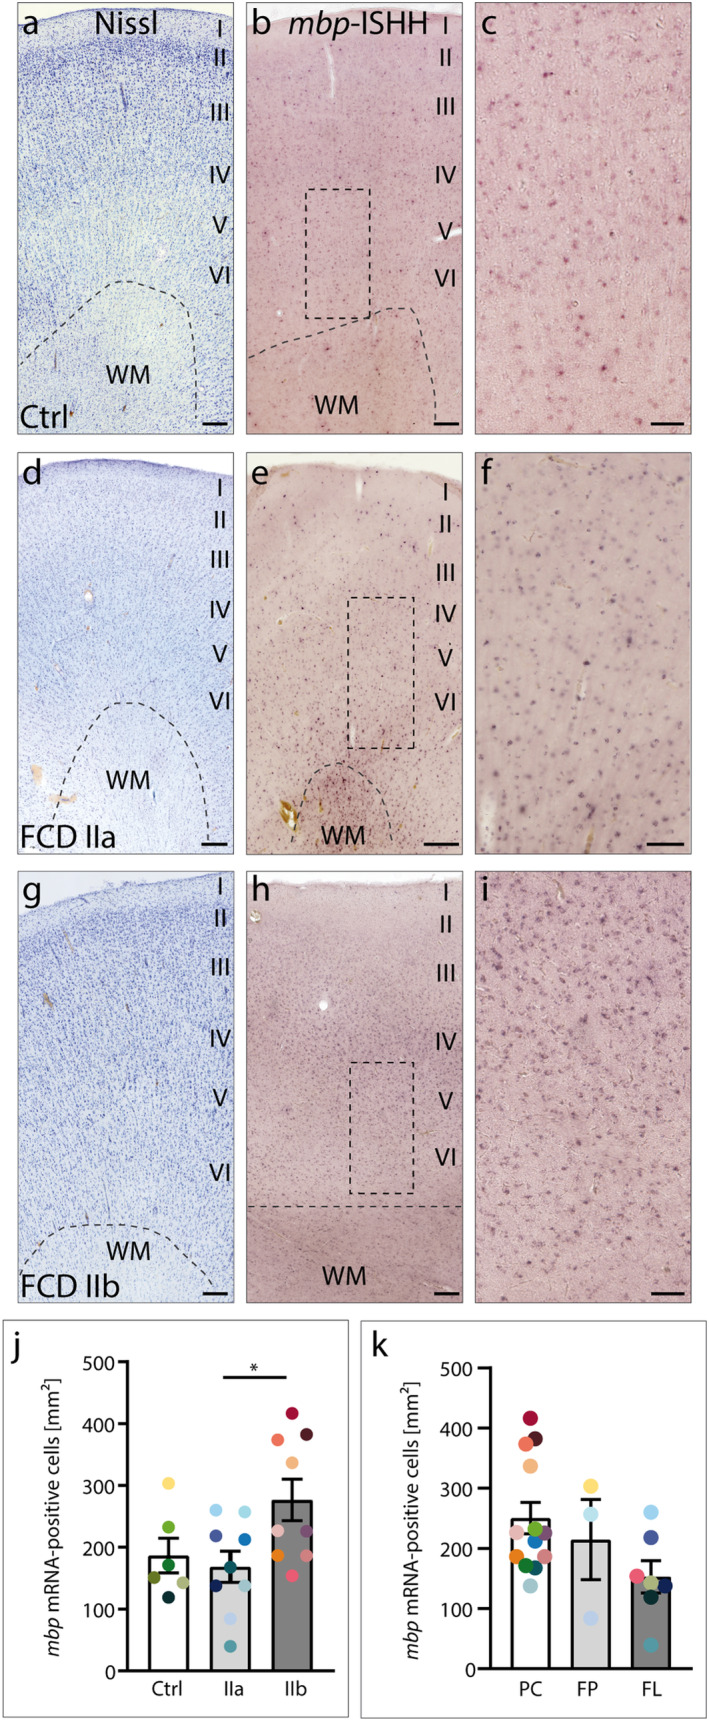
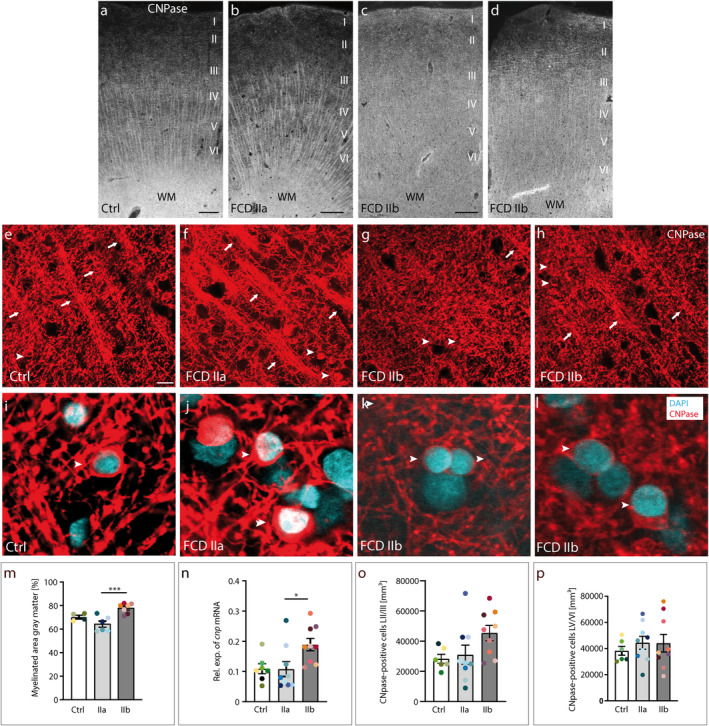
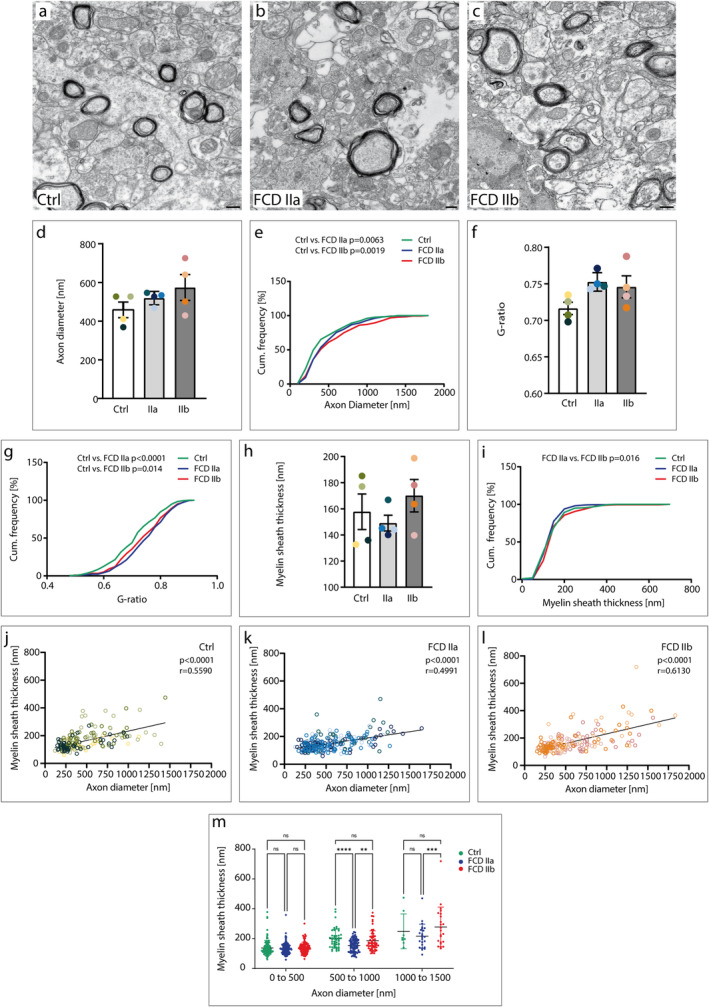
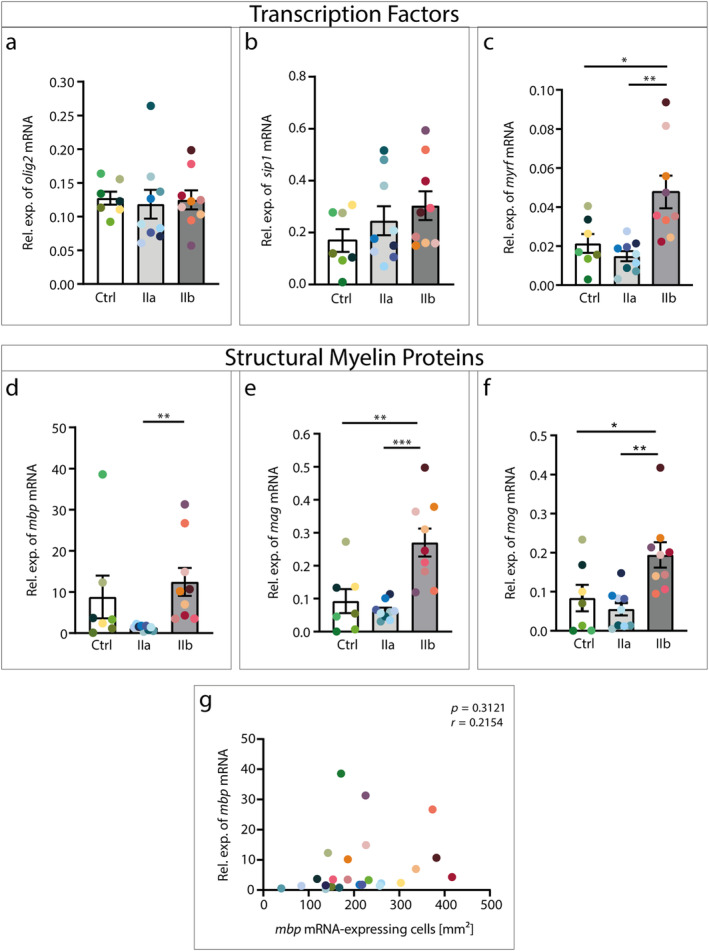
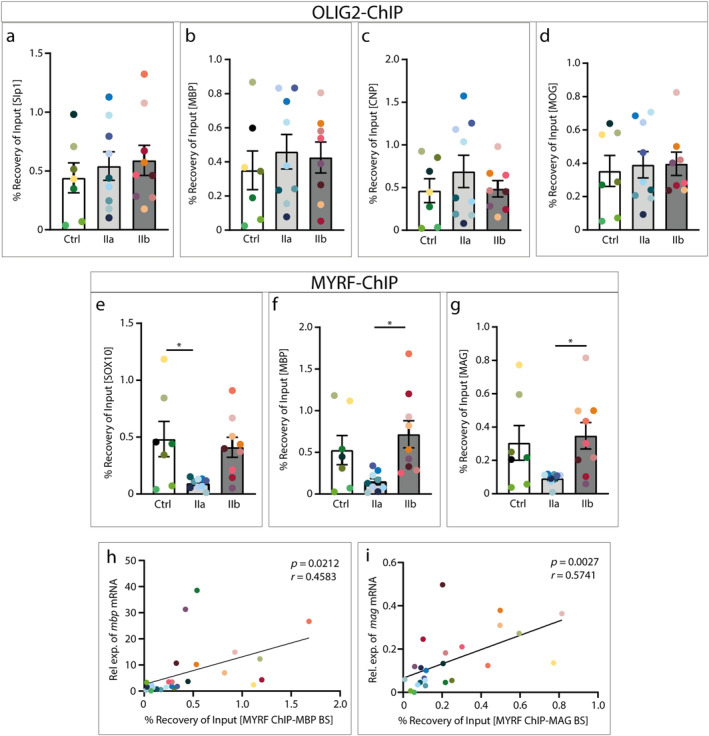
Focal cortical dysplasias (FCDs) are local malformations of the human neocortex and a leading cause of intractable epilepsy. FCDs are classified into different subtypes including FCD IIa and IIb, characterized by a blurred gray-white matter boundary or a transmantle sign indicating abnormal white matter myelination. Recently, we have shown that myelination is also compromised in the gray matter of FCD IIa of the temporal lobe. Since myelination is key for brain function, which is imbalanced in epilepsy, in the current study, we investigated myelination in the gray matter of FCD IIa and IIb from the frontal lobe on the morphological, ultrastructural, and transcriptional level. We found that FCD IIa presents with an ordinary radial myelin fiber pattern, but with a reduced thickness of myelin sheaths of 500-1000 nm thick axons in comparison to FCD IIb and with an attenuation of the myelin synthesis machinery. In contrast, FCD IIb showed an irregular and disorganized myelination pattern covering an enlarged area in comparison to FCD IIa and controls and with increased numbers of myelinating oligodendrocytes (OLs). FCD IIb had significantly thicker myelin sheaths of large caliber axons (above 1000 nm) when compared to FCD IIa. Accordingly, FCD IIb showed a significant up-regulation of myelin-associated mRNAs in comparison to FCD IIa and enhanced binding capacities of the transcription factor MYRF to target sites in myelin-associated genes. These data indicate that FCD IIa and IIb are characterized by a differential dysregulation of myelination in the gray matter of the frontal lobe.

Keywords: axon; chromatin; cortical malformation; epilepsy; neocortex; oligodendrocyte; transcriptional regulation.


Conflict of interest statement

The authors declare no conflicts of interest.

Figures

FIGURE 1
FIGURE 1
Presurgical MRI of FCD IIa and IIb patients. Representative 3 T MRI of two patients with frontal FCD IIa (a, b) and FCD IIb (c, d) illustrating their differing macroscopic phenotype. Subtle cortical thickening and blurring is seen at the gray‐white matter junction in FCD IIa (arrows in a, b; a: coronal, b: axial, both FLAIR). FCD IIb presents with a transmantle and deep sulcus sign (arrows in c, d; c: FLAIR, d: T2 STIR; both coronal).
FIGURE 2
FIGURE 2
Histological characteristics of epileptic non‐dysplastic control, FCD IIa and FCD IIb specimens in the frontal lobe. Representative photomicrographs of cresyl violet‐stained (a, d, g) and NeuN‐ (all neurons) (b, e, h) or SMI32‐immunolabeled (pyramidal neurons in layers III and V) tissue sections (c, f, i). Note the clear hexalamination and the presence of normally shaped pyramidal cells in layers II/III and V/VI in the control case (BA 46) (a, b, c.) The FCD IIa case (BA 9) shows a radial lamination disturbance with hypercolumnization (d, e) and dysmorphic neurons across all layers (f). The FCD IIb case (BA 6) presents a loss of clear lamination, dysmorphic neurons across all layers (g, h, i) and balloon cells in the subcortical white matter. Detailed images of SMI32‐positive cells reveal the characteristic shape of dysmorphic neurons in FCD IIa (j) and FCD IIb (k). The hallmark of FCD IIb is the presence of Balloon cells which are visualized by vimentin staining (l). BA: Brodmann area; WM: White matter; Scale bars: (a–i) 250 μm; (j–l) 20 μm. I‐VI: Cortical layers.
FIGURE 3
FIGURE 3
Distribution of mbp mRNA‐expressing OLs in the gray matter of frontal lobe control and FCD type II specimens. Representative photomicrographs of cresyl violet‐stained (a, d, g) and mbp‐ISHH‐processed (b, c, e, f, h, i) tissue sections of controls (a–c), FCD IIa (d–f) and FCD IIb (g–i) cases. ROIs in (b, e, h) indicate the magnified areas shown on the right. Mbp mRNA‐expressing OLs are loosely distributed the gray matter. Counting of these cells in all cortical layers reveals significantly higher cell numbers in FCD IIb when compared to FCD IIa (one‐way ANOVA F = 4.084, p = 0.0317; Tukey's post hoc test: FCD IIa vs. FCD IIb p = 0.0334) (j). Histogram (k) comparing OL numbers in different frontal lobe areas (PC: precentral, FP: fronto‐polar, FL: fronto‐lateral). Note that there is no significant difference in mbp‐positive cell numbers between the different frontal lobe areas (Kruskal–Wallis test: P = 0.0947). Error bars: SEM. Individual patients are color‐coded: Greenish: Control, blueish: FCD IIa, redish: FCD IIb. WM, white matter; scale bars: (a, b, d, e, g, h) 250 μm; (c, f, i) 100 μm, I‐VI, cortical layers.
FIGURE 4
FIGURE 4
Myelination pattern in control, FCD IIa and IIb cases from the frontal lobe. Representative photomicrographs of tissue sections  immunolabeled for CNPase (marker for myelin, pre‐OLs and OLs) in the gray matter of control (a), FCD IIa (b) and FCD IIb (c, d) cases. The radially aligned CNPase‐positive fibers reach the border of layer III in control and FCD IIa (a, b). In FCD IIb, CNPase‐immunolabeled fibers show a disparate distribution with areas of disorganization (c) or radial alignment reaching up to layer II (d). High resolution confocal imaging in layers V and VI reveals the dense network of myelinated fibers and myelinating OLs and pre‐Ols (e–h). Individual micrographs of confocal stacks are shown. In controls and FCD IIa, horizontal and radial CNPase‐labeled fiber strands (arrows), pre‐OL and OL cell bodies (arrow heads) are present (e, f). In FCD IIb, this pattern of myelinated fibers is either severely disorganized (g) or less developed (h). (i–l) Detailed images of CNPase‐positive pre‐OLs and OLs counterstained with DAPI. (m) The percentage of the myelinated area in the gray matter is significantly larger in FCD IIb compared to control and FCD IIa (one‐way ANOVA, F = 12.01; p = 0.0009). (n) RT‐qPCR demonstrates significantly increased cnp mRNA levels in FCD IIb compared to FCD IIa (Kruskal–Wallis p = 0.0244, Dunn's multiple comparisons test: P = 0.0375). (o, p) Quantification of CNPase‐expressing pre‐OL and OL cell bodies in layers II/III (k) and V/VI (l) separately reveals similar cell numbers in all cases (layers II/III: One‐way ANOVA, F = 2.910, p = 0.0766; layers V/VI: one‐way ANOVA, F = 0.3356, p = 0.7187). Error bars: SEM. Colored dots identify individual patients, greenish: Control, blueish: FCD IIa, redish: FCD IIb. Scale bars: (a–d) 250 μm; (e–h) 20 μm; WM, white matter. I‐VI: Cortical layers.
FIGURE 5
FIGURE 5
Ultrastructure of myelinated axons in FCD II types of the frontal lobe. Representative electron photomicrographs of myelinated axons in layers V/VI of control (a), FCD IIa (b) and FCD IIb (c) specimens. (d) Bar graphs demonstrating that the mean axon diameters of FCD IIa, FCD IIb and controls are similar (one‐way ANOVA, F = 1.569, p = 0.2603). (e) The cumulative frequency plot shows significantly increased axon diameters in both FCD II types (Kruskal–Wallis test, p = 0.001; Dunn's multiple comparison test: Control vs. FCD IIa p = 0.0063, control vs. FCD IIb p = 0.0019). (f) The mean g‐ratio is equal in all three groups (one‐way ANOVA, F = 3.316, p = 0.0834). (g) The cumulative frequency of g‐ratios shows significantly higher g‐ratios for FCD IIb and FCD IIa (Kruskal–Wallis test, p < 0.0001; Dunn's multiple comparison test: Control vs. FCD IIa p < 0.0001, control vs. FCD IIb p = 0.0142). (h) Bar graph demonstrating the mean myelin sheath thickness which is similar in the three analyzed groups (one‐way ANOVA F = 0.8886, p = 0.4444). (i) The cumulative frequency of myelin sheath thickness does not reveal differences between controls and both FCD types but a significant increase of FCD IIb in comparison to FCD IIa (Kruskal–Wallis test, p = 0.0204; Dunn's multiple comparison tests: FCD IIa vs. FCD IIb p = 0.0158). (j–l) Correlation plots of axon diameters versus myelin sheath thickness. (j) Controls, (k) FCD IIa and (l) FCD IIb. There is a significant correlation of axon diameters and the thickness of myelin sheaths for controls (Pearson's correlation: R = 0.559, p < 0.0001), FCD IIb (Pearson's correlation: R = 0.613, p < 0.0001) and for FCD IIa (Pearson's correlation: R = 0.4991, p < 0.0001). (m) Binning of axon diameters in groups of 0–500, 500–1000 and 1000–1500 nm. Axons of 500–1000 nm have significantly thinner myelin sheaths in FCD IIa compared to controls and FCD IIb (Two‐Way ANOVA: α = 0.05; Tukey multiple comparison test: Control vs. FCD IIa p < 0.0001; control vs. FCD IIb p = 0.3991; FCD IIa vs. FCD IIb p = 0.0039) and axons of 1000–1500 nm have significantly thicker myelin sheaths in FCD IIb when compared to FCD IIa (two‐way ANOVA: α = 0.05; Tukey multiple comparison test: Control vs. FCD IIa p = 0.3185; control vs. FCD IIb p = 0.3925; FCD IIa vs. FCD IIb p = 0.0004). Error bars: SEM. Colored dots represent individual patients, greenish: Control, blueish: FCD IIa, redish: FCD IIb. Scale bars (a–c): 250 nm.
FIGURE 6
FIGURE 6
Expression levels of transcription factor and myelin‐associated transcripts in frontal lobe FCD IIa and IIb. All mRNA levels were quantified by real‐time RT‐qPCR. The expression of the transcription factor mRNAs olig2 (Kruskal–Wallis p = 0.6391) (a) and sip1 (one‐way ANOVA, F = 1.487, p = 0.2480) (b) are similar in all groups. The mRNA levels of myrf (c) and of the myelin components mag (e) and mog (f) are significantly increased in FCD IIb when compared to controls and reduced in FCD IIa when compared to FCD IIb [(myrf: One‐way ANOVA, F = 9.054, p = 0.0014; Tukey's post hoc test: Control vs. FCD IIa p = 0.7367, control vs. FCD IIb p = 0.0159, FCD IIa vs. FCD IIb p = 0.0015), (mag: One‐way ANOVA F = 12.64, p = 0.0002; Tukey's post hoc test: Control vs. FCD IIa p = 0.8064, control vs. FCD IIb p = 0.0029, FCD IIa vs. FCD IIb p = 0.0003), (mog: One‐way ANOVA F = 7.302, p = 0.0037; Tukey's post hoc test: Control vs. FCD IIa p = 0.7709, control vs. FCD IIb p = 0.0323, FCD IIa vs. FCD IIb p = 0.0039)]. There is a significant increase of mbp mRNA level in FCD IIb when compared to FCD IIa (mbp: Kruskal–Wallis, p = 0.0016; Dunn's multiple comparisons test: Control vs. FCD IIa p = 0.2230, control vs. FCD IIb p = 0.3488, FCD IIa vs. FCD IIb p = 0.0010). (g) There is no correlation between the numbers of mbp‐expressing OLs and mbp mRNA levels (Pearson's correlation: R = 0.2154; p = 0.3121) error bars: SEM. Colored dots represent individual patients, greenish: Control, blueish: FCD IIa, redish: FCD IIb.
FIGURE 7
FIGURE 7
Transcription factor‐binding capacities to target sites of myelin‐associated genes. OLIG2 (a–d) and MYRF (e–g) binding sites were precipitated using ChIP assays and quantified using real‐time qPCR. The amounts of precipitated DNA are presented as the percentage of input DNA. The binding capacities of OLIG2 to the SIP1 (a), MBP (b), CNP (c), and MOG (d) target sites are similar in all analyzed groups [(OLIG2 on SIP1: One‐way ANOVA, F = 0.3313, p = 0.7215), (OLIG2 on MBP: One‐way ANOVA F = 0.2883, p = 0.7525), (OLIG2 on CNP: One‐way ANOVA, F = 0.6954, p = 0.5100), (OLIG2 on MOG: Kruskal–Wallis p = 0.9582)]. However, MYRF has significantly lower binding potential to the SOX10 binding site (e) in FCD IIa when compared to control (MYRF on SOX10: One‐way ANOVA, F = 5.006, p = 0.0162; Tukey's post hoc test: Control vs. FCD IIa p = 0.0228, control vs. FCD IIb p = 0.8562, FCD IIa vs. FCD IIb p = 0.0505) and to the MBP (f), and MAG (g) target sites in FCD IIa when compared to FCD IIb [(MYRF on MBP: One‐way ANOVA F = 4.965, p = 0.0166; Tukey's post hoc test: Control vs. FCD IIa p = 0.1541, control vs. FCD IIb p = 0.6000, FCD IIa vs. FCD IIb p = 0.0137), (MYRF on MAG: Kruskal–Wallis p = 0.0431; Dunn‘s multiple comparison test: Control vs. FCD IIa p = 0.2828, control vs. FCD IIb p > 0.9999, FCD IIa vs. FCD IIb p = 0.0448)]. Pearson's correlation of MYRF‐binding capacities with mpb (i) and mag (j) mRNA expression levels was performed for the percentage of input values from the ChIP assays with the relative expression values of the RT‐qPCRs. Significant correlations are present between MYRF‐binding capacities to MBP and MAG binding sites and mpb (i) and mag (j) mRNA levels, in particular for FCD IIb (Pearson's correlations for mbp: R = 0.4583, p = 0.0212 and mag: R = 0.5741, p = 0.0027). Error bars: SEM. Colored dots represent individual patients, greenish: Control, blueish: FCD IIa, redish: FCD IIb.

Similar articles

Cited by

References

    1. Abdijadid, S. , Mathern G. W., Levine M. S., et al. 2015. “Basic Mechanisms of Epileptogenesis in Pediatric Cortical Dysplasia.” CNS Neuroscience and Therapeutics 21: 92–103. - PMC - PubMed
    1. Almeida, R. G. , and Lyons D. A.. 2017. “On Myelinated Axon Plasticity and Neuronal Circuit Formation and Function.” Journal of Neuroscience 37: 10023–10034. - PMC - PubMed
    1. Baldassari, S. , Ribierre T., Marsan E., et al. 2019. “Dissecting the Genetic Basis of Focal Cortical Dysplasia: A Large Cohort Study.” Acta Neuropathologica 138: 885–900. - PMC - PubMed
    1. Baumann, N. , and Pham‐Dinh D.. 2001. “Biology of Oligodendrocyte and Myelin in the Mammalian Central Nervous System.” Physiological Reviews 81: 871–927. - PubMed
    1. Bernasconi, A. , Cendes F., Theodore W. H., et al. 2019. “Recommendations for the Use of Structural Magnetic Resonance Imaging in the Care of Patients With Epilepsy: A Consensus Report From the International League Against Epilepsy Neuroimaging Task Force.” Epilepsia 60: 1054–1068. - PubMed

MeSH terms

Substances

Supplementary concepts

LinkOut - more resources