. 2025 Feb 19;113(4):554-571.e14.
doi: 10.1016/j.neuron.2024.11.018. Epub 2024 Dec 23.

A neurodegenerative cellular stress response linked to dark microglia and toxic lipid secretion

Affiliations

A neurodegenerative cellular stress response linked to dark microglia and toxic lipid secretion

Anna Flury et al. Neuron. .

Abstract

The brain's primary immune cells, microglia, are a leading causal cell type in Alzheimer's disease (AD). Yet, the mechanisms by which microglia can drive neurodegeneration remain unresolved. Here, we discover that a conserved stress signaling pathway, the integrated stress response (ISR), characterizes a microglia subset with neurodegenerative outcomes. Autonomous activation of ISR in microglia is sufficient to induce early features of the ultrastructurally distinct "dark microglia" linked to pathological synapse loss. In AD models, microglial ISR activation exacerbates neurodegenerative pathologies and synapse loss while its inhibition ameliorates them. Mechanistically, we present evidence that ISR activation promotes the secretion of toxic lipids by microglia, impairing neuron homeostasis and survival in vitro. Accordingly, pharmacological inhibition of ISR or lipid synthesis mitigates synapse loss in AD models. Our results demonstrate that microglial ISR activation represents a neurodegenerative phenotype, which may be sustained, at least in part, by the secretion of toxic lipids.

Keywords: Alzheimer’s disease; ISR; dark microglia; integrated stress response; lipid secretion; lipotoxicity; microglia; neurodegeneration; neurotoxic microglia; non-cell-autonomous stress.


Conflict of interest statement

Declaration of interests The authors declare no competing interests.

Figures
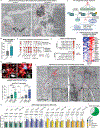
Figure 1.
Figure 1.. The presence of microglia with cellular stress and ISR activation in AD patients and mouse models.
(A) Representative electron micrographs show typical and dark microglia (TM, DM, respectively) in the prefrontal cortex of a 92-year-old healthy female control individual (left) and a 91-year-old female patient with AD (right), where TM and DM are adjacent to an Aβ plaque and dystrophic neurites (DN). Red outline: cellular membrane. Blue outline: nuclear membrane. 3rd: tertiary lysosomes. Scale bars = 5 μm. (B) Bar graph shows the number of dark microglia per mm2 in AD patients and healthy aged controls (n=3/group, Table S1). (C) Schematic shows integrated stress response (ISR)—adapted from “Stress Response Mechanism in Cells” by BioRender.com (2023). (D) Balloon plot represents the p-value (size) and z-score (color) for Ingenuity Pathway Analysis (IPA) of upstream regulator enrichment. The first column uses differentially regulated genes (p-value<0.05, baseMean>20 by DESeq2, Table S2) in microglia-specific ribosomal profiling by translating ribosome affinity purification sequencing from 5xFAD (n=4) vs. control (n=5) mice. The following columns use marker genes for indicated human microglia subsets (hMG) identified by Sun et al. and Olah et al.. DAM: disease-associated microglia. TF: Transcription factor. (E) Balloon plot represents the p-value (size) and normalized enrichment score (NER, color) of Gene Set Enrichment Analysis (GSEA) of ATF4 targets. The rows use differentially enriched genes in microglia ribosomal profiling from control (n=5) and 5xFAD (n=4) mice, as well as those identified in Prater et al. (AD vs. control in clusters 1 & 2), Gerrits et al. (AD1 vs. homeostatic), Mathys et al. (AD vs. control), Hasselmann et al. (DAM vs. homeostatic; iMgl: human induced pluripotent stem cell-derived microglia), Srinivasan et al. (AD vs. control),, Krasemann et al. (APP/PS1 vs. control), Wang et al. (5xFAD vs. control), Sobue et al. (AppNL-G-F /NL-G-F vs. control and Tau P301L vs. control), and Keren-Shaul et al. (DAM vs. homeostatic). (F) Heatmap shows z-scored variance stabilizing transformation (vst, gene expression score) of ATF4 target ISR genes in microglia ribosomal profiling from control (n=5) and 5xFAD mice (n=4). Each column represents an individual sample/mouse. (G) Representative immunofluorescence micrographs (top) and quantification (bottom) of p-eIF2α levels in microglia. p-eIF2α: green, CD11b+ microglia: red, ThioS+ dense-core plaques: blue, DRAQ5+ nuclei: gray. Scale bars = 10 μm. The insets show a zoomed-in p-eIF2αlow microglial cytosol in control and a zoomed-in p-eIF2αhigh microglial cytosol in the 5xFAD mouse. Bar graphs show the percentage of p-eIF2αhigh microglia (for 5xFAD >1 a.u. in Fig. S1H; for PS19 >20 a.u. in Fig. S1J) in the cortex of left: 6-month-old control (n=5) and 6-month-old 5xFAD mice (n=7), and right: 6–8-month-old control (n=5) and 8-month-old PS19 mice (n=8). A representative image for PS19 mice is shown in Fig. S1J. In 5xFAD and PS19 mice, microglia (including protrusions) <5 μm away from an aggregate are deemed “proximal” and rest “distal.” A minimum of 55, a maximum of 260, and an average of 120 cells were counted per mouse. (H) Bar graphs show the qPCR of Atf4 and ATF4 target genes (normalized to microglia marker Hexb) in BV2 cells treated with vehicle (DMSO & PBS), aggregated amyloid β (Aβ, 0.05 μM), aggregated tau (0.05 μM), ceramide (10 μM), cholesterol (20 μM), with or without PERK inhibitor (PERKi, 0.25μM GSK2606414). n=3–4 independent experiments/condition. (I) Representative electron microscographs show typical microglia (TM) contacting an Aβ plaque (left) and two adjacent dark microglia (DM) contacting a dystrophic neurite (DN, right) in isocortex from 5xFAD mice. Red outline: cellular membrane. Blue outline: nuclear membrane. The insets show zoomed-in p-eIF2α immunostaining as diffuse, granular precipitates decorating the ER cisternae (right) and p-eIF2α-negative regions (left). Yellow plus: ER. White plus: p-eIF2α+ ER. Orange hash: mitochondria. White asterisk: Golgi apparatus. 3rd: tertiary lysosomes. BV: blood vessel. Scale bars = 5 μm. (J) Pie chart shows the percentage of p-eIF2α+ (green) dark microglia (n=109 cells counted from two 5xFAD mice). (D-F) Control mice: Cx3cr1CreErt2/+; Eef1a1LSL.eGFPL10a/+. 5xFAD mice: Cx3cr1CreErt2/+; Eef1a1LSL.eGFPL10a/+ ; 5xFAD. The cortex of 6-month-old mice was used. (B) Unpaired two-tailed t-test. (G, H) One-way ANOVA with multiple comparisons. (B, G, H) Bar graphs with individual data points show mean ± SEM. See also Figure S1.
Figure 2.
Figure 2.. Generation and characterization of mouse models that allow microglia-specific ISR modulation.
(A) Schematic shows the iPKR and Eif2A transgenic mice. (B) Bar graph shows mass spectrometry of ASV in wild-type mice (n=4 mice/group) exposed to saline or VEGF followed by a single oral vehicle or asunaprevir (ASV) administration 30 minutes later, as depicted in Fig. S2A. Tissue was collected 2 hours after ASV. (C) Bar graph shows the qPCR of Atf4 from microglia translating ribosome affinity purification from animals injected with VEGF followed by a single oral vehicle or ASV 30 minutes later, as depicted in Fig. S2A (n=4/group). Tissue was collected 2 hours after ASV. (D) Schematic shows the chronic treatment of iPKR mice. (E) Representative immunofluorescence micrographs (left) and quantification (right). p-eIF2α: red, CD11b+ microglia: green, DRAQ5+ nuclei: gray. Scale bars = 10 μm. Bar graphs show the mean p-eIF2α intensity (arbitrary units, a.u.) in microglial cytosol and microglial cell volume (mm3) in the cortex of 6-month-old ASV-treated control (n=6), ASV-treated iPKR (n=6), and Eif2A mice (n=3). (F) Heatmap shows log2 (fold change, FC) of ATF4 target genes by DESeq2 (Table S2) of microglia ribosomal profiling data. Each column represents a pairwise comparison between indicated groups. Bidirectionally regulated genes: Genes induced by integrated stress response (ISR) activation and inhibited by ISR inhibition. ISR-activated shared genes: Genes induced by ISR activation but not inhibited by ISR inhibition that are also XBP1 target genes. (G, H) Balloon plots represent the p-value (size) and z-score (color) for Ingenuity Pathway Analysis (IPA) of upstream regulators (G) and pathways (H) enriched for differentially regulated genes identified by DESeq2 (p-value<0.05, baseMean>20, Table S2) in microglia ribosomal profiling. Each column represents a pairwise comparison between indicated groups. DAM: disease-associated microglia. TF: Transcription factor. The BHLHE40 target genes upregulated in iPKR mice were largely glycolytic and fatty acid metabolism genes, including Hk1, Hk2, Pfkp, Pla2g4a, and St3gal5. (F-H) Control mice (n=5) were used as controls for the Eif2A (n=4), 5xFAD (n=4), and 5xFADEif2A (n=3) mice. iPKR control mice (Vehicle-treated, VEGF followed by DMSO:PEG, n=4) were used as controls for iPKR mice (n=5, ASV-treated) and 5xFADiPKR mice (n=4, ASV-treated). Control mice: Cx3cr1CreErt2/+; Eef1a1LSL.eGFPL10a/+. Eif2A mice: Cx3cr1CreErt2/+; Eef1a1LSL.eGFPL10a/+ ;Eif2s1A/A;Tg(fEif2s1). iPKR mice: Cx3cr1CreErt2/+; Eef1a1LSL.NS3.eGFPL10a.iPKR/+. 5xFAD mice: Cx3cr1CreErt2/+; Eef1a1LSL.eGFPL10a/+ ;5xFAD. 5xFADiPKR mice: Cx3cr1CreErt2/+;Eef1a1LSL.NS3.eGFPL10a.iPKR/+;5xFAD. 5xFADEif2A mice: Cx3cr1CreErt2/+; Eef1a1LSL.eGFPL10a/+ ;5xFAD;Eif2s1A/A;Tg(fEif2s1). The cortex of 6-month-old mice was used. (B, E) One-way ANOVA with multiple comparisons. (C) Unpaired two-tailed t-test (B, C, E) Bar graphs with individual data points show mean ± SEM. See also Figure S2.
Figure 3.
Figure 3.. Microglial ISR differentially impacts disease-associated microglia subsets characterized by cellular stress.
(A) Uniform manifold approximation and projection (UMAP) visualizations from single-nuclei RNA-sequencing of microglial nuclei from the cortex of 5xFAD, 5xFADiPKR, and 5xFADEif2A mice (n=2 pooled mice/sample) show disease-associated microglia (DAM) subclusters (Table S3). (B) The dot plot shows the average expression levels per cluster (color) and the percentage of cells (size) from each DAM subcluster from (A). ATF4 target genes are indicated. (C) Bar graph shows the proportions of DAM subclusters in each genotype from (A). (A-C) 5xFAD mice: Cx3cr1CreErt2/+; Eef1a1LSL.eGFPL10a/+ ;5xFAD. 5xFADiPKR mice: Cx3cr1CreErt2/+;Eef1a1LSL.NS3.eGFPL10a.iPKR/+;5xFAD. 5xFADEif2A mice: Cx3cr1CreErt2/+; Eef1a1LSL.eGFPL10a/+ ;5xFAD;Eif2s1A/A;Tg(fEif2s1). The cortex of 6-month-old mice was used. (D) Representative scanning electron micrographs from the isocortex of 6-month-old mice. Top row: Typical microglia (TM) from control (left), iPKR (middle), and Eif2A mice (right). Bottom row: Dark microglia (DM) from iPKR (left), 5xFADiPKR (middle), and 5xFADEif2A mice (right). The insets show zoomed-in views illustrating organelles. Red outline: cellular membrane. Blue outline: nuclear membrane. Orange hash: mitochondria. White asterisk: Golgi apparatus. Yellow plus: ER. 3rd: tertiary lysosomes. DN: dystrophic neurites. Scale bars = 5 μm. (E) Bar graphs show the number of dark microglia per mm2 in ASV-treated control Cx3cr1CreErt2/+ and iPKR mice (n=3/group)—unpaired two-tailed t-test. Bar graph with individual data points shows mean ± SEM. See also Figure S3.
Figure 4.
Figure 4.. Microglial ISR has a detrimental impact on AD-associated pathologies.
(A) Representative immunofluorescence micrographs (left) and quantification (right). CD11b+ microglia: red; BACE1+ axonal dystrophies: green; ThioS+ dense-core plaques: blue; DRAQ5+ nuclei: gray. Scale bars = 10 μm. Bar graphs show the total ThioS+ plaque volume and BACE1+ axonal dystrophy area normalized to ThioS+ plaque numbers in the cortex of 6-month-old 5xFAD (n=14 for plaque quantification, n=12 for axonal dystrophy quantification), 5xFADiPKR (n=10), and 5xFADEif2A mice (n=10). (B) Bar graphs show microglia proximal to plaques (<5 μm including protrusions) per plaque and plaque infiltration by microglia (microglial volume within plaques per plaque volume) in the cortex of 6-month-old 5xFAD (n=14), 5xFADiPKR (n=10), and 5xFADEif2A mice (n=10). (C) Representative composite brightfield and green fluorescence images (left) and quantifications (right). BV2 cells: brightfield; Alexa-488-labeled Aβ42: green. Scale bars = 100 μm. Cells that uptake Aβ42 appear bright green. The representative line graph shows the time course of fluorescent Aβ−488 uptake by microglia treated with vehicle (DMSO), Salubrinal derivative Sal003 (10 μM SLB), or ISR inhibitor (0.2 μM ISRIB). Experimental design shown in Fig. S4D. The uptake is measured by integrated green fluorescence normalized to confluency (n=3 wells/condition). PTime<0.0001; PTreatment=0.0647; PTime⨉Treatment <0.0001. Quantification from 6 independent experiments is shown in Fig. S4G. (D) Representative immunofluorescence micrographs (left) and quantification (right). Top: AT8+ hyperphosphorylated p-tau: green, NeuN+ neurons: red, CD31+ blood vessels: gray. Scale bars = 10 μm. Bottom: AT8+ hyperphosphorylated p-tau: green, IBA1+ microglia: red, DAPI+ nuclei: blue. Scale bars = 50 μm. Bar graphs show the total AT8+ p-tau volume within NeuN+ neurons in the cortex of 8-month-old PS19 (n=10), PS19iPKR (n=6), and PS19Eif2A mice (n=9, one outlier by Grubb’s test removed) and percent AT8+ p-tau volume within CD11b+ microglia in the cortex of 8-month-old PS19 (n=13, one outlier by Grubb’s test removed), PS19iPKR (n=6, one outlier by Grubb’s test removed), and PS19Eif2A mice (n=9). (E) Representative immunofluorescence micrographs (left) and quantification (right) show presynaptic VGLUT2+ puncta: gray. Scale bars = 10 μm. Bar graph shows VGLUT2 density normalized in the layer IV cortex of 6-month-old control (n=8), 5xFAD (n=10), 5xFADiPKR (n=9, one outlier by Grubb’s test removed), and 5xFADEif2A mice (n=11). (A, B, D, E) One-way ANOVA with multiple comparisons. Bar graphs with individual data points show mean ± SEM. (C) Two-way ANOVA with repeated measures. See also Figure S4.
Figure 5.
Figure 5.. ISR-induced lipid secretion by microglia has a toxic impact on neurons and OPCs.
(A) Heatmap shows log2 (fold change) of lipogenesis genes by DESeq2 (Table S2) of microglia ribosomal profiling data from the cortex of 6-month-old mice shown in Fig. 2F–H. Each column represents a pairwise comparison between indicated groups. DAG: diacylglyceride. TAG: triacylglyceride. (B) Schematic shows a simplified lipid synthesis pathway with significantly ISR-induced genes. Adapted from “Lipids and Proteins Involved in Lipid Uptake and Metabolism in Cardiac Lipotoxicity” by BioRender.com (2023). FA: Fatty acid. (C) Schematic shows the hypothesized model and drugs used in the study. Created with BioRender.com. SLB: Salubrinal derivative Sal003, ISRIB: ISR inhibitor, C75: FASN inhibitor. (D) Heatmap shows upregulated lipid species in the conditioned media of SLB-treated BV2 cells that were downregulated with ISRIB and C75 (MetaboAnalyst, FDR<0.1, Table S4) detected by untargeted lipidomics (n=5 wells/group). Each column represents an individual sample/well. The SLB experiment was independently repeated with ~95% between experiments. (E) Representative immunofluorescence micrographs (left) and quantification (right) show NeuN+ neuronal cells: green. Scale bars = 100 μm. Bar graph shows the number of NeuN+ cells/mm2. n=3–5 independent experiments/group, each individual experiment was normalized to its control (DMSO-CM). (F) Bar graph shows the percent change in the mean firing rate of primary neurons 1 hour after treatment compared to their baseline before drug treatment in an Axion multi-electrode array plate. n=5–9 independent experiments/condition. (G) Representative immunofluorescence micrographs (left) and quantification (right) show OLIG2+ oligodendrocyte lineage cells: red; DAPI+ nuclei: blue. Scale bars = 100 μm. Bar graph shows the number of OLIG2+ OPCs 24 hours after receiving conditioned media (CM) from BV2 cells treated as in (A). n=4 independent experiments/condition, each individual experiment was normalized to its control (DMSO-CM). (H) Schematic shows the tri-weekly 3-week-long treatment of 5xFAD mice with 10mg/kg C75 and 1 mg/kg ISRIB. (I) Representative immunofluorescence micrographs (left) and quantification (right) show presynaptic VGLUT2+ puncta: gray. Scale bars = 10 μm. Bar graph shows normalized VGLUT2 density in the layer IV cortex of 6-month-old vehicle-treated control (n=8), vehicle-treated 5xFAD (n=6), C75-treated 5xFAD (n=8), and ISRIB-treated 5xFAD mice (n=6). (E, G, I) One-way ANOVA with multiple comparisons. (F) Repeated measures one-way ANOVA with multiple comparisons. (E-G, I) Bar graphs with individual data points show mean ± SEM. See also Figure S5.

References

    1. Efthymiou AG & Goate AM Late onset Alzheimer’s disease genetics implicates microglial pathways in disease risk. Molecular neurodegeneration 12, 43–43, doi: 10.1186/s13024-017-0184-x (2017). - DOI - PMC - PubMed
    1. Nott A, Holtman IR, Coufal NG, Schlachetzki JCM, Yu M, Hu R, Han CZ, Pena M, Xiao J, Wu Y et al. Brain cell type–specific enhancer–promoter interactome maps and disease-risk association. Science 366, 1134–1139, doi: 10.1126/science.aay0793 (2019). - DOI - PMC - PubMed
    1. Masuda T, Sankowski R, Staszewski O & Prinz M Microglia Heterogeneity in the Single-Cell Era. Cell Reports 30, 1271–1281, doi: 10.1016/j.celrep.2020.01.010 (2020). - DOI - PubMed
    1. Chen Y & Colonna M Microglia in Alzheimer’s disease at single-cell level. Are there common patterns in humans and mice? Journal of Experimental Medicine 218, doi: 10.1084/jem.20202717 (2021). - DOI - PMC - PubMed
    1. Keren-Shaul H, Spinrad A, Weiner A, Matcovitch-Natan O, Dvir-Szternfeld R, Ulland TK, David E, Baruch K, Lara-Astaiso D, Toth B et al. A Unique Microglia Type Associated with Restricting Development of Alzheimer’s Disease. Cell 169, 1276–1290.e1217, doi: 10.1016/j.cell.2017.05.018 (2017). - DOI - PubMed

LinkOut - more resources