

Characterization of focused ultrasound blood-brain barrier disruption effect on inflammation as a function of treatment parameters
- PMID: 39719739
- PMCID: PMC11803570
- DOI: 10.1016/j.biopha.2024.117762
Characterization of focused ultrasound blood-brain barrier disruption effect on inflammation as a function of treatment parameters
Abstract
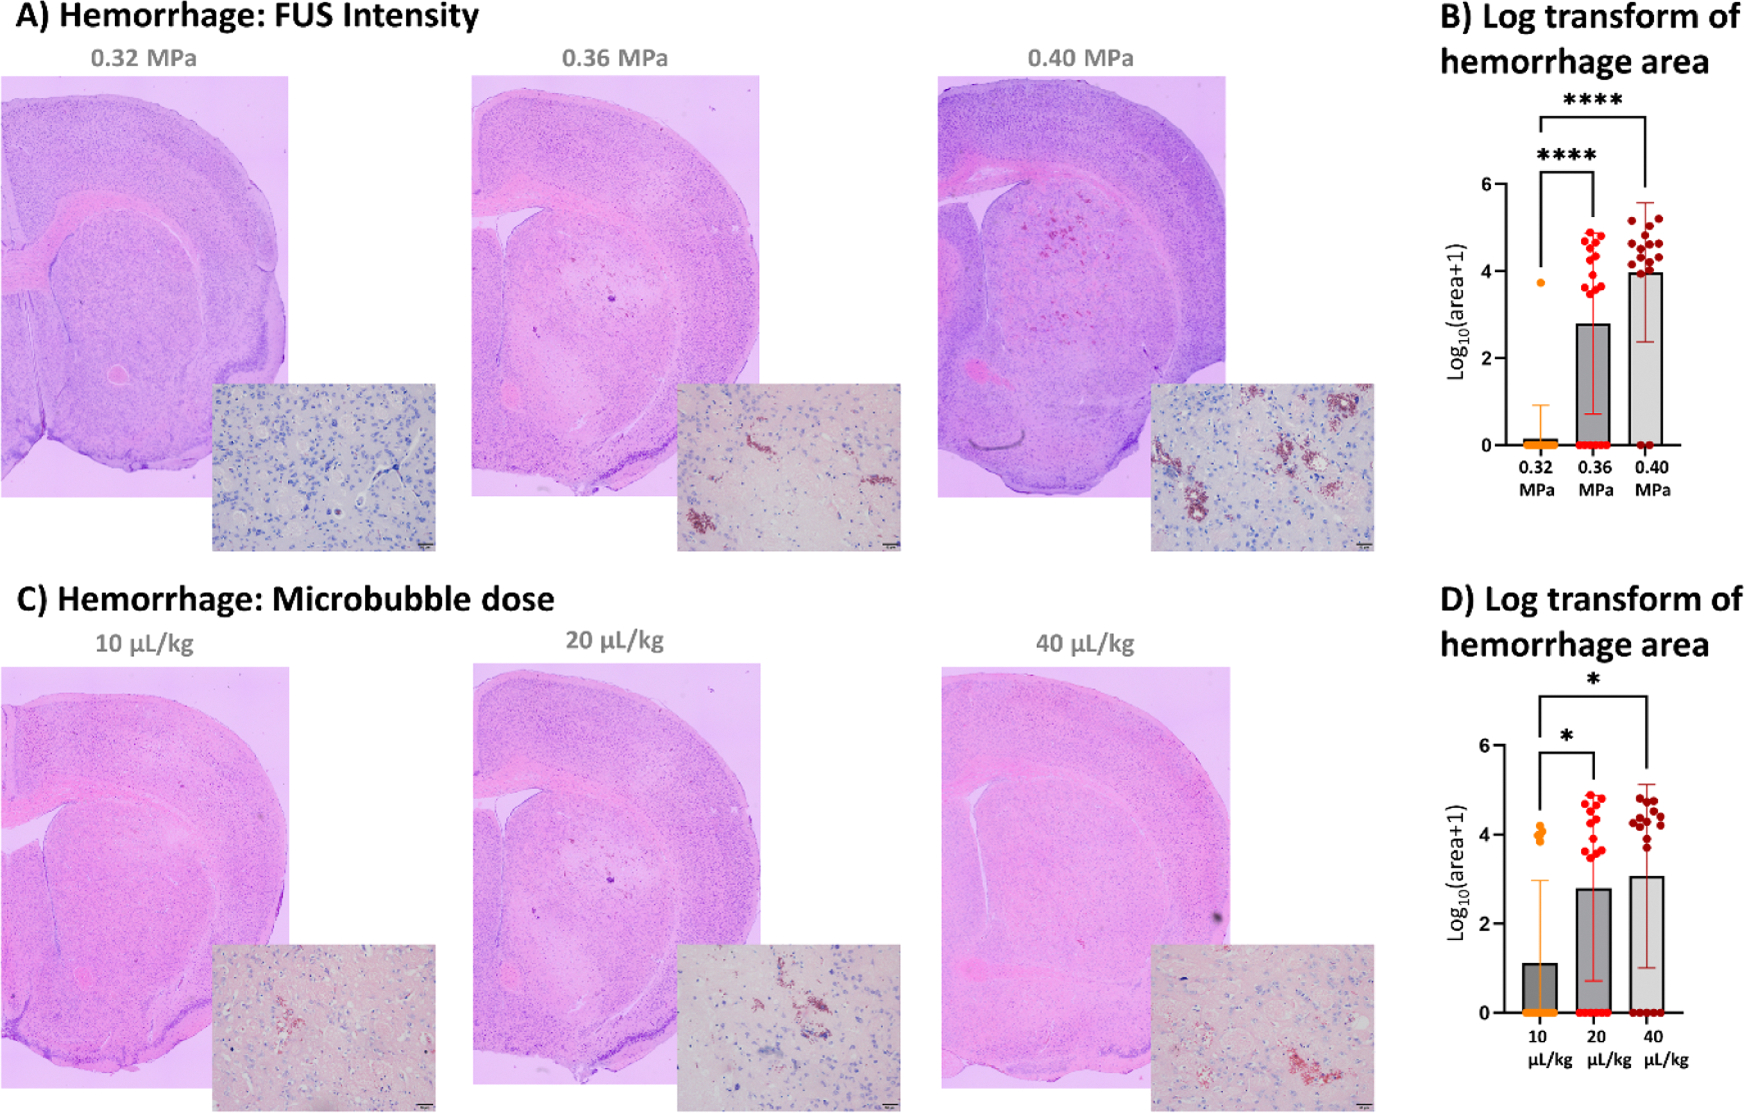
The technology of focused ultrasound-mediated disruption of the blood-brain barrier (FUS-BBB opening) has now been used in over 20 Phase 1 clinical trials to validate the safety and feasibility of BBB opening for drug delivery in patients with brain tumors and neurodegenerative diseases. The primary treatment parameters, FUS intensity and microbubble dose, are chosen to balance sufficient BBB disruption to achieve drug delivery against potential acute vessel damage leading to microhemorrhage. However, other safety considerations due to second order effects caused by BBB disruption, such as inflammation and alteration of neurovascular function, are only beginning to be understood. This study builds on previous work that has investigated the inflammatory response following FUS-BBB opening. In this study, we characterize the effect of FUS intensity, microbubble dose and single vs multiple treatments on the extent of BBB disruption, observed level of microhemorrhage, and degree of inflammatory response at acute post-treatment time points in the wild-type mouse brain. Results show that upregulation of pro-inflammatory markers is primarily driven by microbubble dose, with peak effects seen at 24 hours post-treatment. We additionally saw significantly elevated levels of cytokine and chemokine markers in female vs male mice, despite no sex differences in level of BBB disruption or microglia activation. Multiple treatments did not result in increased levels of pro-inflammatory markers compared to single treatment baseline. However, we did see an interesting elevation of the anti-inflammatory molecule eNOS after multiple treatments, indicating active mechanisms were at work to restore homeostasis in the brain environment.
Keywords: Blood-brain barrier; Focused ultrasound; Inflammation.
Copyright © 2024 The Authors. Published by Elsevier Masson SAS.. All rights reserved.
Conflict of interest statement
Declaration of Competing Interest The authors declare that they have no financial or non-financial competing interests related to this work.
Figures


Update of
-
Characterization of focused ultrasound blood-brain barrier disruption effect on inflammation as a function of treatment parameters.bioRxiv [Preprint]. 2024 Jul 16:2024.07.10.602776. doi: 10.1101/2024.07.10.602776. bioRxiv. 2024. Update in: Biomed Pharmacother. 2025 Jan;182:117762. doi: 10.1016/j.biopha.2024.117762. PMID: 39071338 Free PMC article. Updated. Preprint.
Similar articles
-
Characterization of focused ultrasound blood-brain barrier disruption effect on inflammation as a function of treatment parameters.bioRxiv [Preprint]. 2024 Jul 16:2024.07.10.602776. doi: 10.1101/2024.07.10.602776. bioRxiv. 2024. Update in: Biomed Pharmacother. 2025 Jan;182:117762. doi: 10.1016/j.biopha.2024.117762. PMID: 39071338 Free PMC article. Updated. Preprint.
-
Histologic evaluation of activation of acute inflammatory response in a mouse model following ultrasound-mediated blood-brain barrier using different acoustic pressures and microbubble doses.Nanotheranostics. 2020 Jul 14;4(4):210-223. doi: 10.7150/ntno.49898. eCollection 2020. Nanotheranostics. 2020. PMID: 32802731 Free PMC article.
-
Cavitation-modulated inflammatory response following focused ultrasound blood-brain barrier opening.J Control Release. 2021 Sep 10;337:458-471. doi: 10.1016/j.jconrel.2021.07.042. Epub 2021 Jul 27. J Control Release. 2021. PMID: 34324895 Free PMC article.
-
Focused ultrasound-mediated drug delivery through the blood-brain barrier.Expert Rev Neurother. 2015 May;15(5):477-91. doi: 10.1586/14737175.2015.1028369. Expert Rev Neurother. 2015. PMID: 25936845 Free PMC article. Review.
-
Ultrasound-induced blood-brain barrier opening.Curr Pharm Biotechnol. 2012 Jun;13(7):1332-45. doi: 10.2174/138920112800624364. Curr Pharm Biotechnol. 2012. PMID: 22201586 Free PMC article. Review.
Cited by
-
Brain Endothelial Cells in Blood-Brain Barrier Regulation and Neurological Therapy.Int J Mol Sci. 2025 Jun 18;26(12):5843. doi: 10.3390/ijms26125843. Int J Mol Sci. 2025. PMID: 40565303 Free PMC article. Review.
-
Updates on cancer vaccines in brain cancer: Advances in neuroblastoma, delivery systems, and emerging technologies.Hum Vaccin Immunother. 2025 Dec;21(1):2526964. doi: 10.1080/21645515.2025.2526964. Epub 2025 Jul 8. Hum Vaccin Immunother. 2025. PMID: 40627495 Free PMC article. Review.
References
-
- Rezai AR, et al., Focused ultrasound-mediated blood-brain barrier opening in Alzheimer’s disease: long-term safety, imaging, and cognitive outcomes, J. Neurosurg. 139 (2023) 275–283. - PubMed
-
- Hynynen K, McDannold N, Vykhodtseva N, Jolesz FA, Noninvasive MR imaging-guided focal opening of the blood-brain barrier in rabbits, Radiology 220 (2001) 640–646. - PubMed
MeSH terms
Substances
Grants and funding
LinkOut - more resources
Full Text Sources
