Type I interferon and mitochondrial dysfunction are associated with dysregulated cytotoxic CD8+ T cell responses in juvenile systemic lupus erythematosus
- PMID: 39719886
- PMCID: PMC11748002
- DOI: 10.1093/cei/uxae127
Type I interferon and mitochondrial dysfunction are associated with dysregulated cytotoxic CD8+ T cell responses in juvenile systemic lupus erythematosus
Abstract
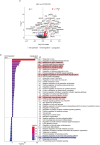
Juvenile systemic lupus erythematosus (JSLE) is an autoimmune condition which causes significant morbidity in children and young adults and is more severe in its presentation than adult-onset SLE. While many aspects of immune dysfunction have been studied extensively in adult-onset SLE, there is limited and contradictory evidence of how cytotoxic CD8+ T cells contribute to disease pathogenesis and studies exploring cytotoxicity in JSLE are virtually non-existent. Here, we report that CD8+ T cell cytotoxic capacity is reduced in JSLE versus healthy controls, irrespective of treatment or disease activity. Transcriptomic and serum metabolomic analysis identified that this reduction in cytotoxic CD8+ T cells in JSLE was associated with upregulated type I interferon (IFN) signalling, mitochondrial dysfunction, and metabolic disturbances when compared to controls. Greater interrogation of the influence of these pathways on altered cytotoxic CD8+ T cell function demonstrated that JSLE CD8+ T cells had enlarged mitochondria and enhanced sensitivity to IFN-α leading to selective apoptosis of effector memory (EM) CD8+ T cells, which are enriched for cytotoxic mediator-expressing cells. This process ultimately contributes to the observed reduction in CD8+ T cell cytotoxicity in JSLE, reinforcing the growing evidence that mitochondrial dysfunction is a key pathogenic factor affecting multiple immune cell populations in type I IFN-driven rheumatic diseases.
Keywords: CD8+ T cells; cytotoxicity; interferon; juvenile systemic lupus erythematosus.
© The Author(s) 2024. Published by Oxford University Press on behalf of the British Society for Immunology.
Conflict of interest statement
Unrelated to the work included in this paper, in the last 3 years, CC has been supported by a research grant from GSK awarded to UCL and has received speaker’s bureau honoraria from Novartis. LRW reports consultancy fees from Pfizer and Cabaletta, and speaker fee from Pfizer paid to UCL, unrelated to this study. LRW also reports research grants paid to UCL from Pfizer, Lilly and UCB, unrelated to this study
Figures


Similar articles
-
Increased apolipoprotein-B:A1 ratio predicts cardiometabolic risk in patients with juvenile onset SLE.EBioMedicine. 2021 Mar;65:103243. doi: 10.1016/j.ebiom.2021.103243. Epub 2021 Feb 24. EBioMedicine. 2021. PMID: 33640328 Free PMC article.
-
Type I interferons affect the metabolic fitness of CD8+ T cells from patients with systemic lupus erythematosus.Nat Commun. 2021 Mar 31;12(1):1980. doi: 10.1038/s41467-021-22312-y. Nat Commun. 2021. PMID: 33790300 Free PMC article.
-
Circulating CD8 + LGALS9 + T Cell Population Exhibiting Low Cytotoxic Characteristics are Decreased in Patients with Systemic Lupus Erythematosus.Immunol Res. 2024 Dec;72(6):1238-1246. doi: 10.1007/s12026-024-09522-4. Epub 2024 Jul 24. Immunol Res. 2024. PMID: 39046608
-
CD8+ T-Cells in Juvenile-Onset SLE: From Pathogenesis to Comorbidities.Front Med (Lausanne). 2022 Jun 21;9:904435. doi: 10.3389/fmed.2022.904435. eCollection 2022. Front Med (Lausanne). 2022. PMID: 35801216 Free PMC article. Review.
-
Mitochondrial Dysfunction in Systemic Lupus Erythematosus with a Focus on Lupus Nephritis.Int J Mol Sci. 2024 Jun 3;25(11):6162. doi: 10.3390/ijms25116162. Int J Mol Sci. 2024. PMID: 38892349 Free PMC article. Review.
Cited by
-
Finetuning Type I Interferon Signaling to Enhance T Cell Immunity in HIV Infection.Viruses. 2025 May 29;17(6):774. doi: 10.3390/v17060774. Viruses. 2025. PMID: 40573365 Free PMC article. Review.
-
Recent Advances of Type I Interferon on the Regulation of Immune Cells and the Treatment of Systemic Lupus Erythematosus.J Inflamm Res. 2025 Mar 30;18:4533-4549. doi: 10.2147/JIR.S516195. eCollection 2025. J Inflamm Res. 2025. PMID: 40182060 Free PMC article. Review.
-
Mitochondrial Regulation of CD8⁺ T Cells: Mechanisms and Therapeutic Modulation.Adv Sci (Weinh). 2025 Aug;12(32):e03095. doi: 10.1002/advs.202503095. Epub 2025 Jun 23. Adv Sci (Weinh). 2025. PMID: 40546111 Free PMC article. Review.
References
-
- Tsokos GC. Systemic lupus erythematosus. N Engl J Med 2011, 365, 2110–21. doi: https://doi.org/10.1056/NEJMra1100359 - DOI - PubMed
-
- Hedrich CM, Smith EMD, Beresford MW.. Juvenile-onset systemic lupus erythematosus (jSLE) – Pathophysiological concepts and treatment options. Best Pract Res Clin Rheumatol 2017, 31, 488–504. doi: https://doi.org/10.1016/j.berh.2018.02.001 - DOI - PubMed
-
- Tucker LB, Uribe AG, Fernández M, Vilá LM, McGwin G, Apte M, et al. Adolescent onset of lupus results in more aggressive disease and worse outcomes: results of a nested matched case-control study within LUMINA, a multiethnic US cohort (LUMINA LVII). Lupus 2008, 17, 314–22. doi: https://doi.org/10.1177/0961203307087875 - DOI - PMC - PubMed
-
- Livingston B, Bonner A, Pope J.. Differences in autoantibody profiles and disease activity and damage scores between childhood- and adult-onset systemic lupus erythematosus: a meta-analysis. Semin Arthritis Rheum 2012, 42, 271–80. doi: https://doi.org/10.1016/j.semarthrit.2012.05.001 - DOI - PubMed
-
- Hersh AO, Trupin L, Yazdany J, Panopalis P, Julian L, Katz P, et al. Childhood-onset disease as a predictor of mortality in an adult cohort of patients with systemic lupus erythematosus. Arthritis Care Res 2010, 62, 1152–9. doi: https://doi.org/10.1002/acr.20179 - DOI - PMC - PubMed
MeSH terms
Substances
Grants and funding
- National Institute for Health and Care Research
- BRC773/III/CC/101350/University College London Hospital
- Centre for Adolescent Rheumatology Versus Arthritis
- University College London
- UCL Hospital and Great Ormond Street Hospital
- University College London Division of Medicine
- 21593/Centre of Excellence grants from Versus Arthritis
- Great Ormond Street Hospital Children's Charity
- Versus Arthritis Studentship
- MRF-057-0001-RG-ROSS-C0797/ECR
- KENN 21 22 09/Kennedy Trust for Rheumatology Research
- Lister Institute for Preventive Medicine
- MR/R013926/1/MRC_/Medical Research Council/United Kingdom
- 22084/VAC_/Versus Arthritis/United Kingdom
- Great Ormond Street Hospital Biomedical Research Centre
LinkOut - more resources
Full Text Sources
Medical
Research Materials

