. 2024 Dec 10:15:1512720.
doi: 10.3389/fneur.2024.1512720. eCollection 2024.

Characteristics of peripheral immune response induced by large-vessel occlusion in patients with acute ischemic stroke

Affiliations

Characteristics of peripheral immune response induced by large-vessel occlusion in patients with acute ischemic stroke

Ling Ma et al. Front Neurol. .

Abstract

Introduction: Despite improvements in the treatment of acute ischemic stroke (AIS), some patients still suffer from functional impairments, indicating the poor understanding of pathophysiologic process of AIS. Inflammation plays an important role in the pathophysiology of AIS. The purpose of the study was to investigate the peripheral inflammation in different subtypes of AIS.

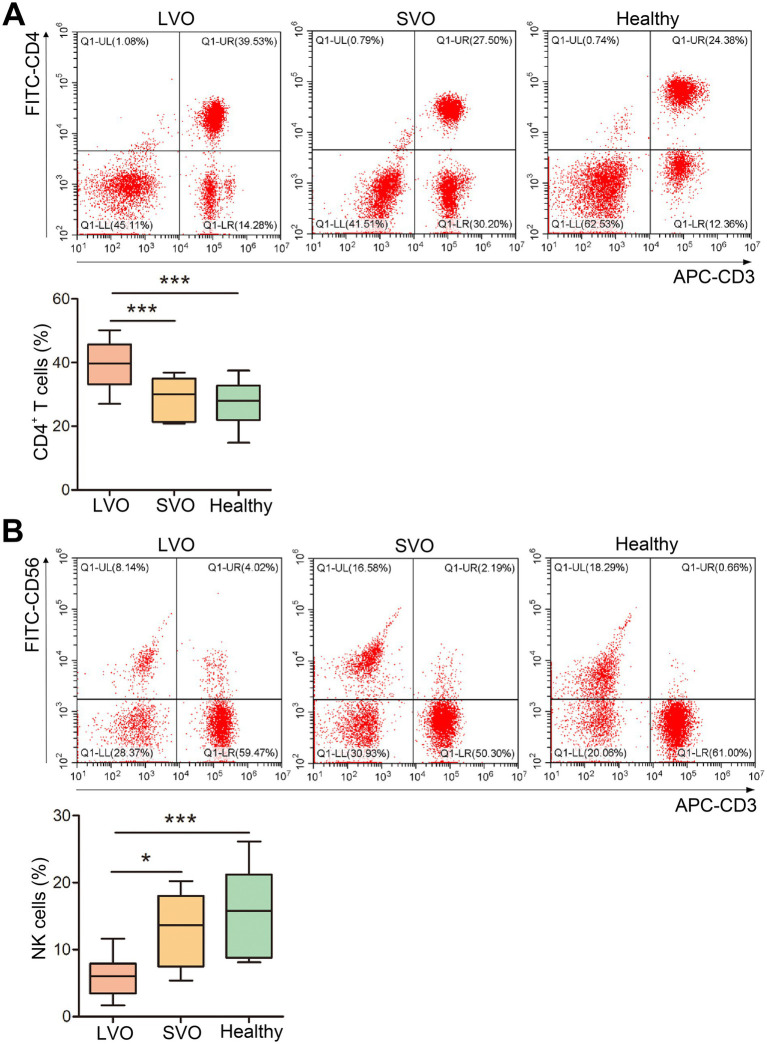
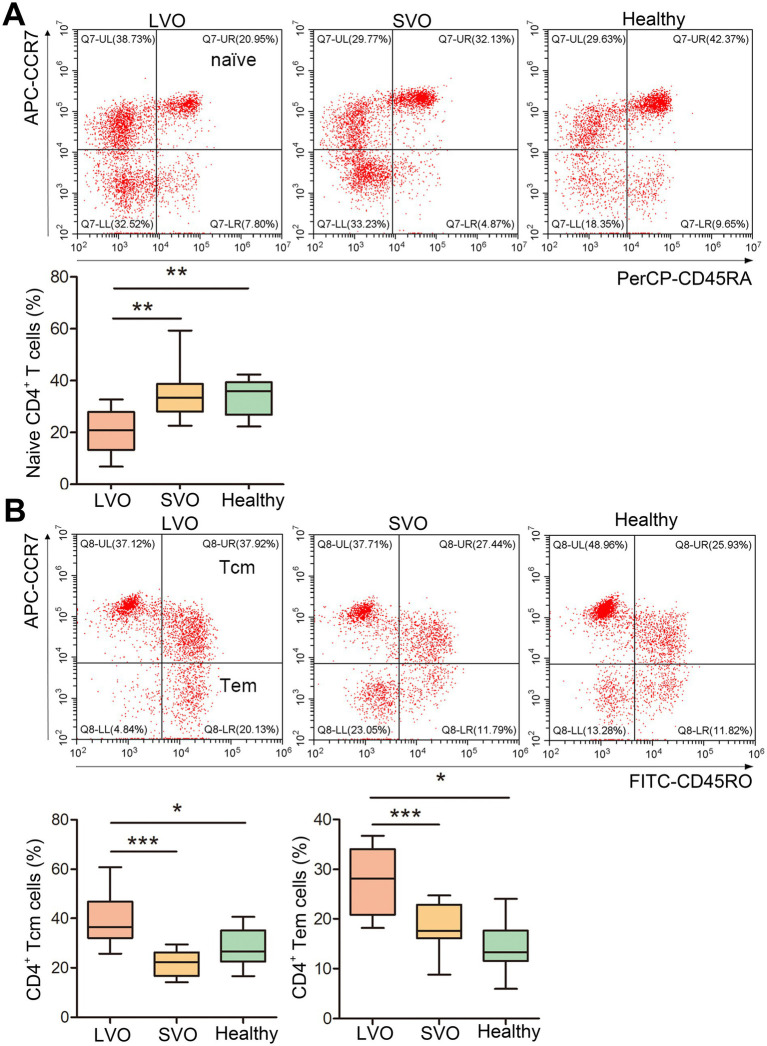
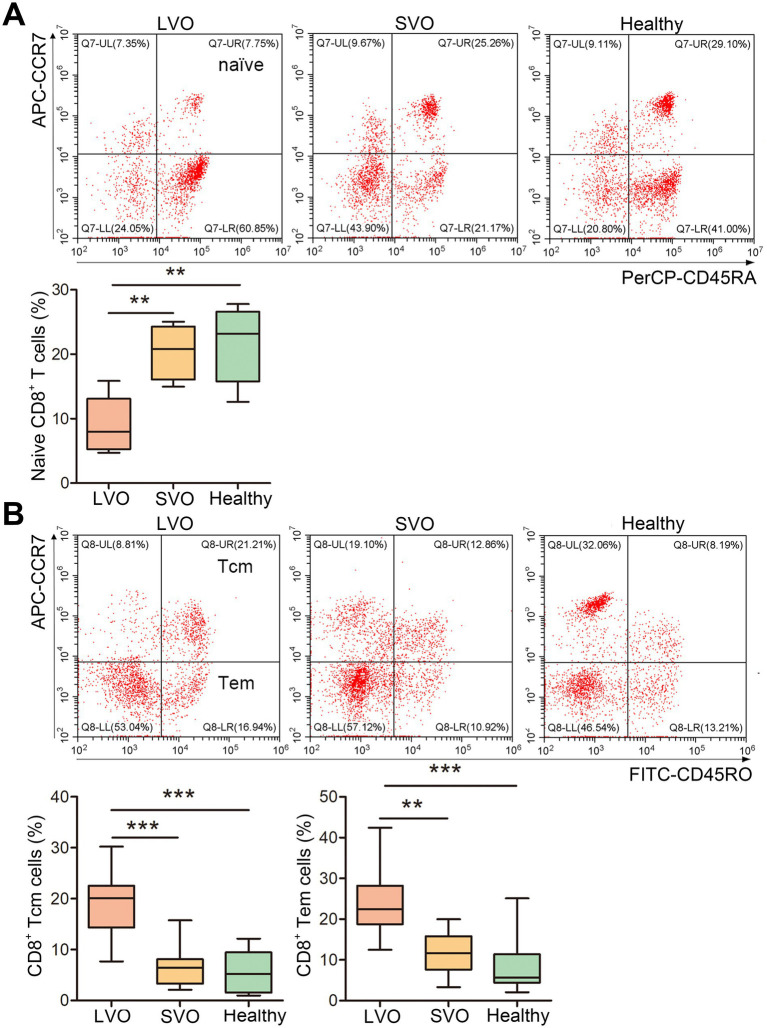
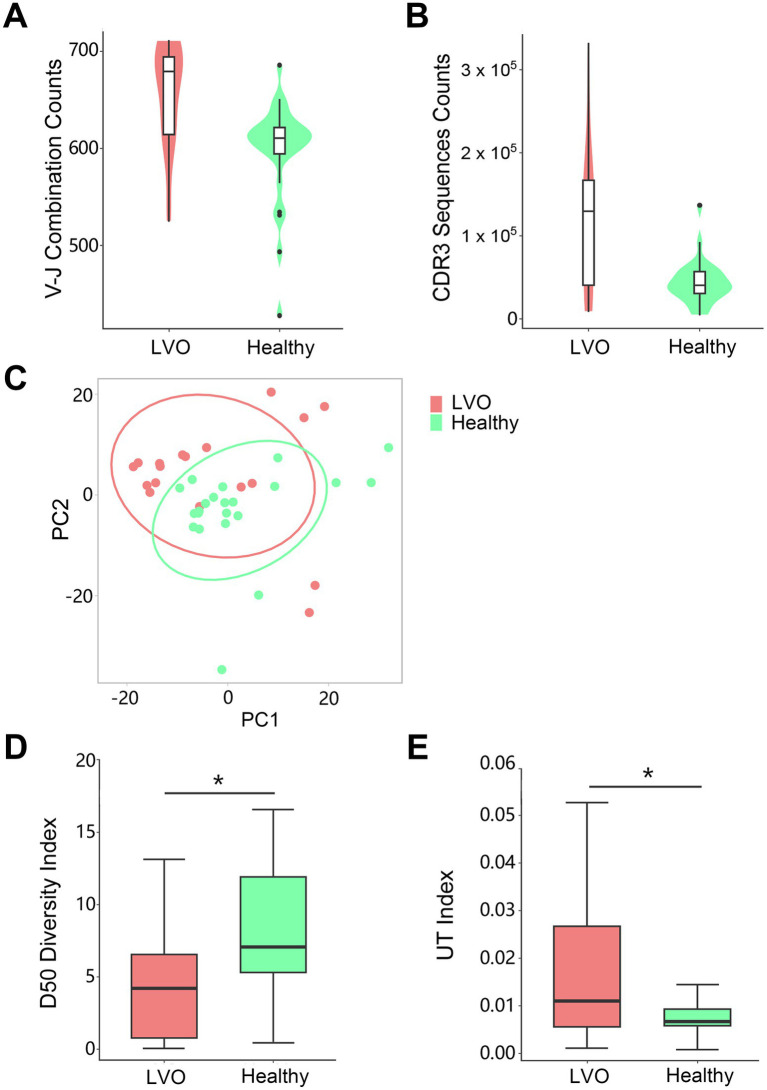
Methods: Here, retrospective data from AIS with large vessel occlusion (LVO) and small vessel occlusion (SVO), and healthy controls, were initially analyzed. Then, flow cytometry was performed to evaluate the levels of peripheral naïve and memory T-cells. Finally, we characterized the T cell receptors (TCR) repertoire using high-throughput sequencing.

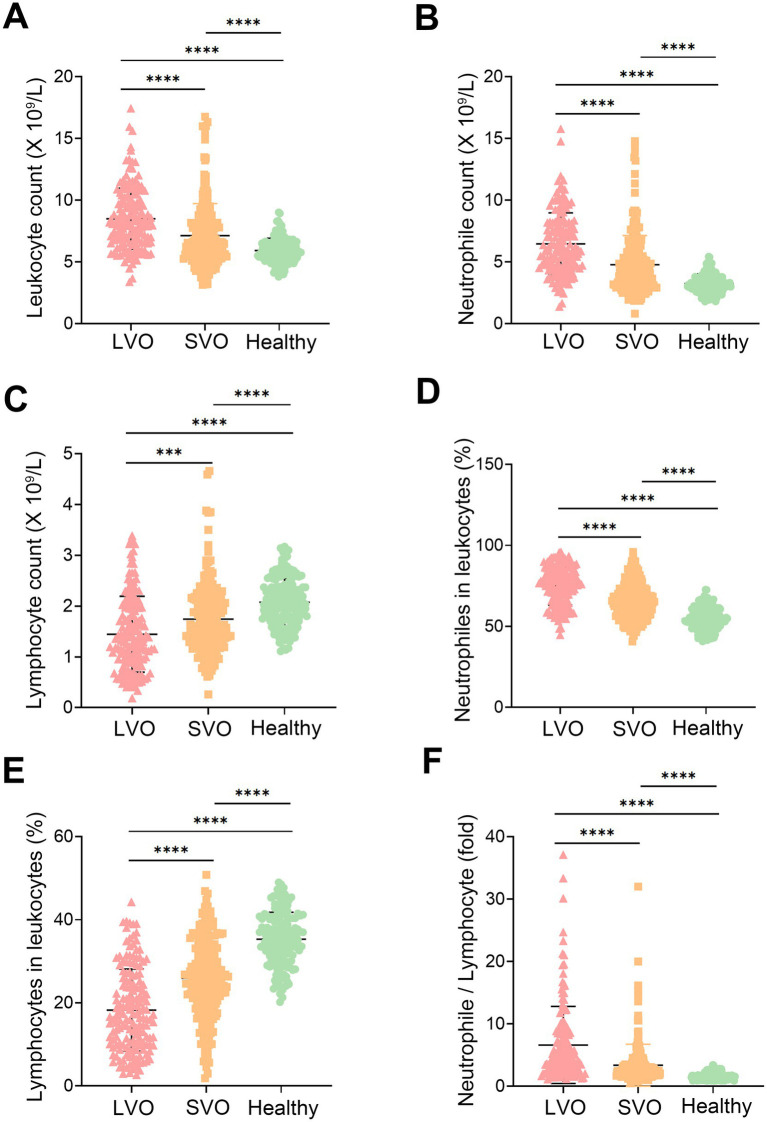
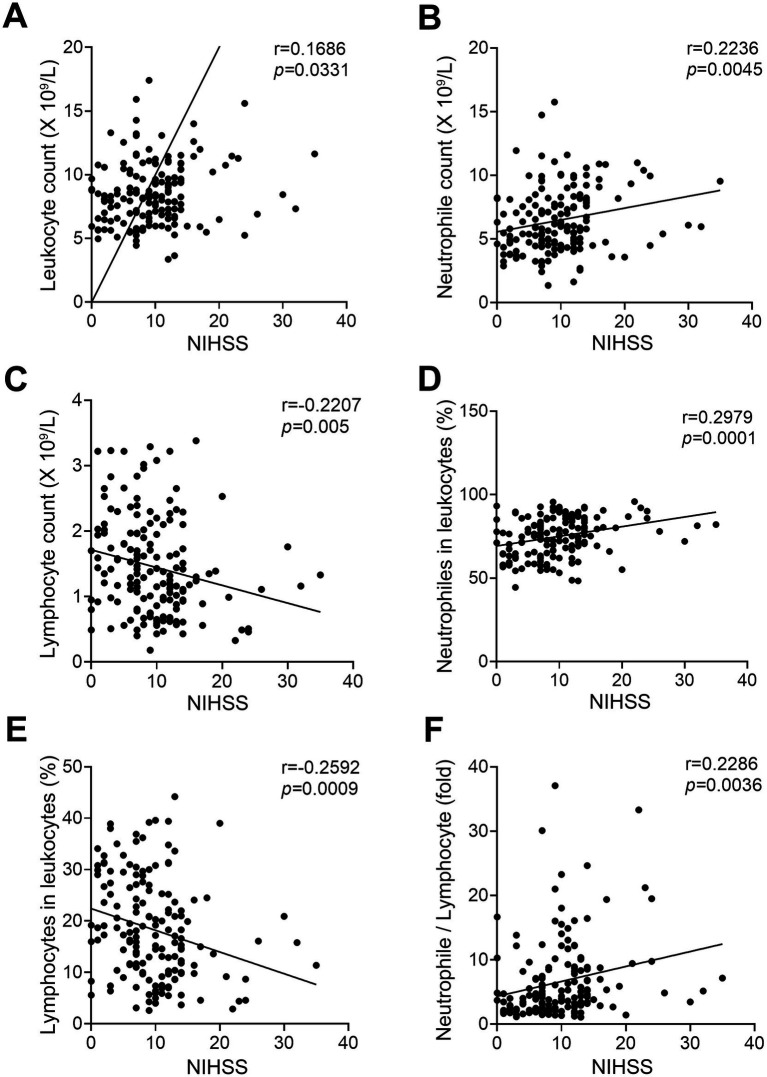
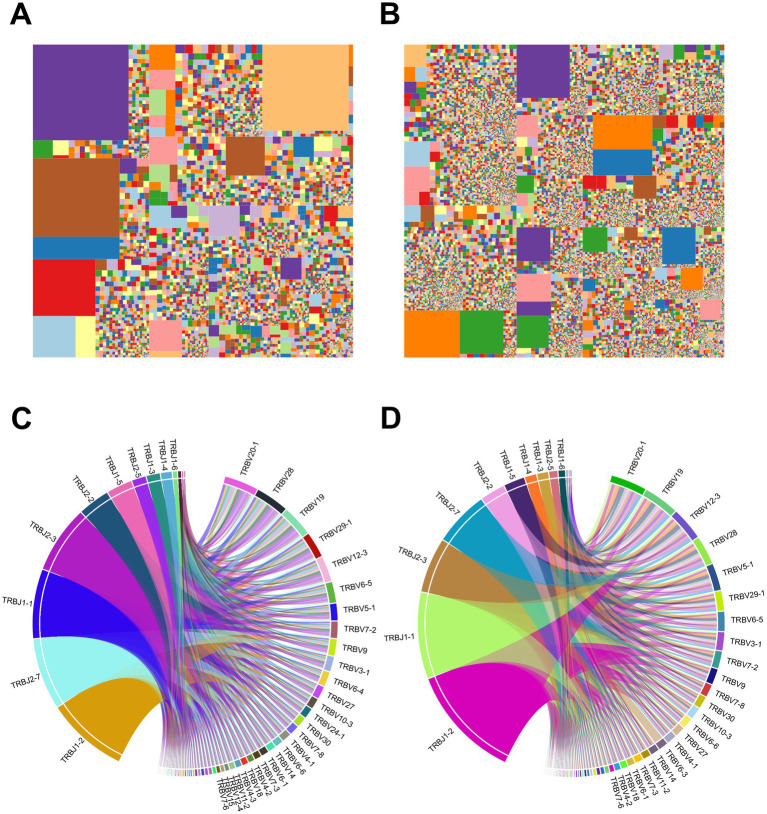
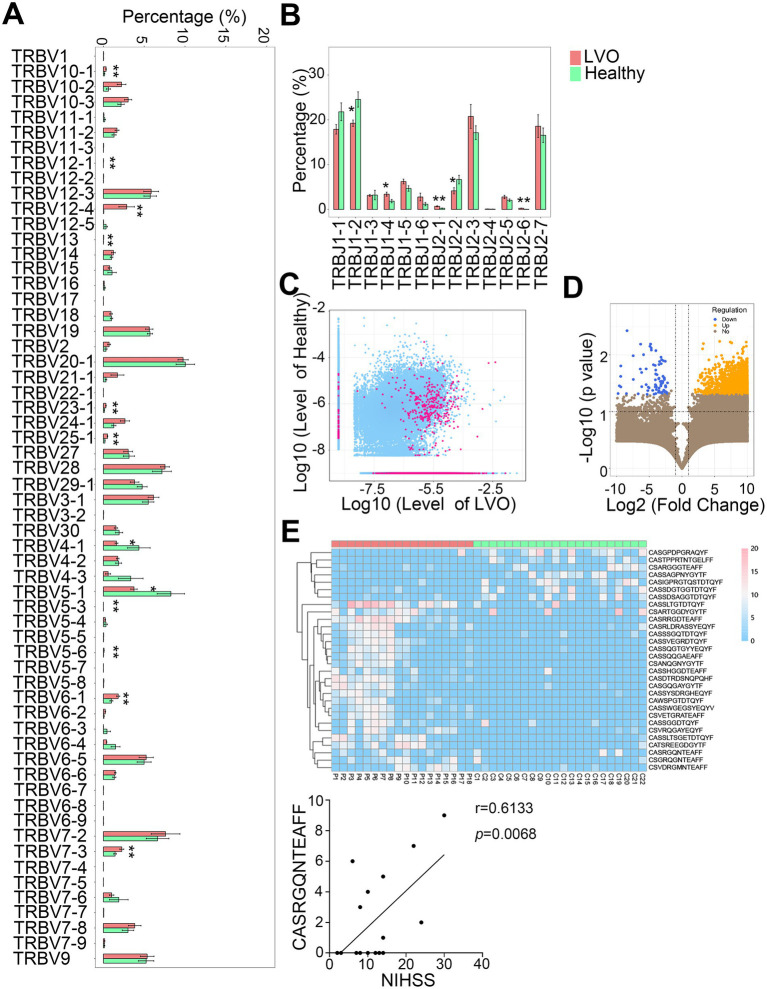
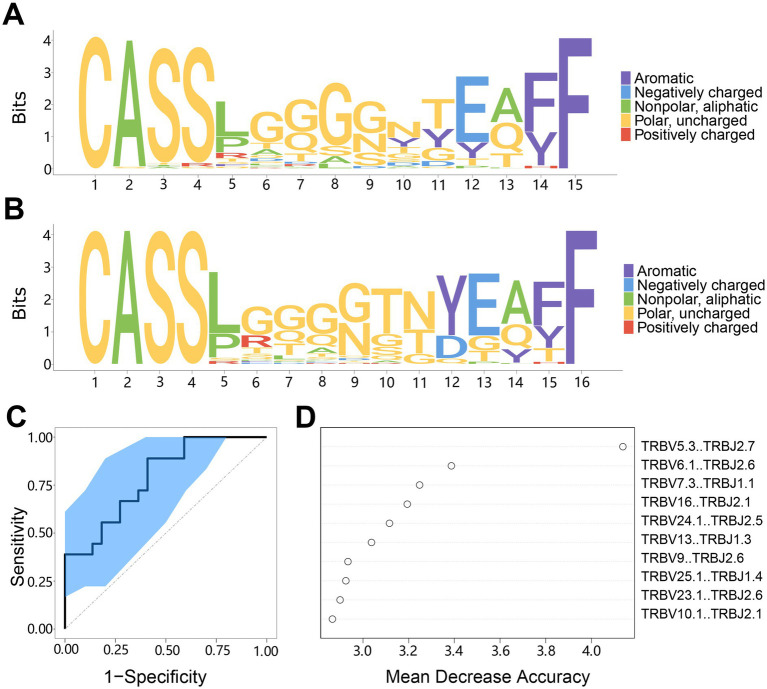
Results: Elevated levels of leukocytes, neutrophils, and neutrophil-to-lymphocyte ratio (NLR), and decreased levels of lymphocytes were found in LVO group than that in SVO group, which were correlated with the severity of LVO. In addition, higher percentages of both effector memory (Tem) and central memory (Tcm) T cells, and lower percentage of naïve T cells in CD4+ and CD8+ T cells, were found in LVO group than that in SVO and healthy groups. Moreover, impaired TCR diversity, and different abundances of V-J gene combinations and amino acid sequences, were found in LVO as compared with healthy group, which would be potential biomarkers for LVO diagnosis.

Discussion: In conclusion, AIS with LVO can rapidly induce peripheral immune response, which provides new insight into the understanding of pathophysiology of AIS.

Keywords: CD45; T cell; T cell receptors repertoire; acute ischemic stroke; large vessel occlusion.


Conflict of interest statement

The authors declare that the research was conducted in the absence of any commercial or financial relationships that could be construed as a potential conflict of interest.

Figures

Figure 1
Figure 1
Participation characteristics. Leukocyte (A), neutrophile (B), and lymphocyte (C) counts in the peripheral blood of AIS with LVO and SVO, and healthy controls. The ratio of neutrophiles (D) and lymphocytes (E) to leukocytes in the peripheral blood of AIS with LVO and SVO, and healthy controls. (F) The ratio of neutrophile to lymphocyte in the peripheral blood of AIS with LVO and SVO, and healthy controls. (***p < 0.001, ****p < 0.0001).
Figure 2
Figure 2
Correlation between NIHSS and circulating blood cells in patients of AIS with LVO. The correlation between NIHSS and leukocyte (A), neutrophile (B), and lymphocyte (C) counts. The correlation between NIHSS and the ratio of neutrophiles (D) and lymphocytes (E) to leukocytes. (F) The correlation between NIHSS and the ratio of neutrophile to lymphocyte.
Figure 3
Figure 3
Changes in T-cell subtypes. (A) The percentage of CD4+ T cells was determined by flow cytometry. (B) The percentage of NK cells was determined using flow cytometry (*p < 0.05, ***p < 0.001).
Figure 4
Figure 4
Changes in naïve, Tcm, and Tem CD4+ T cells. (A) The percentage of naïve CD4+ T cells was determined by detecting CD45RA+CCR7+ cells among the CD4+ T cells. (B) The percentage of Tcm CD4+ T cells was investigated by detecting CD45RO+CCR7+ cells among the CD4+ T cells. The percentage of Tem CD4+ T cells was investigated by detecting CD45RO+CCR7 cells in CD4+ T cells. (*p < 0.05, **p < 0.01, ***p < 0.001).
Figure 5
Figure 5
Changes in naïve, Tcm, and Tem levels in CD8+ T cells. (A) The percentage of naïve CD8+ T cells was investigated by detecting CD45RA+CCR7+ cells among CD8+ T cells. (B) The percentage of Tcm CD8+ T cells was investigated by detecting CD45RO+CCR7+ cells among CD8+ T cells. The percentage of Tem CD8+ T cells was investigated by detecting CD45RO+CCR7 cells in CD8+ T cells. (**p < 0.01, ***p < 0.001).
Figure 6
Figure 6
Quantity and diversity of the TCR repertoire: the number of unique V-J combinations (A) and counts of unique CDR3 sequences (B) were determined. (C) Principal component analysis of the AIS with LVO (red) and healthy groups (green). X-axis and Y-axis represent principal component 1 (PC1) and principal component 2 (PC2), respectively. The D50 Diversity Index (D) and UT Index (E) show the diversity of the TCR repertoire in the AIS with LVO and healthy groups. The violin chart and box plot show the data distribution with the minimum, first quartile, median, third quartile, and maximum (*p < 0.05).
Figure 7
Figure 7
Samples’ immunological characteristics. (A,B) TCR sequence abundance and usage frequency of V-J combinations in patients with LVO. Tree-map of module CDR3 sequence abundance in samples from the AIS with LVO group (A) and healthy group (B). (C,D) Circos plots of the V-J gene combination usage frequency in samples from the AIS with LVO group (C) and healthy group (D). The left half-circle indicates the J gene and the right half-circle indicates the V gene. The length of sectors represents the relative usage frequency of the V genes or the J genes.
Figure 8
Figure 8
Differential abundances of the V and J gene segments and CDR3 sequences between the AIS with LVO and healthy groups. The relative abundance of V gene (A) and J gene (B) in the two groups. (C) Scatter plot showing differential abundance of CDR3 sequences in LVO and healthy groups (red, different CDR3 sequences; blue, CDR3 sequences with no significant difference). The X- and Y-axis represents the log-transformed mean of the relative abundance of the healthy and LVO group, respectively. (D) The volcano map shows the different clones between the LVO and healthy groups (yellow with increased abundance and blue with decreased abundance). The X- and Y-axes represent the log transformed p-value and fold changes, respectively. (E) Thirty differentially expressed amino acid clonotypes are shown as a heatmap. The X- and Y-axis represent samples and expression levels of CDR3 sequences, respectively. (F) The correlation between NIHSS and the unique amino acid clonotype (*p < 0.05, **p < 0.01).
Figure 9
Figure 9
The motif specificity of TCR repertoires and prediction model system for AIS with LVO. (A) Motif diagram of the CDR3 sequences in AIS with LVO group. (B) Motif diagram of the CDR3 sequences in the healthy group. (C) ROC curve showing the classification effect of the LVO prediction model. The ordinate is the true-positive rate (sensitivity), and the abscissa is the false-positive rate (1-specificity). (D) The top 10 segments of V-J combinations that influenced the model effect. The mean decrease in accuracy is a rating index, and its value positively correlates with the effect on the model.

Similar articles

References

    1. Katan M, Luft A. Global burden of stroke. Semin Neurol. (2018) 38:208–11. doi: 10.1055/s-0038-1649503 - DOI - PubMed
    1. Phipps MS, Cronin CA. Management of acute ischemic stroke. BMJ. (2020) 368:l6983. doi: 10.1136/bmj.l6983 - DOI - PubMed
    1. Adams HP, Jr, Bendixen BH, Kappelle LJ, Biller J, Love BB, Gordon DL, et al. . Classification of subtype of acute ischemic stroke. Definitions for use in a multicenter clinical trial. TOAST. Trial of org 10172 in acute stroke treatment. Stroke. (1993) 24:35–41. doi: 10.1161/01.STR.24.1.35, PMID: - DOI - PubMed
    1. Yeo LL, Paliwal P, Teoh HL, Seet RC, Chan BP, Liang S, et al. . Timing of recanalization after intravenous thrombolysis and functional outcomes after acute ischemic stroke. JAMA Neurol. (2013) 70:353–8. doi: 10.1001/2013.jamaneurol.547, PMID: - DOI - PubMed
    1. Gao Y, Chen T, Lei X, Li Y, Dai X, Cao Y, et al. . Neuroprotective effects of polydatin against mitochondrial-dependent apoptosis in the rat cerebral cortex following ischemia/reperfusion injury. Mol Med Rep. (2016) 14:5481–8. doi: 10.3892/mmr.2016.5936, PMID: - DOI - PMC - PubMed

LinkOut - more resources