. 2024 Dec 3;10(23):e40826.
doi: 10.1016/j.heliyon.2024.e40826. eCollection 2024 Dec 15.

Menaquinone-7 and its therapeutic potential in type 2 diabetes mellitus based on a Zucker diabetic fatty rat model

Affiliations

Menaquinone-7 and its therapeutic potential in type 2 diabetes mellitus based on a Zucker diabetic fatty rat model

Ingo Mrosewski et al. Heliyon. .

Abstract

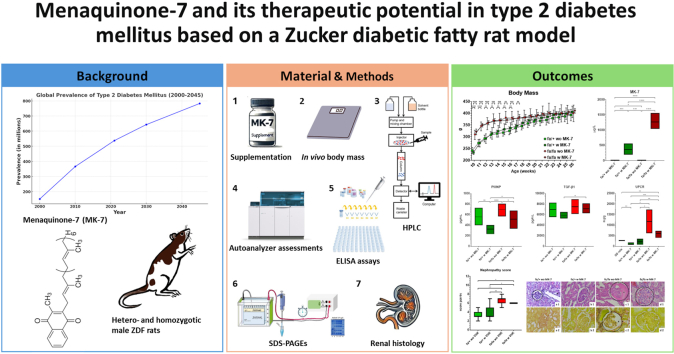
Background: Type 2 diabetes mellitus (T2DM) is marked by insulin resistance, low grade chronic inflammation, and endothelial dysfunction. Vitamin K2, especially menaquinone-7 (MK-7), might delay T2DM progression and alleviate its consequences. Hence, this study evaluated the effects of MK-7 on serum and urine markers of diabetes in an animal model of T2DM.

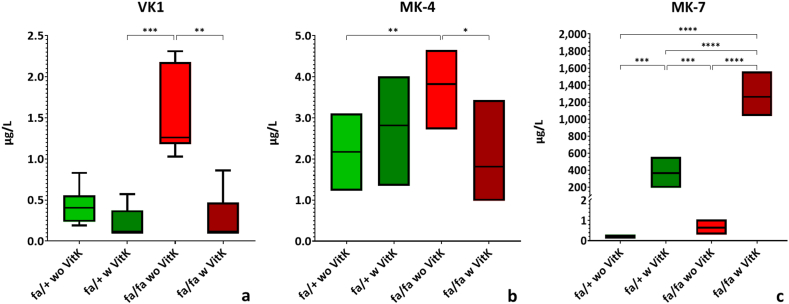
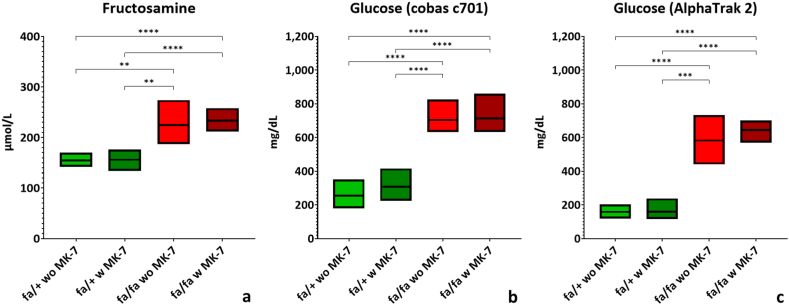
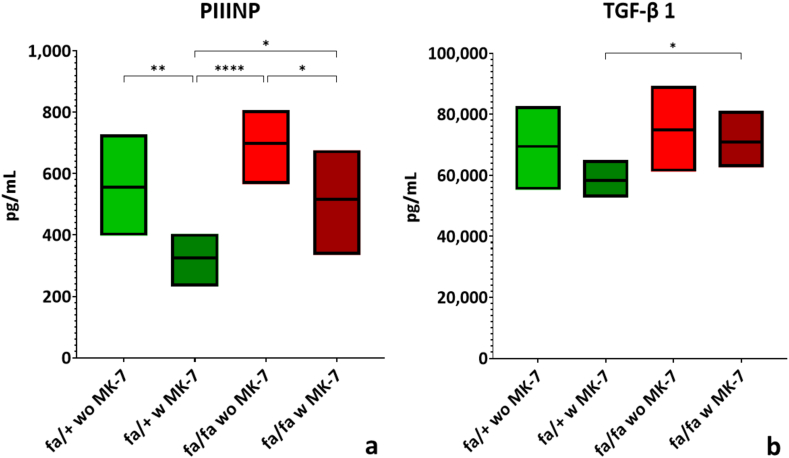
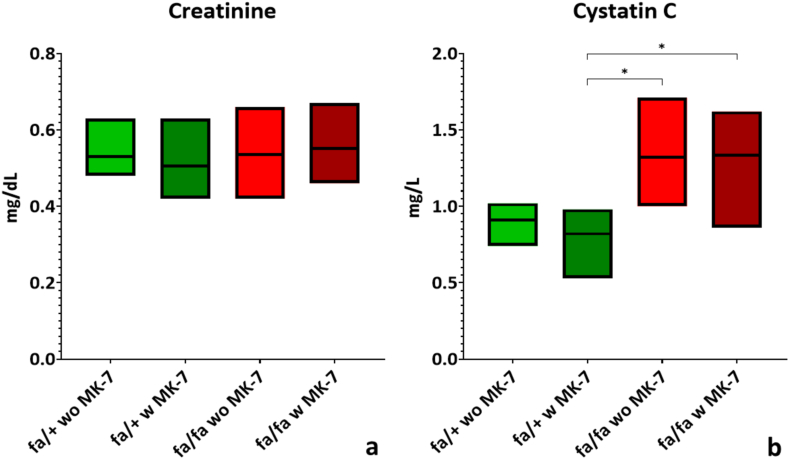
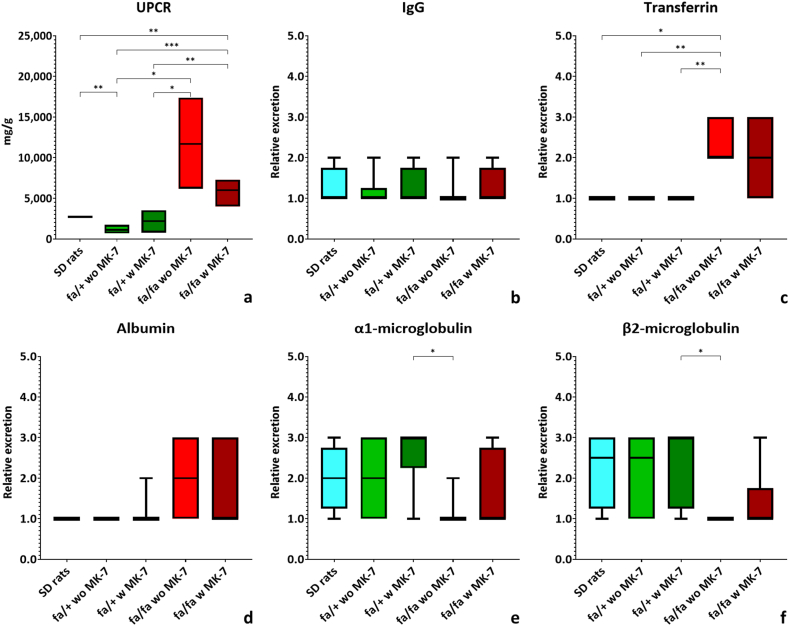
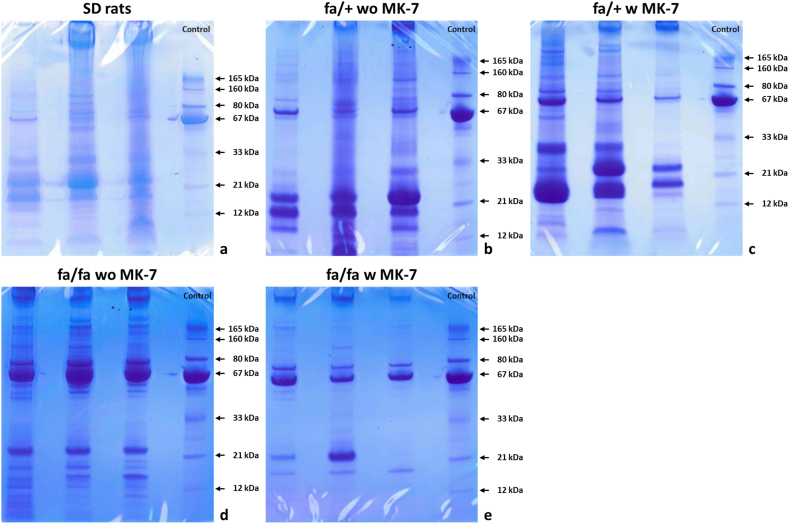
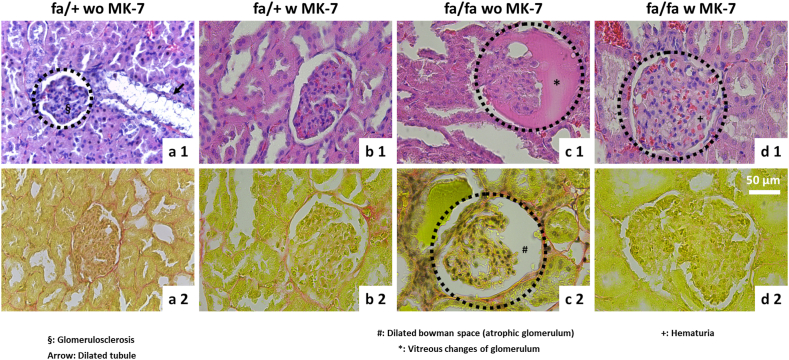
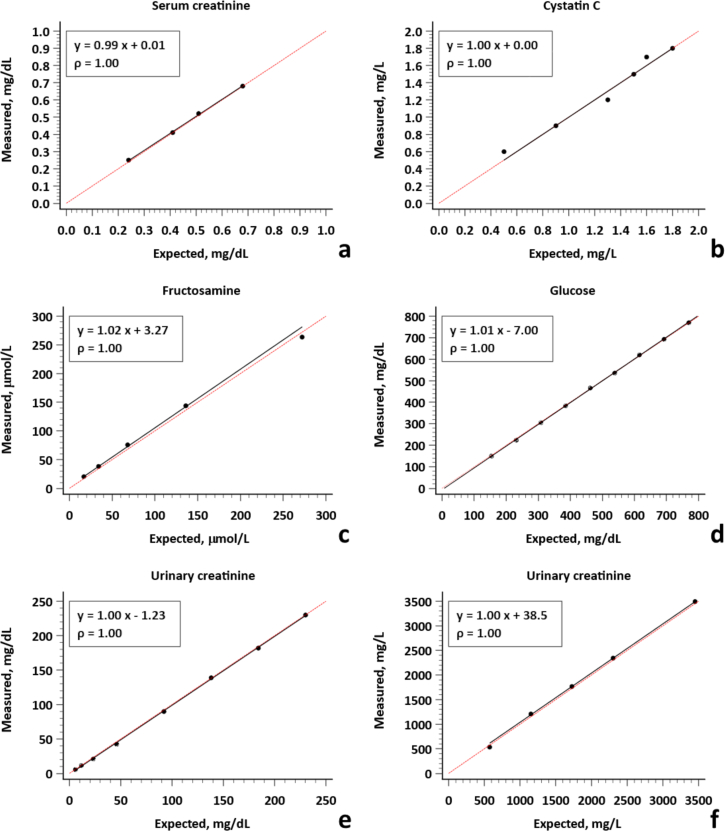
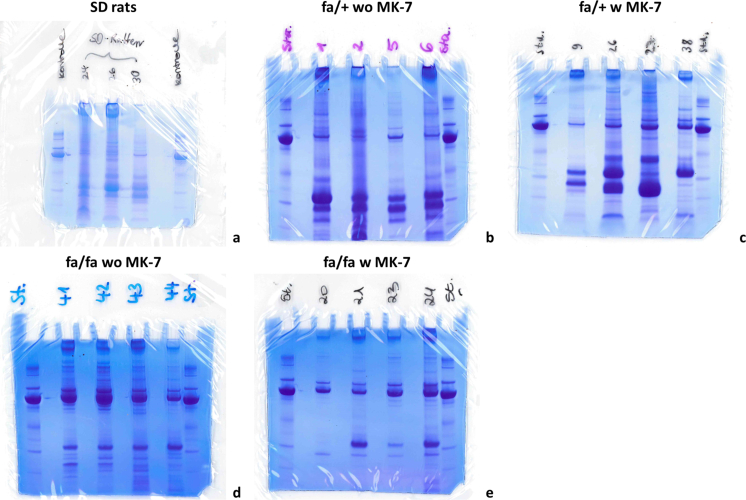
Methods: Hetero- (fa/+, control) and homozygous (fa/fa, diabetic) male Zucker diabetic fatty (ZDF) rats were supplemented or not with MK-7 for 12 weeks. After euthanasia, vitamin K1, menaquinone-4 and MK-7 serum concentrations were analyzed via reversed phase high pressure liquid chromatography. Glucose (serum), fructosamine (serum) and creatinine (serum and urine) levels were assessed photometrically, serum cystatin C and urinary total protein were turbidimetrically determined. Serum transforming growth factor beta 1 (TGF-β1) and procollagen type III N-terminal peptide (PIIINP) were quantified with enzyme-linked immunosorbent assay. Urinary marker proteins were analyzed via sodium dodecyl sulfate-polyacrylamide gel electrophoresis. Nephropathy was assessed histologically.

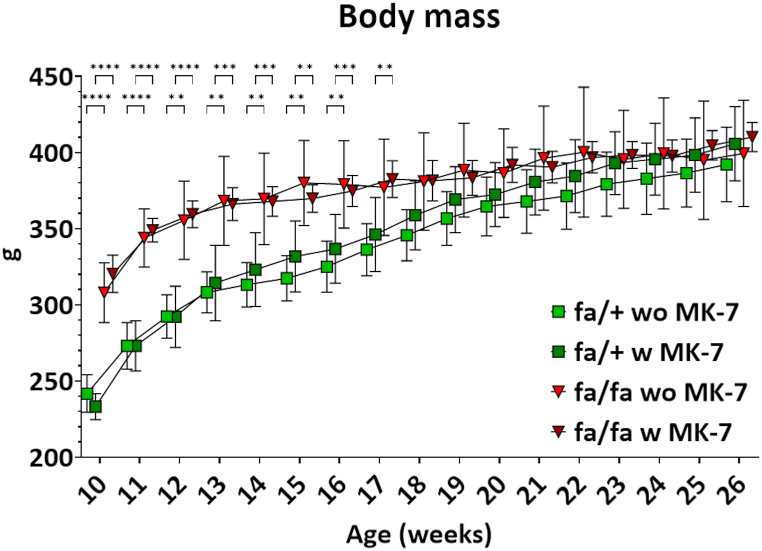
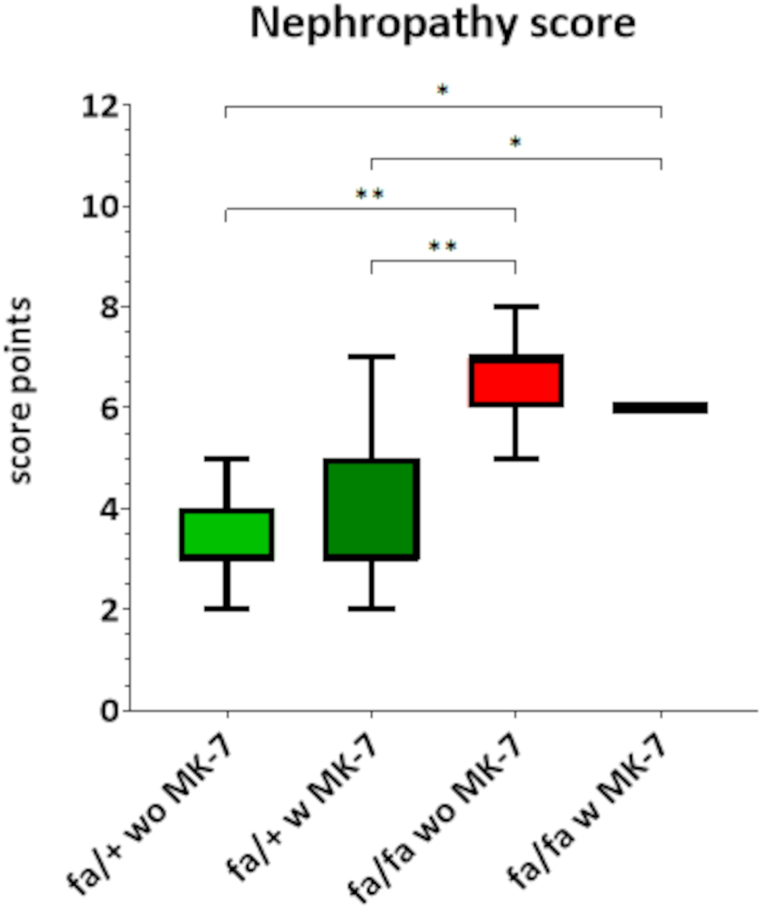
Results: Supplementation led to significantly elevated MK-7 serum levels and a significant reduction of PIIINP serum levels in both hetero- and homozygous ZDF rats. Additionally, not statistically significant reductions of TGF-β1 serum levels, proteinuria as well as the nephropathy score were observed. In vivo body mass, serum fructosamine, glucose, cystatin C and creatinine levels were unaffected.

Conclusion: MK-7 reduced serum markers of fibrosis, histological features of nephropathy and urinary protein excretion, but failed to affect serum markers of T2DM. The therapeutic potential of MK-7 in T2DM and its mode of action should be further investigated in more detail.

Keywords: Menaquinone-7; Nephropathy; Procollagen type III N-Terminal peptide (PIIINP); Transforming growth factor beta 1 (TGF-β1); Type 2 diabetes mellitus; Zucker diabetic fatty (ZDF) rats.


Conflict of interest statement

The authors declare that they have no known competing financial interests or personal relationships that could have appeared to influence the work reported in this paper.

Figures

Image 1
Graphical abstract
Fig. 1
Fig. 1
Weekly body mass of hetero- and homozygous male ZDF rats without or with MK-7 supplementation depicted as means with standard deviations. Please note that the origins of x- and y-axes are not zero. P-values: ∗∗ <0.01, ∗∗∗ <0.001, ∗∗∗∗ <0.0001. fa/+: heterozygous ZDF rats; fa/fa: homozygous ZDF rats, w: with, wo: without. n = 5–11.
Fig. 2
Fig. 2
Quantification of vitamin K1 (VK1) [a], menaquinone-4 (MK-4) [b] and menaquinone-7 (MK-7) [c] in serum of hetero- and homozygous ZDF rats without or with MK-7 supplementation depicted as median, 25th/75th percentile, minimum, and maximum (VK1) or means, minimum and maximum values (MK-4, MK-7). P-values: ∗ <0.05, ∗∗ <0.01, ∗∗∗ <0.001, ∗∗∗∗ <0.0001. fa/+: heterozygous ZDF rats; fa/fa: homozygous ZDF rats, w: with, wo: without. n = 7–8.
Fig. 3
Fig. 3
Quantification of serum fructosamine [a] and non-fasting glucose [b, c] in hetero- and homozygous ZDF rats without or with MK-7 supplementation depicted as means, minimum, and maximum values. P-values: ∗∗ <0.01, ∗∗∗ <0.001, ∗∗∗∗ <0.0001. fa/+: heterozygous ZDF rats; fa/fa: homozygous ZDF rats, w: with, wo: without. n = 7–8.
Fig. 4
Fig. 4
Quantification of serum procollagen type III N-terminal peptide (PIIINP) [a] and transforming growth factor beta1 (TGF-β1) [b] in hetero- and homozygous ZDF rats without or with MK-7 supplementation depicted as means, minimum, and maximum values. P-values: ∗ <0.05, ∗∗ <0.01, ∗∗∗∗ <0.0001. fa/+: heterozygous ZDF rats; fa/fa: homozygous ZDF rats, w: with, wo: without. n = 7–8.
Fig. 5
Fig. 5
Quantification of serum creatinine [a] and cystatin C [b] in hetero- and homozygous ZDF rats without or with MK-7 supplementation depicted as means, minimum, and maximum values. P-values: ∗ <0.05. fa/+: heterozygous ZDF rats; fa/fa: homozygous ZDF rats, w: with, wo: without. n = 7–8.
Fig. 6
Fig. 6
Quantification of urinary protein excretion as urine protein/creatinine ratio (UPCR) [a] and semiquantitative urinary excretion of immunoglobulin G (IgG) [b], transferrin [c], albumin [d], α1-microglobulin [e] and β2-microglobulin [f] of hetero- and homozygous ZDF rats without or with MK-7 supplementation depicted as means, minimum and maximum values (UPCR) or medians, 25th/75th percentile, minimum and maximum values (all others). P-values: ∗ <0.05, ∗∗ <0.01, ∗∗∗ <0.001. fa/+: heterozygous ZDF rats; fa/fa: homozygous ZDF rats, SD: Sprague Dawley, w: with, wo: without. 7a: n = 4 for SD rats, n = 5–6 for ZDF rats, 7b–f: n = 4 for SD rats, n = 6–8 for ZDF rats.
Fig. 7
Fig. 7
Exemplary urine sodium dodecyl sulfate-polyacrylamide gel electrophoreses (SDS-PAGE) of SD rats [a], heterozygous ZDF rats without menaquinone-7 (MK-7) supplementation [b], heterozygous ZDF rats with MK-7 supplementation [c], homozygous ZDF rats without MK-7 supplementation [d] and homozygous ZDF rats with MK-7 supplementation [e]. In each example, urine of 3 different rats of the respective group as well as a standard lane (far right) are visible. The marker standard bands correspond to proteins as following: 165 kDa = IgA, 160 kDa = IgG, 80 kDa = transferrin, 67 kDa = albumin, 33 kDa = α1-microglobulin, 21 kDa = retinol-binding protein, 12 kDa = β2-microglobulin. fa/+: heterozygous ZDF rats; fa/fa: homozygous ZDF rats, SD: Sprague Dawley, w: with, wo: without. Full, non-cropped and unedited images of the SDS-PAGEs can be found in Supplementary Fig. 2.
Fig. 8
Fig. 8
Histopathological nephropathy scores of hetero- and homozygous ZDF rats without or with MK-7 supplementation depicted as medians, 25th/75th percentile, minimum and maximum values. P-values: ∗ <0.05, ∗∗ <0.01. fa/+: heterozygous ZDF rats; fa/fa: homozygous ZDF rats, w: with, wo: without. n = 7–11.
Fig. 9
Fig. 9
Representative histological staining of renal cortex of heterozygous ZDF rats without menaquinone-7 (MK-7) supplementation [a], heterozygous ZDF rats with MK-7 supplementation [b], homozygous ZDF rats without MK-7 supplementation [c] and homozygous ZDF rats with MK-7 supplementation [d]. The sections were stained with Hematoxylin-eosin stain (a1d1) to acquire information on the overall histological structure or Picrosirius red stain (a2d2) for collagen structure depiction visualized with light microscopy. Scale bar: 50 μm. Arrow: dilated tubule, ∗: vitreous changes of glomerulus, #: dilated Bowman's capsule (atrophic glomerulus), +: glomerulus with hematuria, $ glomerulosclerosis. fa/+: heterozygous ZDF rats; fa/fa: homozygous ZDF rats, w: with, wo: without.
figs1
figs1
Supp. Fig. 1: Linearity assessments of serum creatinine [a], cystatin C [b], fructosamine [c], glucose [d], urinary creatinine [e] and urinary total protein [f] using pooled samples of hetero- and homozygous ZDF rats. Dashed diagonals (red) represent the lines of identity. Spearman rank correlation coefficients (ρ) and linear equations are provided in the upper left corner of each graph.
figs2
figs2
Supp. Fig. 2: Full, non-cropped and unedited images of exemplary urine sodium dodecyl sulfate-polyacrylamide gel electrophoreses (SDS-PAGE) of SD rats [a], heterozygous ZDF rats without menaquinone-7 (MK-7) supplementation [b], heterozygous ZDF rats with MK-7 supplementation [c], homozygous ZDF rats without MK-7 supplementation [d] and homozygous ZDF rats with MK-7 supplementation [e].

Similar articles

Cited by

References

    1. Pang Y.L., Hu J.W., Liu G.L., et al. Comparative medical characteristics of ZDF-T2DM rats during the course of development to late stage disease. Animal Model Exp Med. 2018;1(3):203–211. doi: 10.1002/ame2.12030. - DOI - PMC - PubMed
    1. Pandey S., Dvorakova M.C. Future perspective of diabetic animal models. Endocr., Metab. Immune Disord.: Drug Targets. 2019;20(1):25–38. doi: 10.2174/1871530319666190626143832. - DOI - PMC - PubMed
    1. Rahimi Sakak F., Moslehi N., Niroomand M., et al. Glycemic control improvement in individuals with type 2 diabetes with vitamin K2 supplementation: a randomized controlled trial. Eur. J. Nutr. 2021;60(5):2495–2506. doi: 10.1007/s00394-020-02419-6. - DOI - PubMed
    1. International Diabetes Federation . Diabetes Atlas. tenth ed. 2021. https://diabetesatlas.org/atlas/tenth-edition/ Available from:
    1. Ogurtsova K., da Rocha Fernandes J.D., Huang Y., et al. IDF Diabetes Atlas: global estimates for the prevalence of diabetes for 2015 and 2040. Diabetes Res. Clin. Pract. 2017;128:40–50. doi: 10.1016/j.diabres.2017.03.024. - DOI - PubMed

LinkOut - more resources