. 2024 Nov 29;10(24):e40772.
doi: 10.1016/j.heliyon.2024.e40772. eCollection 2024 Dec 30.

Proteomics and machine learning: Leveraging domain knowledge for feature selection in a skeletal muscle tissue meta-analysis

Affiliations

Proteomics and machine learning: Leveraging domain knowledge for feature selection in a skeletal muscle tissue meta-analysis

Alireza Shahin-Shamsabadi et al. Heliyon. .

Abstract

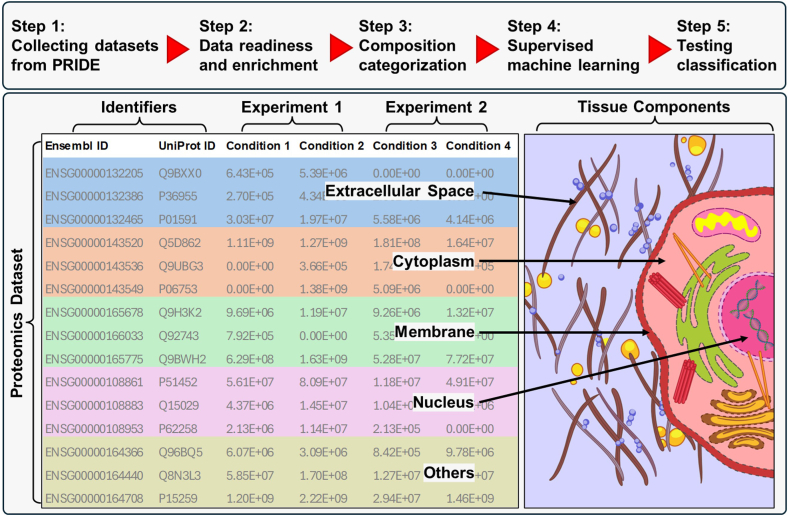
Omics techniques, such as proteomics, contain crucial data for understanding biological processes, but they remain underutilized due to their high dimensionality. Typically, proteomics research focuses narrowly on using a limited number of datasets, hindering cross-study comparisons, a problem that can potentially be addressed by machine learning. Despite this potential, machine learning has seen limited adoption in the field of proteomics. Here, skeletal muscle proteomics datasets from five separate studies were combined. These studies included conditions such as in vitro models (both 2D and 3D), in vivo skeletal muscle tissue, and adjacent tissues such as tendons. The collected data was preprocessed using MaxQuant, and then enriched using a Python script fetching structural and compositional details from UniProt and Ensembl databases. This was used to handle high-dimensional and sparsely labeled dataset by breaking it down into five smaller categories using cellular composition information and then training a Random Forest model for each category separately. Using biological context for interpreting the data resulted in improved model performance and made tailored analysis possible by reducing the dimensionality and increasing signal-to-noise ratio as well as only preserving biologically relevant features in each category. This integration of domain knowledge into data analysis and model training facilitated the discovery of new patterns while ensuring the retention of critical details, often overlooked when blind feature selection methods are used to exclude proteins with minimal expressions or variances. This approach was shown to be suitable for performing diverse analyses on individual as well as combined datasets within a broader biological context, ultimately leading to the identification of biologically relevant patterns. Besides from generating new biological insights, this approach can be used to perform tasks such as biomarker discovery, cluster analysis, classification, and anomaly detection more accurately, but incorporation of more datasets is needed to further expand the computational capabilities of such models in clinical settings.

Keywords: Domain knowledge; Feature selection; Machine learning; Proteomics; Skeletal muscle tissue.


Conflict of interest statement

The authors declare no conflict of interest. All expenses are covered by the authors’ institution, Evolved.Bio.

Figures

Image 1
Graphical abstract
Schematic 1
Schematic 1
Current study's workflow for proteomics dataset enrichment and categorization using cellular composition information instead of feature selection for supervised machine learning.
Fig. 1
Fig. 1
Visualization of dimensionality reduction and cluster formation across distinct categories within the proteomics dataset via a) PCA and b) LDA graphs. Consistently, conditions with more similar biological properties were clustered closer in most categories when analyzed using PCA and LDA. However, the distinctions between conditions became more emphasized when individual categories based on cellular composition were subjected to LDA transformations, and to some degree in PCA.
Fig. 2
Fig. 2
Distribution of protein importance scores across different conditions, illustrating the variability and relative significance of individual proteins in defining each condition, in each cellular composition category. Box plots showed the spread and variability of importance scores for all proteins within each condition, highlighting the diverse proteomic profiles that characterize each condition.
Fig. 3
Fig. 3
Visualization of distribution of protein expression intensity values in combined dataset and individual categories. The visualization scope is narrowed for the violin plots for clarity, and the deviation lines are abbreviated, underscoring the violin's core shape. The unique contours of the violins clearly highlight disparities between conditions within a category and draw contrasts for identical conditions across diverse categories. These plots illustrated distribution of expression values of proteins using the standardized values.
Fig. 4
Fig. 4
Volcano plots juxtaposing individual categories against the aggregate of all other ones. Each visualization contrasts the mean protein expression value of a given category against the aggregated mean of all other categories for respective conditions. Such representations explains distinctions between conditions within varied categories. Notably, the disparities between slow and fast fibers in both young and elderly individuals became more pronounced in their Extracellular Space and Nucleus categories. Conversely, in other categories, these differences become narrower, with these four conditions appearing nearly indistinguishable. Each point in the volcano plot represents the outcome of a separate comparison.
Fig. 5
Fig. 5
Correlation network analysis for different conditions in the combined dataset as well as individual categories. In each network graph, conditions are represented as nodes and their significant interrelations, determined by a threshold of 0.6, are visualized as edges connecting the nodes. Compared to other types of analyses performed in this study, this analysis showed greater sensitivity to cross-experiment variations. Some clusters consisted of conditions from the same experiments rather than clustering conditions with more pronounced physiological or anatomical similarities.
Fig. 6
Fig. 6
Heatmap representations of the confusion matrices for Random Forest Classifier machine learning models trained on a) the entire dataset, and feature selected versions of dataset through b) RandomForest, c) PCA, and d) LDA methods. Even with a notably reduced protein numbers using different feature selection methods, there was no marked enhancement in the model's predictive abilities for different conditions. The optimal hyperparameters identified in both scenarios included: max_depth: None, min_samples_leaf: 1, min_samples_split: 2, and n_estimators: 100.
Fig. 7
Fig. 7
Confusion matrices for the Random Forest Classifier models tailored for each cellular composition category. For all categories, excluding the Nucleus, the optimal hyperparameters were: max_depth: None, min_samples_leaf: 1, min_samples_split: 2, and n_estimators: 50. For the Nucleus category, the best hyperparameters identified were: max_depth: None, min_samples_leaf: 1, min_samples_split: 2, and n_estimators: 200. Dashed lines show models' struggles with classifying different muscle fiber types.
Fig. 8
Fig. 8
Correlation analysis heatmaps for protein expressions across combined dataset and individual categories. Each heatmap is color-coded to visually denote the degree of linear correlation between protein expressions, with correlation coefficients ranging from −1 (indicative of a perfect inverse correlation) to 1 (indicative of a perfect positive correlation). The analysis showed overall similarities and differences in protein expression patterns among different conditions. The correlation matrices underscored the challenges faced by the classifier model in accurately categorizing conditions with pronounced similarities, aiding the interpretation of classification results.

Similar articles

References

    1. Peng J., Gygi S.P. Proteomics: the move to mixtures. J. Mass Spectrom. 2001;36(10):1083–1091. - PubMed
    1. Yates J.R. 3rd, the revolution and evolution of shotgun proteomics for large-scale proteome analysis. J. Am. Chem. Soc. 2013;135(5):1629–1640. - PMC - PubMed
    1. Martens L., et al. PRIDE: the proteomics identifications database. Proteomics. 2005;5(13):3537–3545. - PubMed
    1. Perez-Riverol Y., et al. The PRIDE database resources in 2022: a hub for mass spectrometry-based proteomics evidences. Nucleic Acids Res. 2022;50(D1):D543–d552. - PMC - PubMed
    1. Vaudel M., et al. Exploring the potential of public proteomics data. Proteomics. 2016;16(2):214–225. - PMC - PubMed

LinkOut - more resources