. 2024 Dec 6;10(24):e41006.
doi: 10.1016/j.heliyon.2024.e41006. eCollection 2024 Dec 30.

Chromatin accessibility reveals potential prognostic value of the peak set associated with smoking history in patients with lung adenocarcinoma

Affiliations

Chromatin accessibility reveals potential prognostic value of the peak set associated with smoking history in patients with lung adenocarcinoma

Han Liang et al. Heliyon. .

Abstract

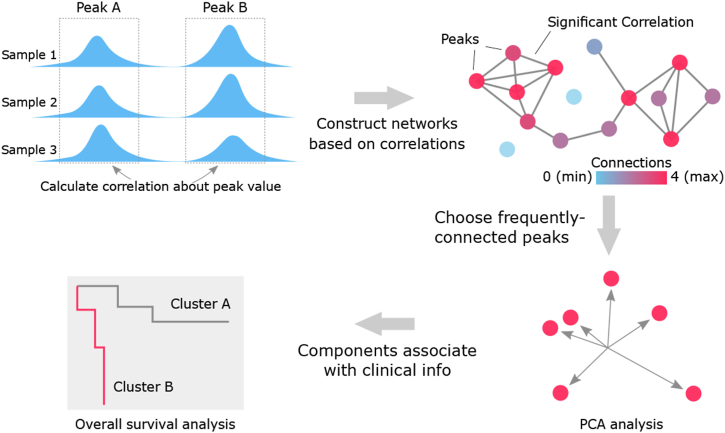
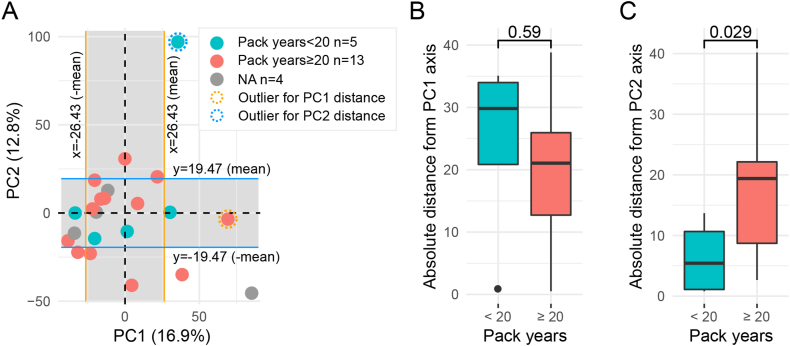
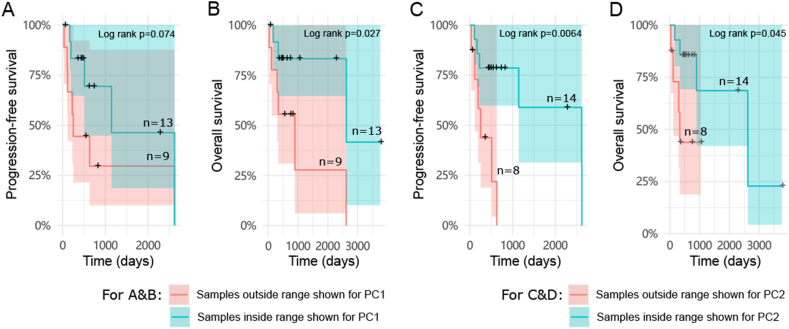
Considerable differences in molecular characteristics have been defined between non-smoker and smokers in patients with lung adenocarcinoma (LUAD), yet studies on open chromatin patterns associated with LUAD progression caused by smoking are still lacking. Here, we constructed a novel network based on correlations between each ATAC-seq peak from TCGA data using our previously developed algorithm. Subsequently, principal component analysis was performed on LUAD samples with retained peaks filtered by the correlation network, and pathway analysis was conducted to identify potential pathways involved. We identified a set of peaks that discriminated smokers in LUAD patients according to levels of exposure to tobacco quantified in pack-years. These peaks were also significantly associated with progression-free survival and overall survival of these patients. Further examination of the gene set related to those peaks revealed that the comprising genes, such as KRT19, B3GNT3, CLDN7 and CLDN3 are strongly associated with LUAD development. They are consistent with the important roles of the associated pathways in LUAD oncogenesis induced by smoking, including estrogen response, apical junction and glycolysis pathways. In summary, our study may provide valuable insights into exploring ATAC-seq peaks and understanding smoking-related LUAD carcinogenesis from a perspective of open chromatin changes.

Keywords: ATAC-Seq; LUAD; Network; Prognostic; Smoking.


Conflict of interest statement

The authors declare the following financial interests/personal relationships which may be considered as potential competing interests:Kui Wu reports financial support was provided by the Science, Technology, and Innovation Commission of Shenzhen Municipality. Kui Wu reports financial support was provided by Guangdong Enterprise Key Laboratory of Human Disease Genomics.

Figures

Fig. 1
Fig. 1
The graphical abstract of analyses performed in this study. To reduce the complexity of the large data and only emphasize on important peaks, a correlation network was constructed. Peaks were connected to each other if their direct or indirect correlations are significant (red dots). We chose the 10 % most frequently-connected peaks as the important peaks for the further PCA analysis. Finally, we analyzed the associations between components obtained from PCA and patient's survival.
Fig. 2
Fig. 2
Principal Component Analysis on the selected peaks from TCGA ATAC-data. The unsupervised PCA for the 10 % most frequently-connected peaks selected from TCGA ATAC-seq data across all cancer types. Each dot represents a given sample. Color represents the cancer type shown in the Figure. ACC, adrenocortical carcinoma; BLCA, bladder urothelial carcinoma; BRCA, breast invasive carcinoma; CESC, cervical squamous cell carcinoma; CHOL, cholangiocarcinoma; COAD, colon adenocarcinoma; ESCA, esophageal carcinoma; GBM, glioblastoma multiforme; HNSC, head and neck squamous cell carcinoma; KIRC, kidney renal clear cell carcinoma; KIRP, kidney renal papillary cell carcinoma; LGG, low grade glioma; LIHC, liver hepatocellular carcinoma; LUAD, lung adenocarcinoma; LUSC, lung squamous cell carcinoma; MESO, mesothelioma; PCPG, pheochromocytoma and paraganglioma; PRAD, prostate adenocarcinoma; SKCM, skin cutaneous melanoma; STAD, stomach adenocarcinoma; TGCT, testicular germ cell tumors; THCA, thyroid carcinoma; UCEC, uterine corpus endometrial carcinoma.
Fig. 3
Fig. 3
Identification of the smoking associated peak set from LUAD patients using TCGA ATAC-data. A. The unsupervised PCA on LUAD samples (N = 22) from TCGA. Dots present samples and their colors present patients' different smoking histories. Pack-years information of four patients is not available in TCGA data. The left and right sides of the orange borders were defined by the ±mean of all LUAD samples' distances from the PC1 axis. The upper and lower sides of the blue borders were defined by the ±mean of all LUAD samples' distances from the PC2 axis. The x and y values of each sample were generated in PCA, which were not true peaks values. The samples within the borders thus have relatively more stable PC1 or 2-related peaks. B. Each sample's absolute distance from PC1 axis (towards line x = 0 in Fig. 3A) was measured and compared between groups of <20 pack-years (N = 5) and ≥20 pack-years (N = 12). One outlier from group of ≥20 pack-years had been removed, according to Grubbs' test. PC1 related peak set identified from LUAD patients was not associated with smoking, as the difference is not significant. C. Each sample's absolute distance from PC2 axis (towards line y = 0 in Fig. 3A) was measured and compared between groups of <20 pack-years (N = 4) and ≥20 pack-years (N = 13). One outlier from group of <20 pack-years had been removed, according to Grubbs' test. P < 0.05 was considered statistically significant, two-tailed unpaired t-tests.
Fig. 4
Fig. 4
The survival analyses of LUAD patients with different absolute distance towards PC1 or PC2. Samples were divided into two groups based on they are inside or outside the range shown for PC1 (orange borders) in Fig. 3A. The PFS (A) and OS (B) were compared between the group of samples outside the range (N = 9) and the group of samples inside the range (N = 13) by the Kaplan-Meier survival curves. Samples were also divided into two groups based on they are inside or outside the range shown for PC2 (blue borders) in Fig. 3A. The PFS (C) and OS (D) were compared between the group of samples outside the range (N = 8) and the group of samples inside the range (N = 14) by the Kaplan-Meier survival curves. P < 0.05 were considered significant, log-rank test. Patients who survived but stopped being tracked are indicated by crosses.

Similar articles

References

    1. Sung H., Ferlay J., Siegel R.L., Laversanne M., Soerjomataram I., Jemal A., Bray F. Global cancer statistics 2020: GLOBOCAN estimates of incidence and mortality worldwide for 36 cancers in 185 countries. CA A Cancer J. Clin. 2021;71(3):209–249. doi: 10.3322/caac.21660. - DOI - PubMed
    1. Herbst R.S., Morgensztern D., Boshoff C. The biology and management of non-small cell lung cancer. Nature. 2018;553(7689):446–454. doi: 10.1038/nature25183. - DOI - PubMed
    1. Herbst R.S., Heymach J.V., Lippman S.M. Lung cancer. N. Engl. J. Med. 2008;359(13):1367–1380. doi: 10.1056/NEJMra0802714. - DOI - PMC - PubMed
    1. Freedman N.D., Leitzmann M.F., Hollenbeck A.R., Schatzkin A., Abnet C.C. Cigarette smoking and subsequent risk of lung cancer in men and women: analysis of a prospective cohort study. Lancet Oncol. 2008;9(7):649–656. doi: 10.1016/S1470-2045(08)70154-2. - DOI - PMC - PubMed
    1. Neumann T., Rasmussen M., Heitmann B.L., Tønnesen H. Gold standard program for heavy smokers in a real-life setting. Int J Environ Res Public Health. 2013;10(9):4186–4199. doi: 10.3390/ijerph10094186. - DOI - PMC - PubMed

LinkOut - more resources