

Development and validation of artificial intelligence models for early detection of postoperative infections (PERISCOPE): a multicentre study using electronic health record data
- PMID: 39720095
- PMCID: PMC11667051
- DOI: 10.1016/j.lanepe.2024.101163
Development and validation of artificial intelligence models for early detection of postoperative infections (PERISCOPE): a multicentre study using electronic health record data
Abstract
Background: Postoperative infections significantly impact patient outcomes and costs, exacerbated by late diagnoses, yet early reliable predictors are scarce. Existing artificial intelligence (AI) models for postoperative infection prediction often lack external validation or perform poorly in local settings when validated. We aimed to develop locally valid models as part of the PERISCOPE AI system to enable early detection, safer discharge, and more timely treatment of patients.
Methods: We developed and validated XGBoost models to predict postoperative infections within 7 and 30 days of surgery. Using retrospective pre-operative and intra-operative electronic health record data from 2014 to 2023 across various surgical specialities, the models were developed at Hospital A and validated and updated at Hospitals B and C in the Netherlands and Belgium. Model performance was evaluated before and after updating using the two most recent years of data as temporal validation datasets. Main outcome measures were model discrimination (area under the receiver operating characteristic curve (AUROC)), calibration (slope, intercept, and plots), and clinical utility (decision curve analysis with net benefit).
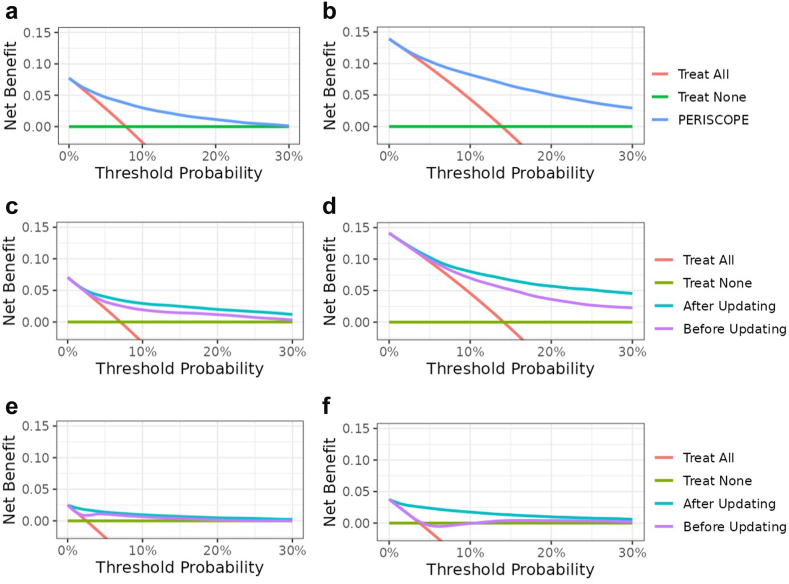
Findings: The study included 253,010 surgical procedures with 23,903 infections within 30-days. Discriminative performance, calibration properties, and clinical utility significantly improved after updating. Final AUROCs after updating for Hospitals A, B, and C were 0.82 (95% confidence interval (CI) 0.81-0.83), 0.82 (95% CI 0.81-0.83), and 0.91 (95% CI 0.90-0.91) respectively for 30-day predictions on the temporal validation datasets (2022-2023). Calibration plots demonstrated adequate correspondence between observed outcomes and predicted risk. All local models were deemed clinically useful as the net benefit was higher than default strategies (treat all and treat none) over a wide range of clinically relevant decision thresholds.
Interpretation: PERISCOPE can accurately predict overall postoperative infections within 7- and 30-days post-surgery. The robust performance implies potential for improving clinical care in diverse clinical target populations. This study supports the need for approaches to local updating of AI models to account for domain shifts in patient populations and data distributions across different clinical settings.
Funding: This study was funded by a REACT EU grant from European Regional Development Fund (ERDF) and Kansen voor West.
Keywords: Artificial intelligence; Clinical utility; Model updating; Multi-centre validation; Postoperative infection.
© 2024 The Author(s).
Conflict of interest statement
BFG is currently CEO and major shareholder of Healthplus.ai B.V. and subsidiaries. BFG has also received consulting fees from Philips NV and Edwards Lifesciences LLC. SLvdM and LJS are employees at Healthplus.ai B.V. SLvdM and LJS own stock options in Healthplus.ai B.V. HvG is an advisor for Healthplus.ai. MGJdB is the current president of the Dutch foundation for Antimicrobial Policies (Dutch acronym SWAB) and honorary secretary of ESCMID's Study Group on Antimicrobial Policies (ESGAP).
Figures


References
-
- Eappen S., Lane B.H., Rosenberg B., et al. Relationship between occurrence of surgical complications and hospital finances. JAMA. 2013;309(15):1599–1606. - PubMed
-
- Wan Y.I., Patel A., Achary C., et al. Postoperative infection and mortality following elective surgery in the International Surgical Outcomes Study (ISOS) Br J Surg. 2021;108(2):220–227. - PubMed
-
- Ghaferi A.A., Birkmeyer J.D., Dimick J.B. Hospital volume and failure to rescue with high-risk surgery. Med Care. 2011;49(12):1076–1081. - PubMed
-
- Gawande A.A., Thomas E.J., Zinner M.J., Brennan T.A. The incidence and nature of surgical adverse events in Colorado and Utah in 1992. Surgery. 1999;126(1):66–75. - PubMed
LinkOut - more resources
Full Text Sources
