. 2024 Dec 10:15:1487608.
doi: 10.3389/fgene.2024.1487608. eCollection 2024.

Comprehensive evaluation of AlphaMissense predictions by evidence quantification for variants of uncertain significance

Affiliations

Comprehensive evaluation of AlphaMissense predictions by evidence quantification for variants of uncertain significance

Amina Kurtovic-Kozaric et al. Front Genet. .

Abstract

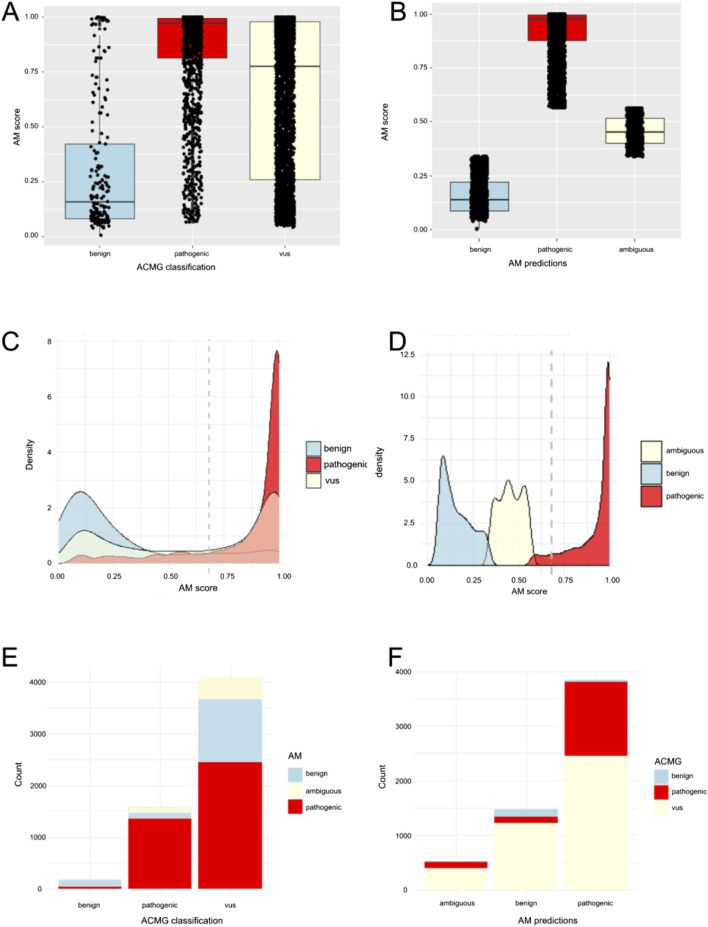
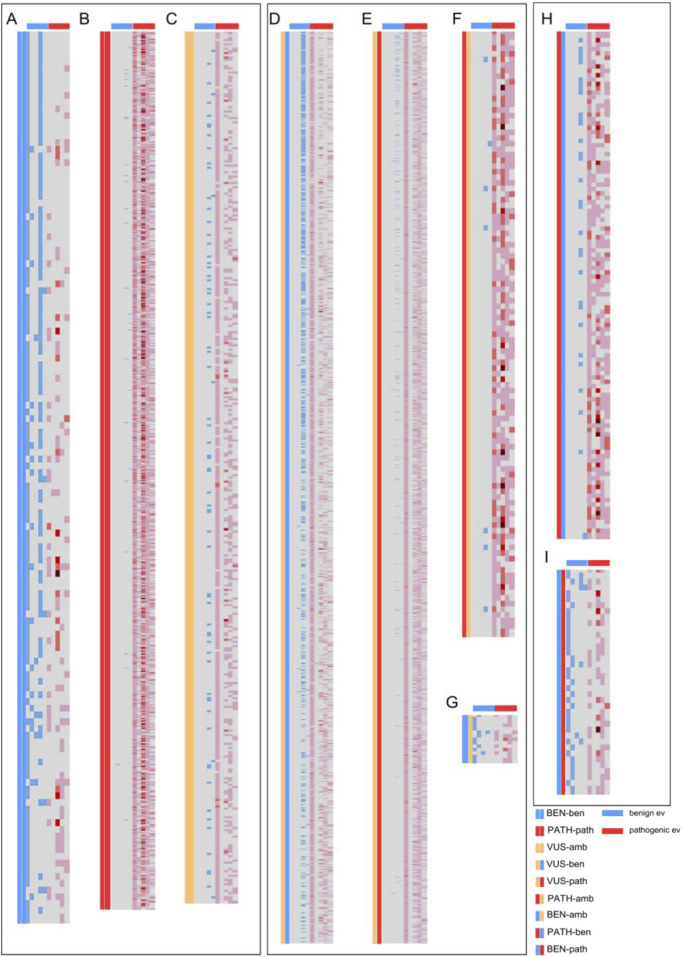
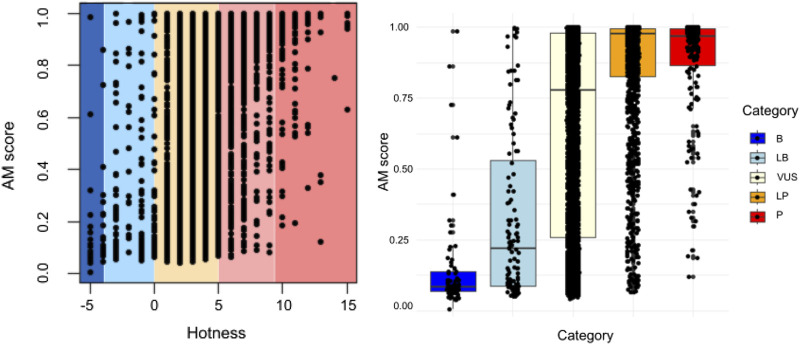
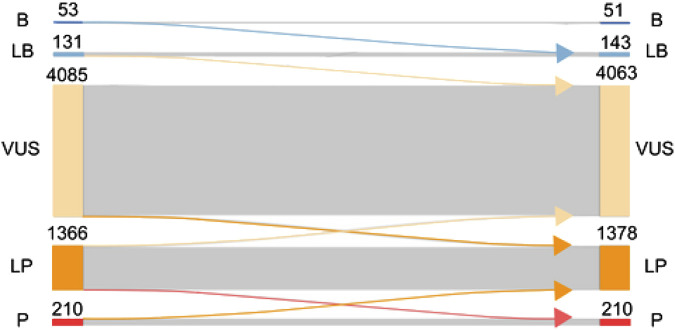
Accurate variant classification is critical for genetic diagnosis. Variants without clear classification, known as "variants of uncertain significance" (VUS), pose a significant diagnostic challenge. This study examines AlphaMissense performance in variant classification, specifically for VUS. A systematic comparison between AlphaMissense predictions and predictions based on curated evidence according to the ACMG/AMP classification guidelines was conducted for 5845 missense variants in 59 genes associated with representative Mendelian disorders. A framework for quantifying and modeling VUS pathogenicity was used to facilitate comparison. Manual reviewing classified 5845 variants as 4085 VUS, 1576 pathogenic/likely pathogenic, and 184 benign/likely benign. Pathogenicity predictions based on AlphaMissense and ACMG guidelines were concordant for 1887 variants (1352 pathogenic, 132 benign, and 403 VUS/ambiguous). The sensitivity and specificity of AlphaMissense predictions for pathogenicity were 92% and 78%. Moreover, the quantification of VUS evidence and heatmaps weakly correlated with the AlphaMissense score. For VUS without computational evidence, incorporating AlphaMissense changed the VUS quantification for 878 variants, while 56 were reclassified as likely pathogenic. When AlphaMissense replaced existing computational evidence for all VUS, 1709 variants changed quantified criteria while 63 were reclassified as likely pathogenic. Our research suggests that the augmentation of AlphaMissense with empirical evidence may improve performance by incorporating a quantitative framework to aid in VUS classification.

Keywords: ACMG/AMP classification; AlphaMissense; VUS; variant classification; variants of unknown significance.


Conflict of interest statement

AK-K, LD, BM, LC, ES, and MK were employed by the company Genomenon.

Figures

FIGURE 1
FIGURE 1
Comparison of AlphaMissense (AM) predictions to Mastermind (MM) classifications. (A) Distribution of AM scores among variants classified as pathogenic (including likely pathogenic n = 1,576), benign (including likely benign n = 184), or VUS (n = 4,085) presented as box-plot. (B) Distribution of AM scores among AM predictions for pathogenic (n = 3,848), benign (n = 1,472), and ambiguous variants (n = 524). (C) Density distribution bell curve of AM score among variants classified as pathogenic (including likely pathogenic n = 1,576), benign (including likely benign n = 184), or VUS (n = 4,085). (D) Density distribution bell curve of AM score among AM predictions for pathogenic (n = 3,848), benign (n = 1,472), and ambiguous variants (n = 524). (E) Ratio of MM classified variants, predicted as benign, pathogenic, or ambiguous by AM. (F). Ratio of AM predicted variants classified as benign (including likely benign), VUS, or pathogenic (including likely pathogenic) by MM.
FIGURE 2
FIGURE 2
Heatmaps showcasing the individual ACMG evidence (grouped by type) assigned for each missense variant from the 59 evaluated genes. Each row represents a missense variant from one of the 59 genes. Columns represent, from left to right: two columns depicting the comparison groups, benign population, benign functional and allelic, benign clinical, benign computational, and benign molecular impact evidence, as marked by the blue horizontal lines above; and pathogenic population, pathogenic functional and allelic, pathogenic clinical, pathogenic computational, and pathogenic molecular impact evidence, as marked by the red horizontal lines. The blue and red colors in the columns represent assigned evidence, with darker red colors depicting multiple evidence assigned from that evidence group. (A) Comparison of benign variants by ACMG classification and AlphaMissense. (B) Comparison of pathogenic variants by ACMG classification and AlphaMissense. (C) Comparison of VUS/ambiguous variants by ACMG classification and AlphaMissense. (D) Comparison of VUS by ACMG and benign by AlphaMissense. (E) Comparison of VUS by ACMG and pathogenic by AlphaMissense. (F) Comparison of pathogenic by ACMG and VUS by AlphaMissense. (G) Comparison of benign by ACMG and VUS by AlphaMissense. (H) Comparison of pathogenic by ACMG and benign by AlphaMissense. (I) Comparison of benign by ACMG and pathogenic by AlphaMissense.
FIGURE 3
FIGURE 3
Quantification (points-based system) of variant pathogenicity using a Bayesian framework. Comparison of AlphaMissense scores for each classified variant is shown in relation to quantification (−8 to −4 as benign, −4 to −1 as likely benign, 0 to 5 as VUS, 6 to 9 as likely pathogenic, and ≥10 as pathogenic). All variants are presented, showcasing quantification by categories. A correlation exists between the AlphaMissense score and the point-based system, i.e., ACMG classification (p < 0.05).
FIGURE 4
FIGURE 4
Effect of replacing existing computational evidence with AlphaMissense predictions on the final classification. ACMG classification of variants (B, benign; LB, likely benign; VUS, variant of unknown significance; LP, likely pathogenic; P, pathogenic) is presented on the left side before AlphaMissense predictions are added to the classification. Once AlphaMissense predictions are incorporated into the classification, the number of benign, likely benign, VUS, likely pathogenic, and pathogenic variants is shown. Arrows going from left to right show the number of variants changing classification after the incorporation of AlphaMissense predictions.

Similar articles

Cited by

References

    1. Ahmad R. N. R., Zhang L. T., Morita R., Tani H., Wu Y., Chujo T., et al. (2024). Pathological mutations promote proteolysis of mitochondrial tRNA-specific 2-thiouridylase 1 (MTU1) via mitochondrial caseinolytic peptidase (CLPP). Nucleic Acids Res. 52 (3), 1341–1358. 10.1093/nar/gkad1197 - DOI - PMC - PubMed
    1. 1000 Genomes Project Consortium, Auton A., Brooks L. D., Durbin R. M., Garrison E. P., Kang H. M., et al. (2015). A global reference for human genetic variation. Nature 526 (7571), 68–74. 10.1038/nature15393 - DOI - PMC - PubMed
    1. Barboso G., Fragnito C., Beghi C., Saccani S., Fesani F. (1987). Asymptomatic patient reoperated on for severe proximal stenosis of circular sequential vein graft. J. Cardiovasc Surg. 28 (3), 341–342. - PubMed
    1. Burke W., Parens E., Chung W. K., Berger S. M., Appelbaum P. S. (2022). The challenge of genetic variants of uncertain clinical significance: a narrative review. Ann. Intern Med. 175 (7), 994–1000. 10.7326/M21-4109 - DOI - PMC - PubMed
    1. Chabane K., Charlot C., Gugenheim D., Simonet T., Armisen D., Viailly P. J., et al. (2024). Real life evaluation of AlphaMissense predictions in hematological malignancies. Leukemia 38 (2), 420–423. 10.1038/s41375-023-02116-3 - DOI - PubMed

LinkOut - more resources