. 2024 Dec 11;4(1):pgae557.
doi: 10.1093/pnasnexus/pgae557. eCollection 2025 Jan.

Epihiper-A high performance computational modeling framework to support epidemic science

Affiliations

Epihiper-A high performance computational modeling framework to support epidemic science

Jiangzhuo Chen et al. PNAS Nexus. .

Abstract

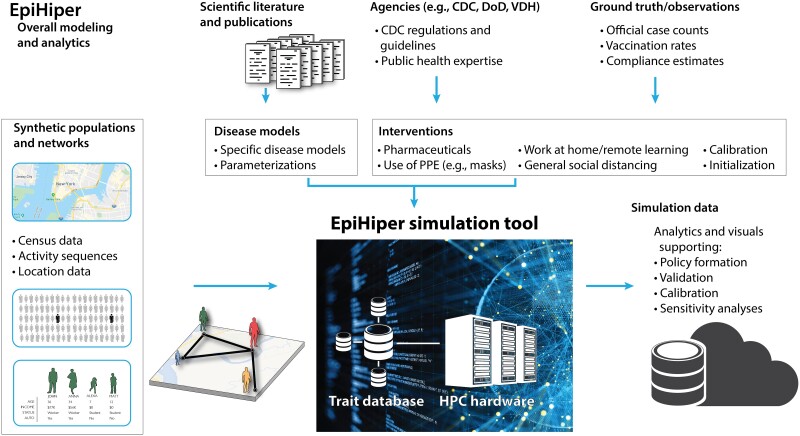
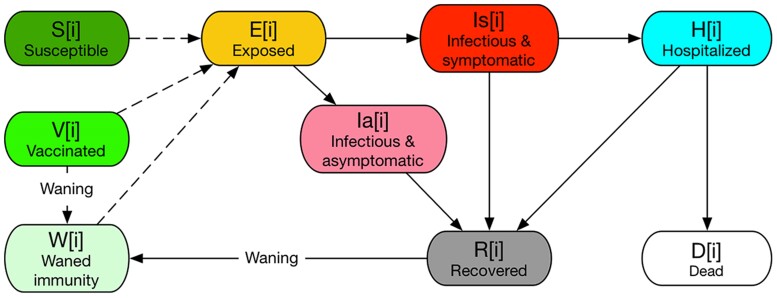
This paper describes Epihiper, a state-of-the-art, high performance computational modeling framework for epidemic science. The Epihiper modeling framework supports custom disease models, and can simulate epidemics over dynamic, large-scale networks while supporting modulation of the epidemic evolution through a set of user-programmable interventions. The nodes and edges of the social-contact network have customizable sets of static and dynamic attributes which allow the user to specify intervention target sets at a very fine-grained level; these also permit the network to be updated in response to nonpharmaceutical interventions, such as school closures. The execution of interventions is governed by trigger conditions, which are Boolean expressions formed using any of Epihiper's primitives (e.g. the current time, transmissibility) and user-defined sets (e.g. people with work activities). Rich expressiveness, extensibility, and high-performance computing responsiveness were central design goals to ensure that the framework could effectively target realistic scenarios at the scale and detail required to support the large computational designs needed by state and federal public health policymakers in their efforts to plan and respond in the event of epidemics. The modeling framework has been used to support the CDC Scenario Modeling Hub for COVID-19 response, and was a part of a hybrid high-performance cloud system that was nominated as a finalist for the 2021 ACM Gordon Bell Special Prize for high performance computing-based COVID-19 Research.

Keywords: agent-based models; computational epidemiology; high performance computing; programmable pharmaceutical and nonpharmaceutical interventions; social-contact networks.


Figures

Fig. 1.
Fig. 1.
Framework overview: Epihiper takes as input a synthetic population consisting of people with individual demographic- and disease-relevant attributes, as well as a contact network on which transmission takes place (left panel). This is integrated with disease models and parameters taken from peer-reviewed literature, and highly detailed interventions based on guidelines from the Centers for Disease Control and Prevention (CDC), Department of Defense (DoD), and the Virginia Department of Health (VDH) (top panel). After calibration, the Epihiper framework can generate simulation outcomes and analytics for virtually any scenario involving COVID-19 and influenza-like diseases. For large, complex scenarios, the use of high performance computing hardware is typically needed, along with person attributes stored in a dedicated trait database (lower part of diagram; PPE, personal protective equipment).
Fig. 2.
Fig. 2.
An example network for Epihiper with agents P, P, and P.
Fig. 3.
Fig. 3.
Design of scenarios in CDC COVID-19 SMH Round 12 (55).
Fig. 4.
Fig. 4.
Disease model used for Epihiper simulations in Round 12 of the CDC COVID-19 SMH. Note that the figure shows the states of a node of age group i; all age groups have the same states and transitions, but the parameters, including susceptibility, infectivity, dwell time, and transition probability, may be different between different age groups. The states E, I, and Ia are duplicated with the same values of infectivity and susceptibility parameters for Omicron, to keep track of cross-infections between variants due to immune escape.
Fig. 5.
Fig. 5.
CDC COVID-19 SMH Round 12 projections by Epihiper for cases and hospitalizations under four hypothetical scenarios (A through D from Fig. 3) in the first three months of 2022. The curves show the median of projections, and the ribbons show the 95% projection interval.
Fig. 6.
Fig. 6.
Impact of intervention complexity on computation time for experiments I–VIII (see also Supplementary Material, Section D) factored by the main simulation tasks which are intervention (red bar - segment 1), transmission (green bar - segment 2), update (light blue bar - segment 3), synchronization (yellow bar - segment 4), output (orange bar - segment 5), and initialization (dark blue bar - segment 6). Here segment refers to the block within each bar, with the numbering going from bottom to top. The unit on the y-axis is seconds. The experiments were conducted on Intel Xeon 6248 @2.50 GHz processors with 384 Gb of memory, and the population network for Virginia has 7,688,059 nodes and 371,888,620 (directed) edges.
Fig. 7.
Fig. 7.
Epihiper running time as a function of network size for the US states with a simulation time of 220 days. Running time as a function of the number of A) nodes and B) edges. All computations have been performed on nodes featuring Intel Xeon 6248 @2.50 GHz processors and 384 Gb memory.
Fig. 8.
Fig. 8.
An illustration of the population and network components used in Epihiper. Location assignment is illustrated on the left, and captured formally as the people-location network GPL (middle), which, in turn, gives rise to a social contact network GP (right).

References

    1. Ferguson N, et al. 2020. Report 9: impact of non-pharmaceutical interventions (NPIs) to reduce COVID19 mortality and healthcare demand. - PMC - PubMed
    1. Halloran ME, et al. 2008. Modeling targeted layered containment of an influenza pandemic in the United States. Proc Natl Acad Sci U S A. 105(12):4639–4644. - PMC - PubMed
    1. Lofgren ET, et al. 2014. Opinion: mathematical models: a key tool for outbreak response. Proc Natl Acad Sci U S A. 111(51):18095–18096. - PMC - PubMed
    1. Marathe MV, Ramakrishnan N. 2013. Recent advances in computational epidemiology. IEEE Intell Syst. 28(4):96–101. - PMC - PubMed
    1. Iranzo V, Pérez-González S. 2021. Epidemiological models and COVID-19: a comparative view. Hist Philos Life Sci. 43(3):104. - PMC - PubMed

LinkOut - more resources