

An explainable predictive model for anxiety symptoms risk among Chinese older adults with abdominal obesity using a machine learning and SHapley Additive exPlanations approach
- PMID: 39720434
- PMCID: PMC11666561
- DOI: 10.3389/fpsyt.2024.1451703
An explainable predictive model for anxiety symptoms risk among Chinese older adults with abdominal obesity using a machine learning and SHapley Additive exPlanations approach
Abstract
Background: Early detection of anxiety symptoms can support early intervention and may help reduce the burden of disease in later life in the elderly with abdominal obesity, thereby increasing the chances of healthy aging. The objective of this research is to formulate and validate a predictive model that forecasts the probability of developing anxiety symptoms in elderly Chinese individuals with abdominal obesity.
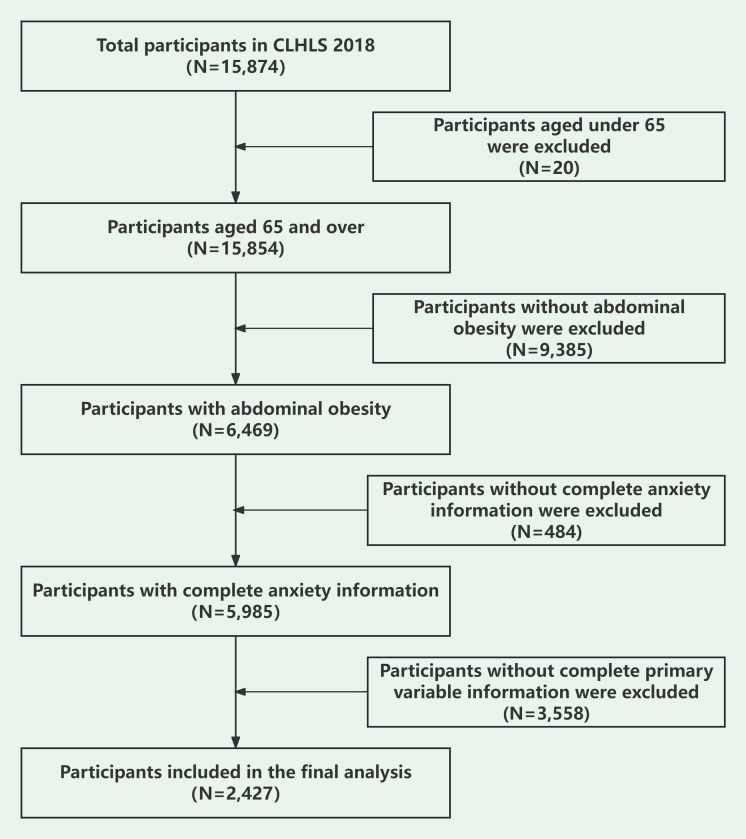
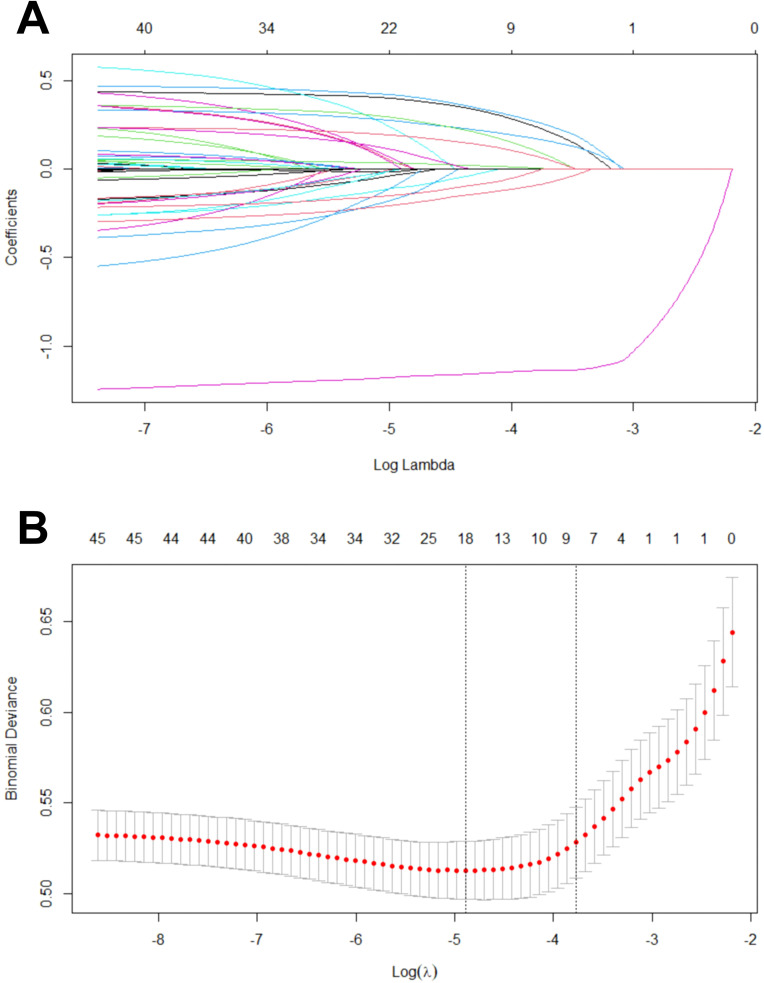
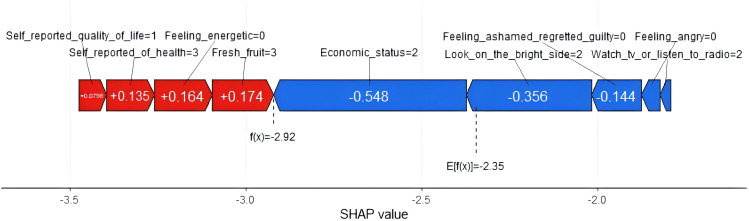
Method: This research's model development and internal validation encompassed 2,427 participants from the 2017-2018 Study of the Chinese Longitudinal Healthy Longevity Survey (CLHLS). Forty-six variables were defined based on the Health Ecology Model (HEM) theoretical framework. Key variables were screened using LASSO regression, and the XGBoost (Extreme Gradient Boosting) model was further introduced to forecast the risk of developing anxiety symptoms in the elderly with abdominal obesity. SHapley Additive exPlanations (SHAP) was adopted to further interpret and show how the eigenvalues contributed to the model predictions.
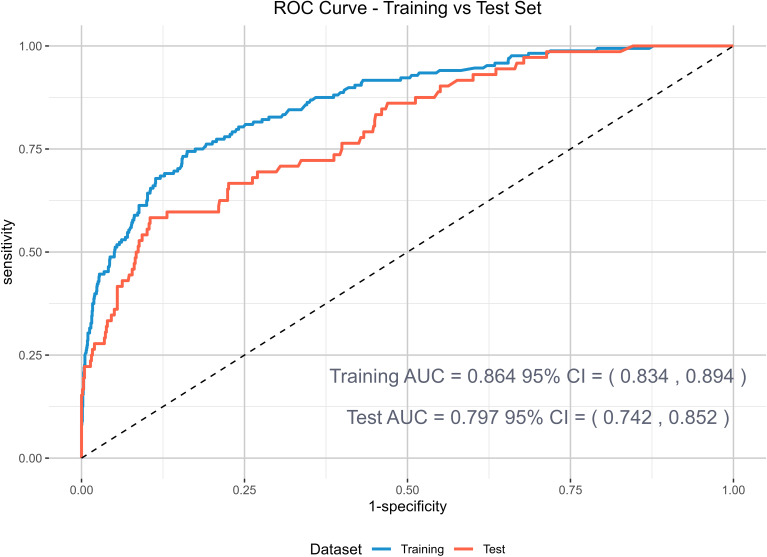
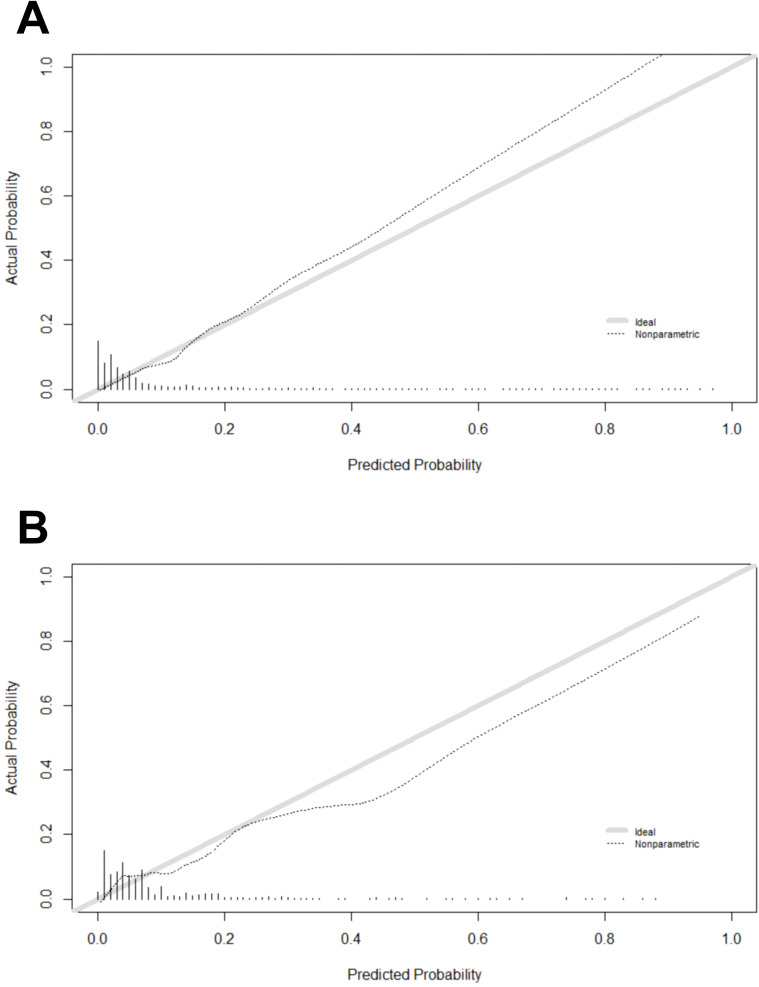
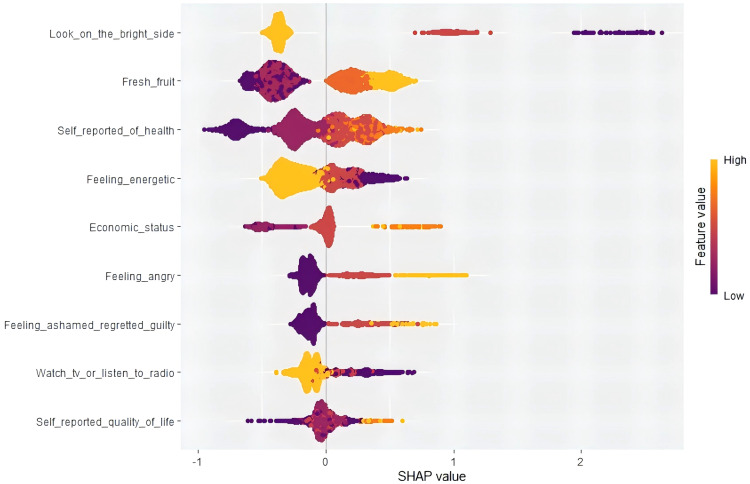
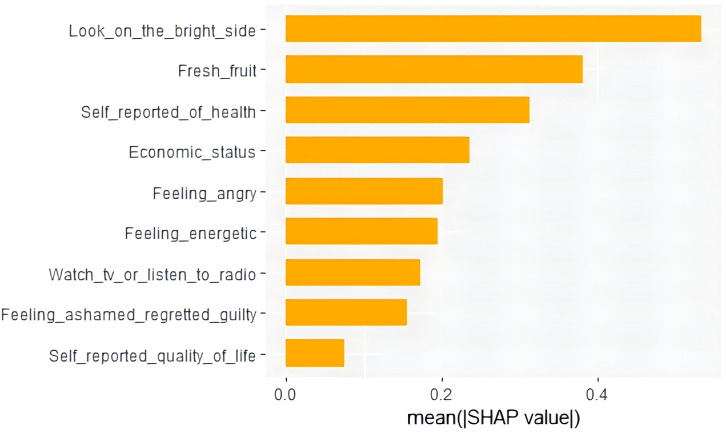
Results: A total of 240 participants (9.89%) with anxiety symptoms out of 2,427 participants were included. LASSO regression identified nine key variables: looking on the bright side, self-reported economic status, self-reported quality of life, self-reported health status, watching TV or listening to the radio, feeling energetic, feeling ashamed/regretful/guilty, feeling angry, and fresh fruits. All the evaluation indicators of the XGBoost model showed good predictive efficacy. Based on the significance of the features identified by SHAP (Model Interpretation Methodology), the feature 'looking on the bright side' was the most important, and the feature 'self-reported quality of life' was the least important. The SHAP beeswarm plot illustrated the impacts of features affected by XGBoost.
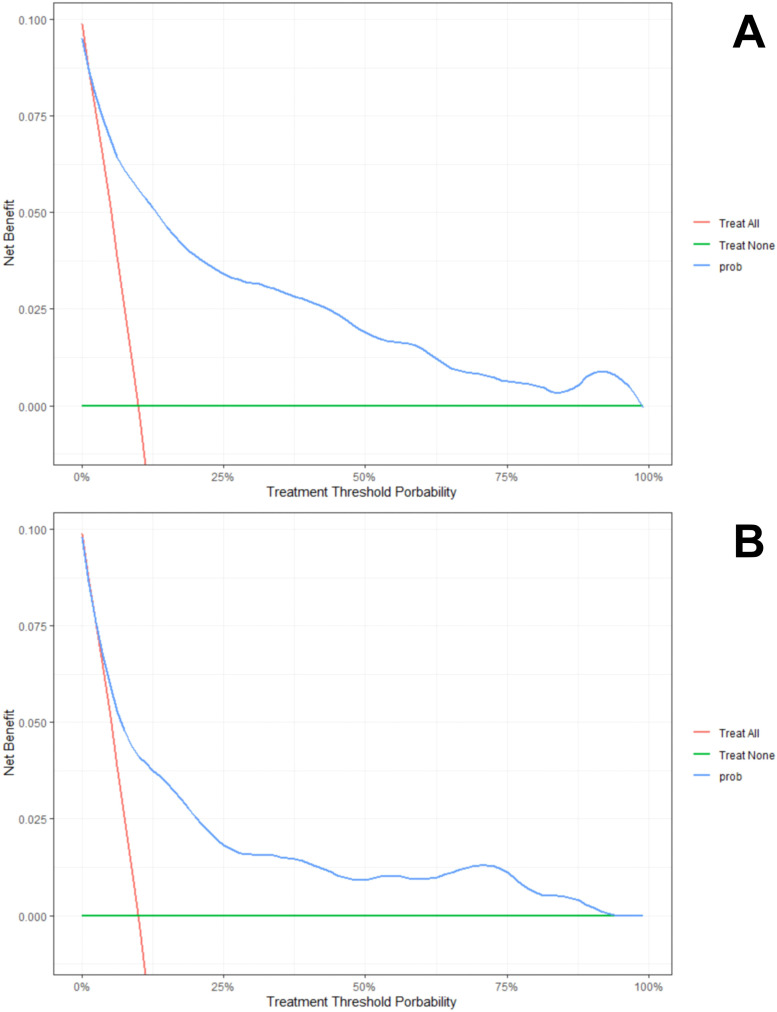
Conclusion: Utilizing machine learning techniques, our predictive model can precisely evaluate the risk of anxiety symptoms among elderly individuals with abdominal obesity, facilitating the timely adoption of targeted intervention measures. The integration of XGBoost and SHAP offers transparent interpretations for customized risk forecasts.
Keywords: SHAP; XGBoost; abdominal obesity; anxiety symptoms; older adults.
Copyright © 2024 Niu, Cao, Cheng, Zhang, Zhang, Xue, Ma, Ran and Xian.
Conflict of interest statement
The authors declare that the research was conducted in the absence of any commercial or financial relationships that could be construed as a potential conflict of interest.
Figures
Similar articles
-
Constructing a predictive model for early-onset sepsis in neonatal intensive care unit newborns based on SHapley Additive exPlanations explainable machine learning.Transl Pediatr. 2024 Nov 30;13(11):1933-1946. doi: 10.21037/tp-24-278. Epub 2024 Nov 26. Transl Pediatr. 2024. PMID: 39649648 Free PMC article.
-
Disability risk prediction model based on machine learning among Chinese healthy older adults: results from the China Health and Retirement Longitudinal Study.Front Public Health. 2023 Nov 9;11:1271595. doi: 10.3389/fpubh.2023.1271595. eCollection 2023. Front Public Health. 2023. PMID: 38026309 Free PMC article.
-
Interpretable machine learning model for early prediction of delirium in elderly patients following intensive care unit admission: a derivation and validation study.Front Med (Lausanne). 2024 May 17;11:1399848. doi: 10.3389/fmed.2024.1399848. eCollection 2024. Front Med (Lausanne). 2024. PMID: 38828233 Free PMC article.
-
[Prediction of depression symptoms in seniors and analysis of influencing factors based on explainable machine learning].Zhonghua Liu Xing Bing Xue Za Zhi. 2025 Feb 10;46(2):316-324. doi: 10.3760/cma.j.cn112338-20240809-00488. Zhonghua Liu Xing Bing Xue Za Zhi. 2025. PMID: 39965839 Chinese.
-
Interpretable machine learning model to predict surgical difficulty in laparoscopic resection for rectal cancer.Front Oncol. 2024 Feb 6;14:1337219. doi: 10.3389/fonc.2024.1337219. eCollection 2024. Front Oncol. 2024. PMID: 38380369 Free PMC article. Review.
Cited by
-
Depressive Symptoms and Associated Factors Among Middle-Aged and Older Patients with Chronic Kidney Disease: Gender Differences Based on a Health Ecological Model.Healthcare (Basel). 2025 Aug 9;13(16):1951. doi: 10.3390/healthcare13161951. Healthcare (Basel). 2025. PMID: 40868566 Free PMC article.
References
LinkOut - more resources
Full Text Sources