. 2024 Nov 26;27(12):111473.
doi: 10.1016/j.isci.2024.111473. eCollection 2024 Dec 20.

Prediction of key biological processes from intercellular DNA damage differences through model-based fitting

Affiliations

Prediction of key biological processes from intercellular DNA damage differences through model-based fitting

Kensuke Otsuka et al. iScience. .

Abstract

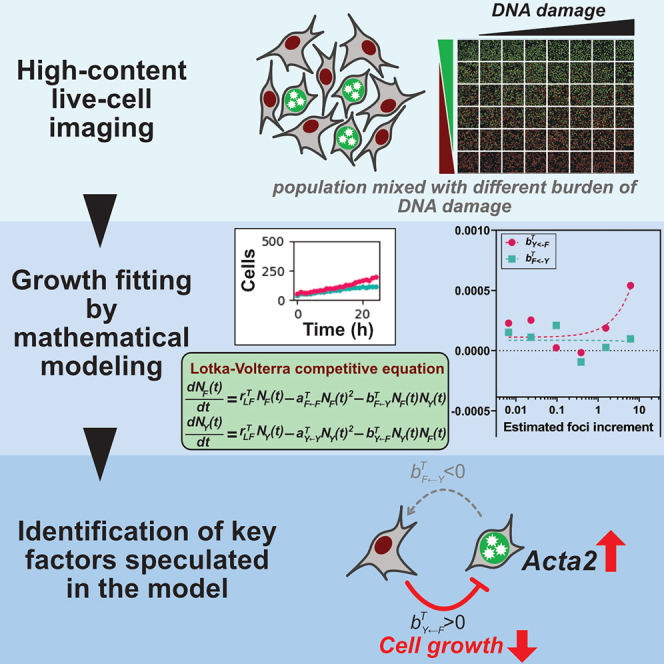
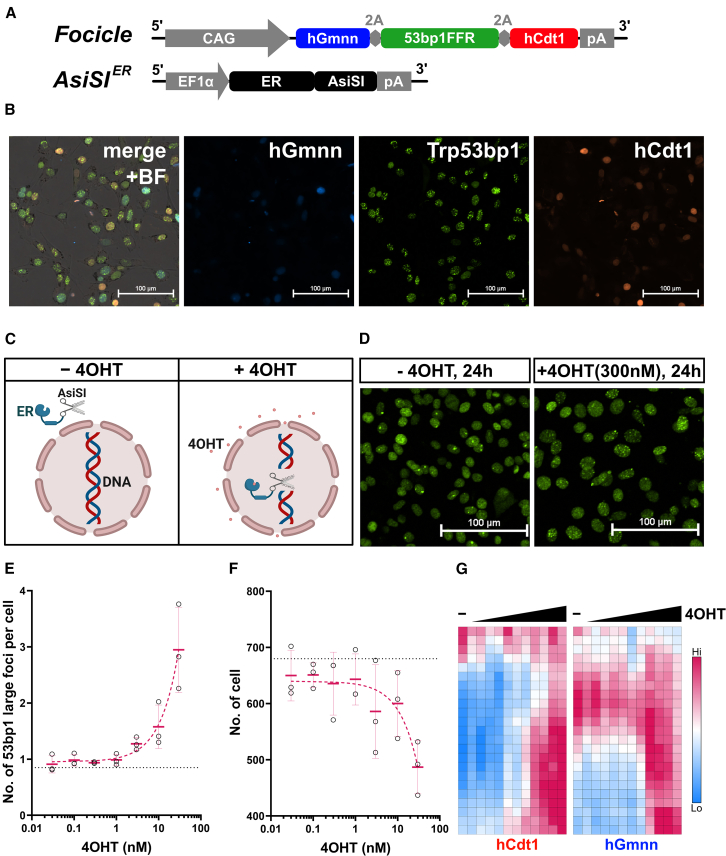
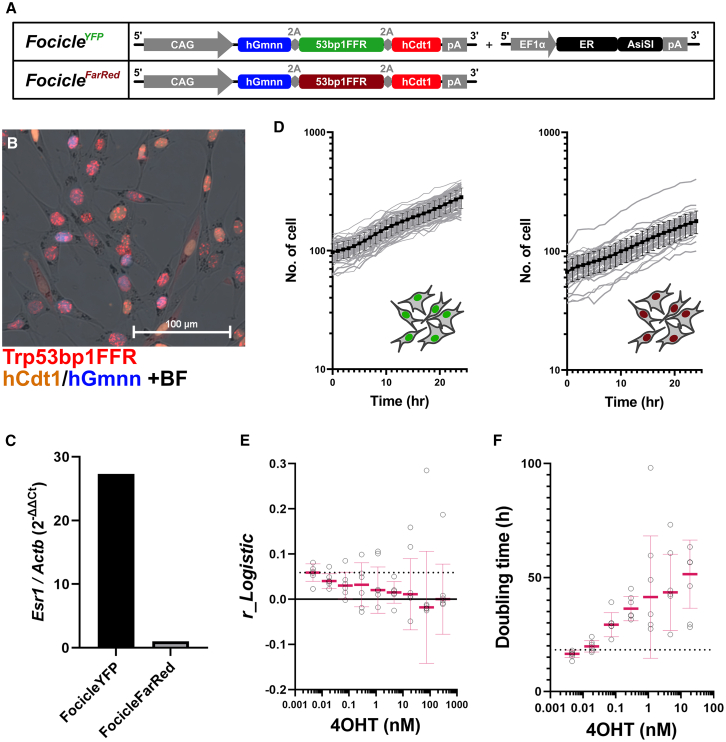
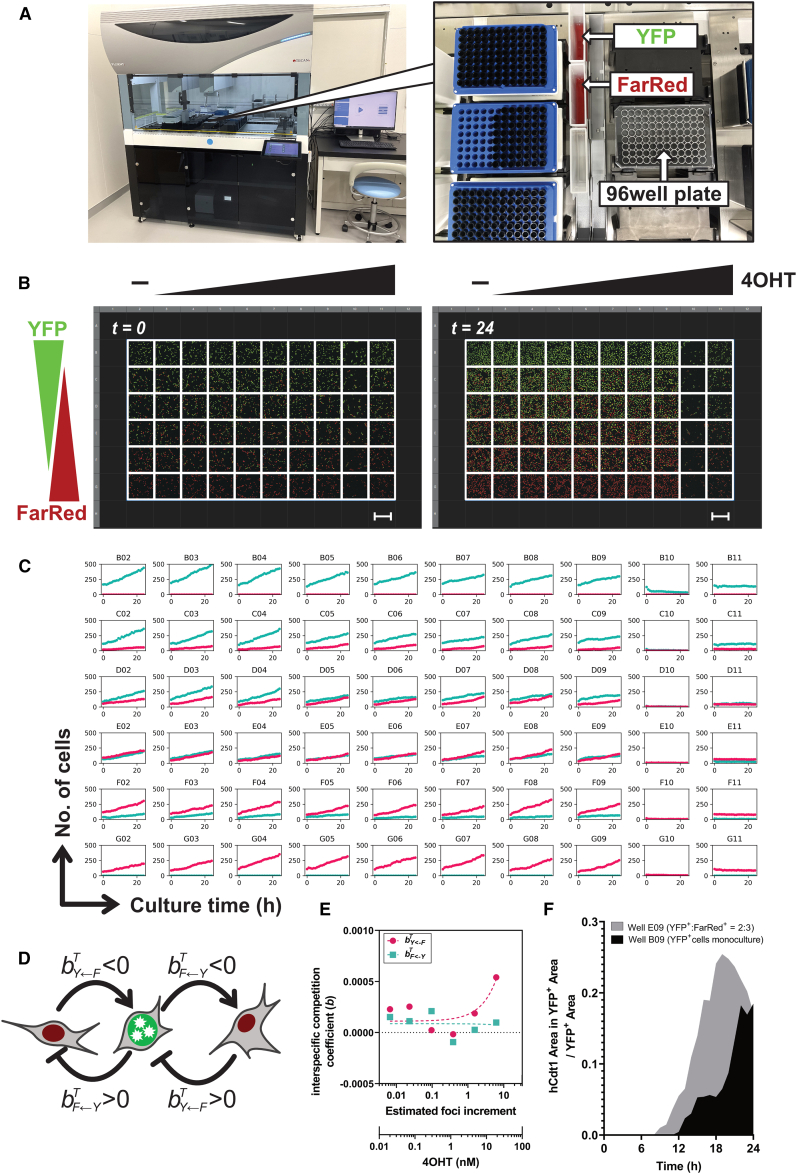
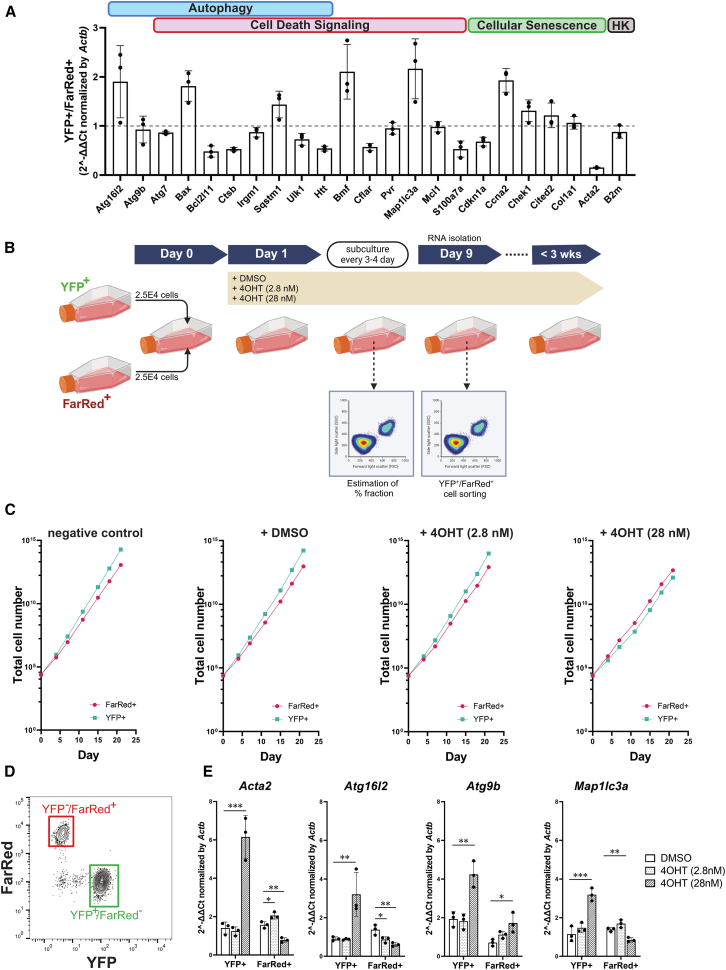
DNA double-strand breaks (DSBs) occurring within the genomic DNA of mammalian cells significantly impact cell survival, depending upon their repair capacity. This study presents a mathematical model to fit fibroblast survival rates with a sequence-specific DSB burden induced by the restriction enzyme AsiSI. When cells had a sporadic DSB burden under mixed culture, cell growth showed a good fit to the Lotka-Volterra competitive equation, predicting the presence of modifying factors acting as competitive cell-to-cell interactions compared to monocultures. Under the predicted condition, we found the Acta2 gene, a known marker of cancer-associated fibroblasts, played a role in competitive interactions between cells with different DSB burdens. These data suggest that the progression to the cancer microenvironment is determined by genomic stress, providing clues for estimating cancer risk by reconsidering the fitness of cells in their microenvironment.

Keywords: Cancer; Mathematical biosciences; Molecular biology.


Conflict of interest statement

The authors declare no competing interests.

Figures

None
Graphical abstract
Figure 1
Figure 1
Experimental design for live-cell imaging of DSB repair and cell-cycle status in fibroblasts (A) Focicle cassette knocked in the ROSA26 region using CRISPR-Cas9 tricistronically expresses Trp53bp1 foci-forming region (FFR)/YFP, hGmnn/BFP, and hCdt1/RFP. Furthermore, a plasmid expressing the AsiSI/estrogen receptor (ER) was transfected into cells with piggyBac transposase. (B) Images of BFP, YFP, RFP, and merged images, including bright-field (BF) channels of Focicle-expressing NIH3T3 cells, 1 h after irradiation with 1 Gy X-rays. Scale bars, 100 μm. (C) Addition of tamoxifen (4OHT) to the medium-induced DSBs by AsiSI, along with the nuclear translocation of ER. Illustrations were created with Biorender.com. (D) Images of the YFP channel 24 h after adding 300 nM 4OHT or in the absence of 4OHT. The addition of 4OHT caused numerous foci of DSBs in the nuclei. Scale bars, 100 μm. (E) The number of cells in the microscopic field of view 20 h after the addition of various concentrations of 4OHT. The mean values are indicated by red dashes, and the dotted lines represent the mean values in the absence of 4OHT in triplicate in one representative experiment. Solid magenta lines and error bars indicate their mean ± SD. Dotted line indicates the median in the absence of 4OHT treatment. (F) Mean number of 53bp1 large foci per cell at 20 h after adding various concentrations of 4OHT. Symbols are identical to those shown in (E) in triplicate in one representative experiment. Solid magenta lines and error bars indicate their mean ± SD. Dotted line indicates the median in the absence of 4OHT treatment. (G) Heatmap of 4OHT concentration versus the time course of nuclear hCdt1 or hGmnn fluorescence intensity every 1 h from top to bottom.
Figure 2
Figure 2
Designs of mixed culture experiments with different genomic stress conditions (A) A new gene cassette with Trp53bp1FFR fused to the fluorescent FarRed (iRFP670) protein was named FocicleFarRed to distinguish it from a conventional Focicle cassette (FocicleYFP). Both hCdt1/RFP and hGmnn/BFP have the same sequences. (B) The merged image of fluorescence and bright-field (BF) images of NIH3T3 cells expressing the FocicleFarRed cassette captured by live-cell imaging 1 h after 1 Gy of X-ray irradiation. Scale bars, 100 μm. (C) The expression of the estrogen receptor 1 (Esr1) was quantified by qRT-PCR and normalized using a housekeeping gene (Actb). Gene expression levels were compared with those of FocicleFarRed (2ΔΔCt). (D) FocicleYFP (left) and FocicleFarRed cells (right) were monoculture, and time-lapse live-cell imaging was performed every 1 h for 24 h. Gray lines indicate the growth of each 60 replicates sample, and solid black lines and error bars indicate their mean ± SD. (E) Intrinsic natural growth rate for logistic growth estimated from the growth data of FocicleYFP cells after treatment with different concentrations of tamoxifen (4OHT). White circles indicate six replicates points, and solid magenta line and error bars indicate median ± SD. Dotted line indicates the median in the absence of 4OHT treatment. (F) Doubling time for each 4OHT concentration estimated from the growth data of FocicleYFP cells after treatment with different concentrations of 4OHT. White circles indicate six replicates points, and solid magenta line and error bars indicate median ±S.D. Dotted line indicates the median in the absence of 4OHT treatment.
Figure 3
Figure 3
Automated tamoxifen treatment and cell mixing to obtain precise parameters for mathematical models (A) Cell dispensing scheme using the automated liquid-dispensing workstation. Suspensions of YFP+ and FarRed+ cells were dispensed in varying volumes from troughs into a single 96-well glass-bottom plate. (B) Cells were gradually dispensed into 60 (6 × 10) wells with different mixing ratios: 100% (top row) to 0% (bottom row) for YFP+ cells and 100% (bottom row) and 0% (top row) for FarRed+ cells. Media containing tamoxifen (4OHT) at serial dilutions (1:4) were added to the plate. Images captured at the start (t = 0 h) and end (t = 24 h) of the time-lapse imaging are displayed as connected tiling images. Scale bars, 500 μm. (C) Time series (0–24 h) of the number of cells in the images of individual wells obtained from the glass-bottom plate shown in (B). Each title denotes the well position. Cyan and magenta dots represent YFP+ and FarRed+ cells, respectively. (D) Interspecific competition coefficient (b) between FarRed+ (red) and YFP+ cells (green). The arrow and blunt-ended lines represent the direct activation and inhibition of cell-to-cell interactions, respectively, upon growth stimulation. (E) Interspecific competition coefficients between YFP+ and FarRed+ cells under various 4OHT treatments, as speculated by intraspecific competition coefficients under monoculture conditions. (F) Time course of fluorescent intensity of hCdt1(RFP+) per nuclear area in YFP+ cells in the E09 well (gray) or B09 well (Black).
Figure 4
Figure 4
Gene expression under competitive mixed culture containing different genomic stress level (A) Genome stress array using probe-based qRT-PCR. The gene set was chosen from a preliminary screening to correlate autophagy, cell death signaling, and cellular senescence. This array contained two housekeeping (HK) genes (Actb and B2m) and was normalized to Actb expression. The gene expression of YFP+ cells compared to FarRed+ cells was shown in 2ΔΔCt value as mean ± SD of triplicate in one representative experiment. The dotted line indicates no differential expression (1). (B) Schematic of cell passage and total RNA isolation of 4OHT-treated cells. On day 0, YFP+ and FarRed+ cells were mixed equally (2.5E4 cells). On Day 1, the media were exchanged for 4OHT (2.8 nM or 28 nM) or DMSO. Medium exchange was used as a negative control. The cells were passaged every 2 or 3 days for approximately 3 weeks. At passage, the fluorescence distributions of the YFP+/FarRed and YFP/FarRed+ fractions were measured by flow cytometry, and the remaining cells were subcultured in media containing the same drug concentration. On day 9, total RNA was isolated from the YFP+/FarRed and YFP/FarRed+ fractions for qRT-PCR. Illustrations were created with Bioredner.com. (C) Cell growth in the cumulative number of YFP+ and FarRed+ cells from the start of the mixed culture was calculated from the ratio of YFP+ and FarRed+ fractions, measured by flow cytometry. (D) Example of sorted gates for the ratio calculation of YFP+ and FarRed+ cell fractions and total RNA isolation. The image was rebuilt from an FCS file using the FlowJo software. (E) Relative expression of Acta2, Atg16l2, Atg9b, and Map1lc3a genes normalized by Actb in YFP+/FarRed or YFP/FarRed+ fractions were isolated from DMSO, 4OHT (2.8 nM), and 4OHT (28 nM) and expressed as mean ± SD of triplicate in one representative experiment. The 2–ΔΔCt value was calculated using baseline expression of the same fractions isolated from the negative control. ∗p < 0.05, ∗∗p < 0.01, ∗∗∗p < 0.001.

Similar articles

Cited by

References

    1. Shibata A., Jeggo P.A. DNA double-strand break repair in a cellular context. Clin. Oncol. 2014;26:243–249. doi: 10.1016/J.CLON.2014.02.004. - DOI - PubMed
    1. Halazonetis T.D., Gorgoulis V.G., Bartek J. An oncogene-induced DNA damage model for cancer development. Science. 2008;319:1352–1355. doi: 10.1126/SCIENCE.1140735. - DOI - PubMed
    1. Campisi J. Cellular senescence and apoptosis: How cellular responses might influence aging phenotypes. Exp. Gerontol. 2003;38:5–11. doi: 10.1016/S0531-5565(02)00152-3. - DOI - PubMed
    1. Yokoyama A., Kakiuchi N., Yoshizato T., Nannya Y., Suzuki H., Takeuchi Y., Shiozawa Y., Sato Y., Aoki K., Kim S.K., et al. Age-related remodelling of oesophageal epithelia by mutated cancer drivers. Nature. 2019;565:312–317. doi: 10.1038/s41586-018-0811-x. - DOI - PubMed
    1. Martincorena I., Campbell P.J. Somatic mutation in cancer and normal cells. Science. 2015;349:1483–1489. doi: 10.1126/science.aab4082. - DOI - PubMed

LinkOut - more resources