. 2024 Nov 22;27(12):111447.
doi: 10.1016/j.isci.2024.111447. eCollection 2024 Dec 20.

Hyperaminoacidemia from interrupted glucagon signaling increases pancreatic acinar cell proliferation and size via mTORC1 and YAP pathways

Affiliations

Hyperaminoacidemia from interrupted glucagon signaling increases pancreatic acinar cell proliferation and size via mTORC1 and YAP pathways

Chunhua Dai et al. iScience. .

Abstract

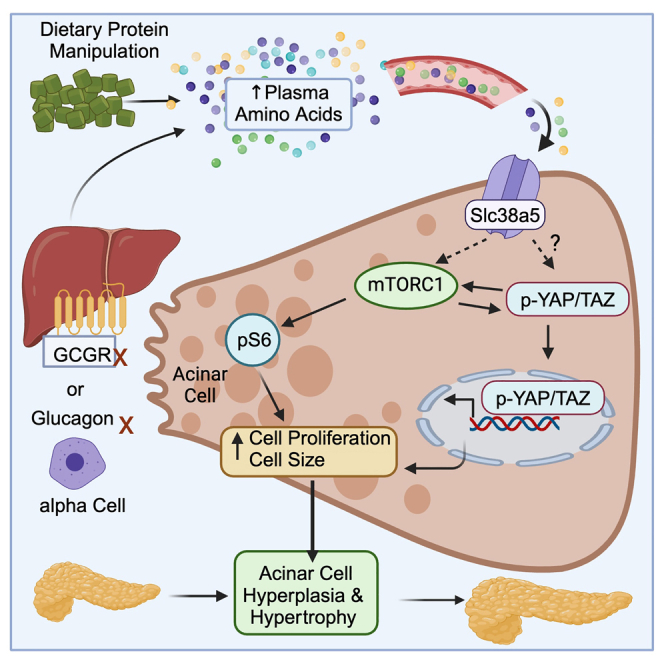
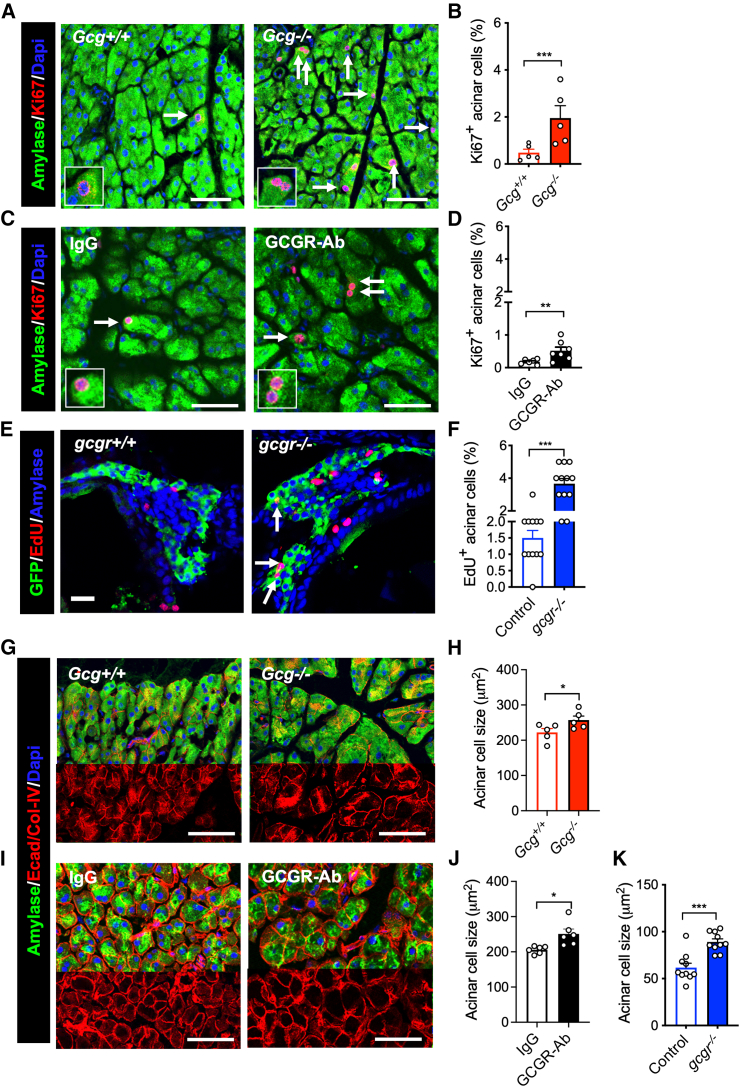
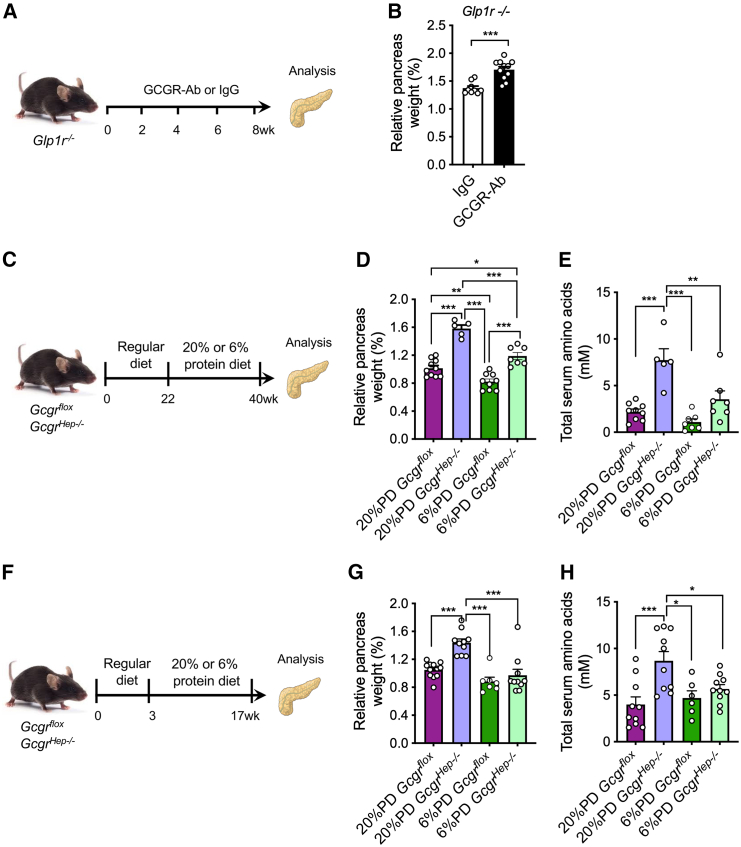
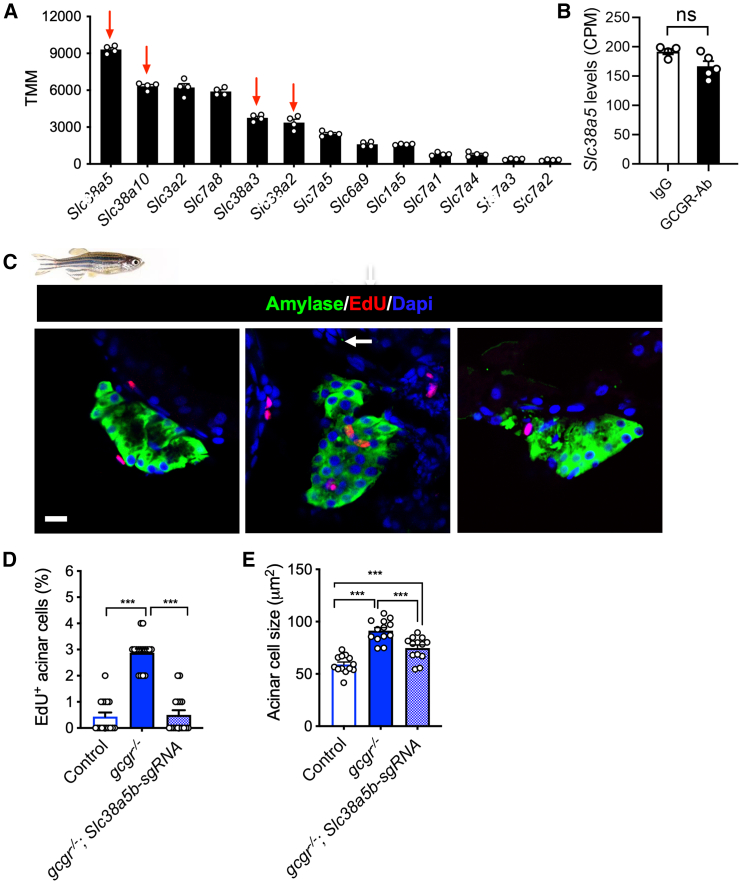
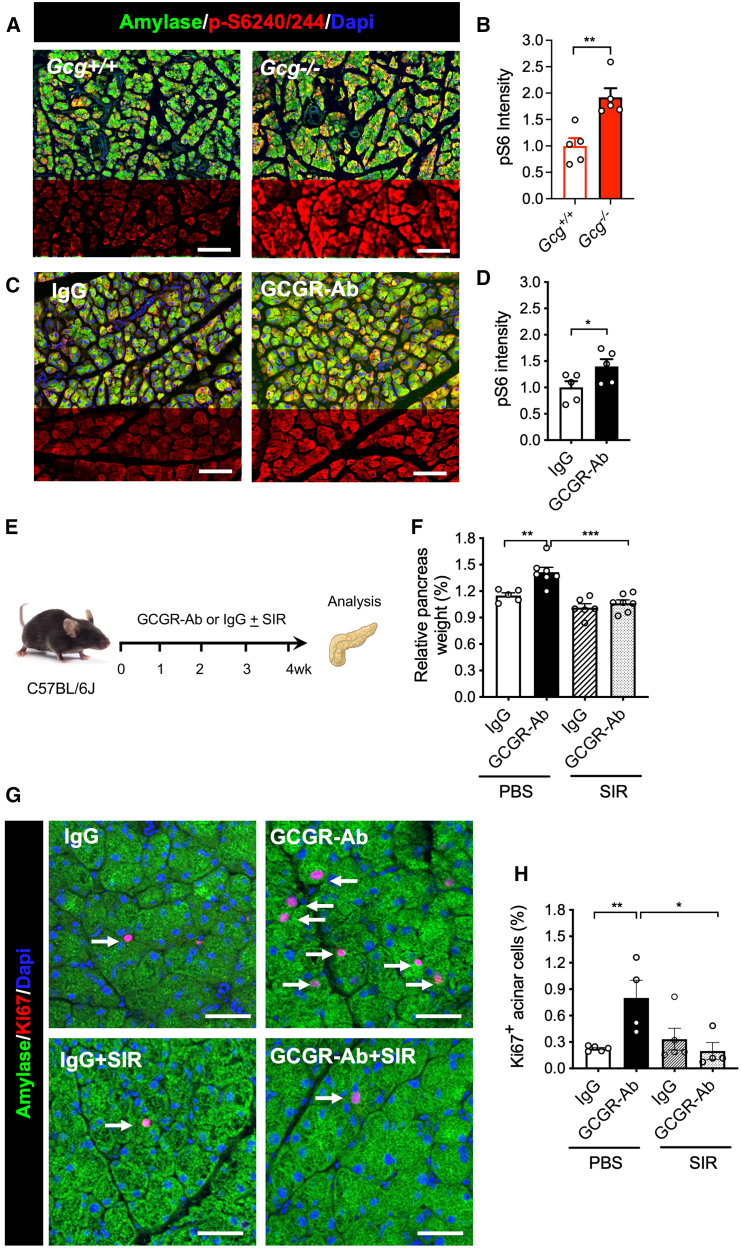
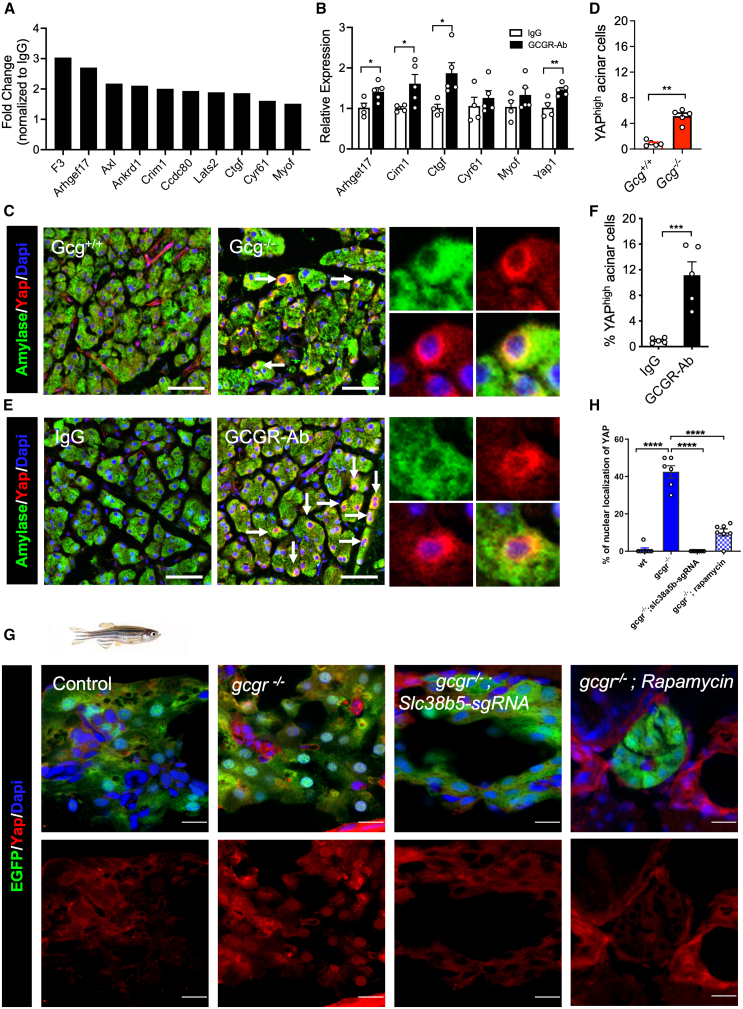
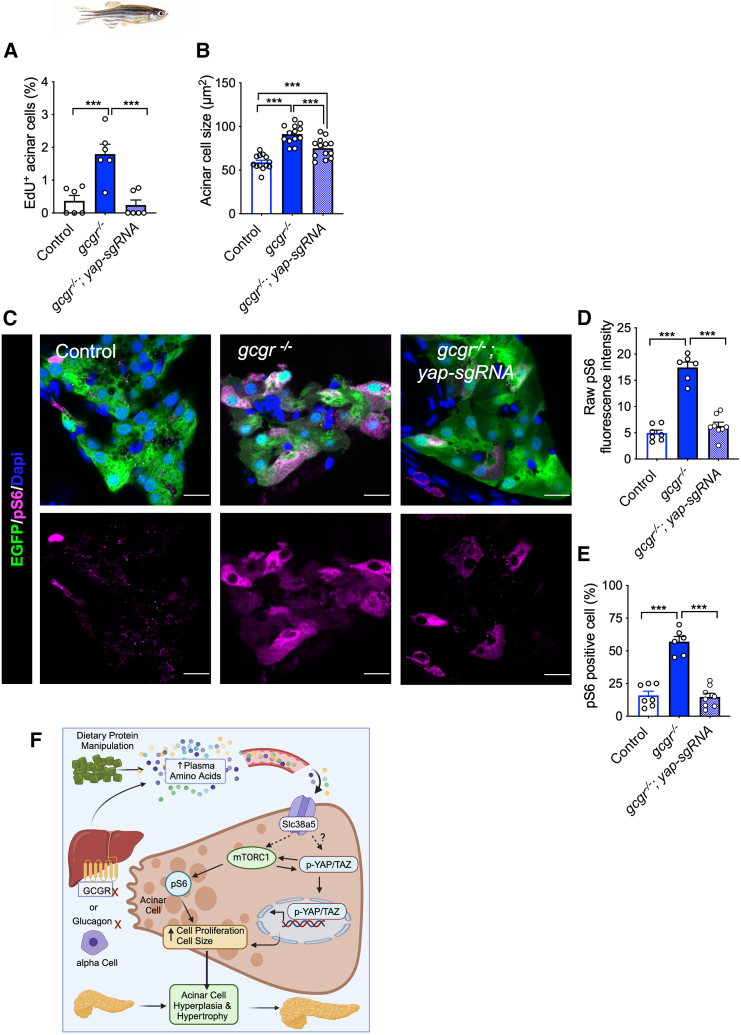
Increased blood amino acid levels (hyperaminoacidemia) stimulate pancreas expansion by unclear mechanisms. Here, by genetic and pharmacological disruption of glucagon receptor (GCGR) in mice and zebrafish, we found that the ensuing hyperaminoacidemia promotes pancreatic acinar cell proliferation and cell hypertrophy, which can be mitigated by a low protein diet in mice. In addition to mammalian target of rapamycin complex 1 (mTORC1) signaling, acinar cell proliferation required slc38a5, the most highly expressed amino acid transporter gene in both species. Transcriptomics data revealed the activation signature of yes-associated protein (YAP) in acinar cells of mice with hyperaminoacidemia, consistent with the observed increase in YAP-expressing acinar cells. Yap1 activation also occurred in acinar cells in gcgr-/- zebrafish, which was reversed by rapamycin. Knocking down yap1 in gcgr-/- zebrafish decreased mTORC1 activity and acinar cell proliferation and hypertrophy. Thus, the study discovered a previously unrecognized role of the YAP/Taz pathway in hyperaminoacidemia-induced acinar cell hypertrophy and hyperplasia.

Keywords: Biomolecules; Cell biology; Model organism; Molecular biology.


Conflict of interest statement

The authors declare no competing interests.

Figures

None
Graphical abstract
Figure 1
Figure 1
IGS increases acinar cell proliferation and cell size (A and C) Representative images of acinar tissue immunofluorescence of amylase (green) and Ki67 (red). DAPI (blue) was used to label the nuclei. The pancreas sections were from Gcg+/+ or Gcg−/− mice (A) or from C57BL/J6 mice treated with IgG or GCGR-Ab (C). (B and D) Quantification of Ki67 positive acinar cell (n = 5–7). Arrows point to Ki67+ cells. (E) Representative immunofluorescent images of pancreas sections from 18 dpf zebrafish. Green (GFP), red (EdU), and blue (Amylase). Arrows, EdU+ acinar cells. (F) Quantification of EdU-positive acinar cells (n = 12). (G and I) Representative images of acinar tissue immunofluorescence of Amylase (Green), E-cadherin, and Collagen (Red). DAPI (blue) was used to label the nuclei. The pancreas sections were from Gcg+/+ or Gcg−/− mice (G) or from C57BL/J6 mice treated with IgG or GCGR-Ab (I). (H and J) Measurements of acinar cell size (by area) in the two mouse models. (K) Average acinar cell size of control and gcgr−/− zebrafish. Each data point is the average of more than 50 cells from one fish. Scale bar, 15 μm in (E). Scale bar, 50 μm in others. Data are represented as mean ± SEM. ∗p < 0.05, ∗∗p < 0.01, ∗∗∗p < 0.001. Student’s t test.
Figure 2
Figure 2
Hyperaminoacidemia, but not GLP-1, contributes to the increased pancreas mass in the GCGR-Ab-treated mice (A) Schematic of experimental design in Glp1r−/− and control mice. (B) Pancreas mass in Glp1r−/− mice treated with IgG or GCGR-Ab (n = 9–11/treatment). ∗∗∗p < 0.001. Student’s t test. (C) Experimental outline depicting the treatment of IGS-induced pancreas expansion by a low protein diet. (D) Relative pancreas weight in Gcgrhep−/− and control mice on 20% or 6% protein diet. (E) Total blood aa in Gcgrhep−/− and control mice on 20% or 6% protein diet. (F) Experimental outline to prevent IGS-induced pancreas expansion. (G) Relative pancreas weight in Gcgrhep−/− and control mice on 20% or 6% protein diet. (H) Total blood aa in Gcgrhep−/− and control mice on 20% or 6% protein diet. Data are represented as mean ± SEM. ∗p < 0.05, ∗∗p < 0.01, ∗∗∗p < 0.001. One-way ANOVA followed by Turkey’s multiple comparisons tests.
Figure 3
Figure 3
Slc38a5 mediates acinar cell growth (A) The top 11 amino acid transporters expressed in mouse acinar cells (n = 5, data from RNA-seq). (B) Slc38a5 expression in acinar cells of IgG and GCGR-Ab treated mice. CPM, count per million. Student’s t test. (C) Representative images of zebrafish pancreas from control, gcgr−/−, and gcgr−/− with slc38a5b knockdown groups. Green, amylase; red, EdU; blue, DAPI. Scale bar, 10 μm. (D) Quantification of EdU+ acinar cells in control, gcgr−/−, and gcgr−/− with slc38a5b knockdown group (n = 16/genotype). (E) Acinar cell size in control, gcgr−/−, and gcgr−/− with slc38a5b knockdown groups. Each data point is the average of more than 50 cells from the same fish. Data are represented as mean ± SEM. ∗p < 0.05, ∗∗p < 0.01, ∗∗∗p < 0.001. One-way ANOVA followed by Turkey’s Multiple Comparisons Test.
Figure 4
Figure 4
IGS activates mTORC1 pathway in acinar cells (A and C) Representative images of pancreas immunofluorescence from the 2 mouse models. Green, amylase; red, phosphor-S6 (240/244); blue, DAPI. (B and D) Quantification of pS6 intensity in Gcg−/− mice (B) or antibody-treated mice (D) and their controls (n = 5/group). The intensity was normalized to control mice or the IgG treatment group. ∗p < 0.05, ∗∗p < 0.01, Student’s t test. (E) Schematic experimental design for treating mice with sirolimus (rapamycin) treatment. (F) Relative pancreas weight in the four groups (n = 5–6/group). (G) Representative immunofluorescence images of acinar tissues. Amylase, green; Ki67, red; DAPI, blue. Arrows point to Ki67+ acinar cells. (H) Quantification of Ki67+ acinar cells in the four groups (n = 5/group). Scale bar, 100 μm (A and C), 50 μm (G). Data are represented as mean ± SEM. ∗p < 0.05, ∗∗p < 0.01, ∗∗∗p < 0.001. One-way ANOVA followed by Turkey’s Multiple Comparisons Test.
Figure 5
Figure 5
IGS activates the YAP/Taz pathway (A) Upregulation of YAP target genes in acinar cells from GCGR-Ab treated mice. Data are from RNA-seq. (B) RT-qPCR analysis of selected YAP target genes in mRNA from the pancreas of IgG and GCGR-Ab treated mice (n = 4–5/group, compared IgG vs. GCGR-Ab each gene). (C and E) Representative immunofluorescence images of YAP (red) in acinar cells (amylase, green) in the two mouse models. Arrows point to a high expression of YAP. Scale bar, 50 μm. (D and F) Quantifications of the percentage of acinar cells with high YAP expression (n = 5/group). p < 0.05, ∗∗p < 0.01, ∗∗∗p < 0.001 Student’s t test. (G) Representative immunofluorescence images of Yap in pancreas sections of WT, gcgr−/−, and gcgr−/− with slc38a5b knockdown, and gcgr−/− with rapamycin treatment. All fish carry Tg(ela3l:EGFP) transgene that labels acinar cells with EGFP (scale bar, 10 μm). The EGFP- cells with high Yap1 signal are likely ductal cells. (H) Quantification of the percentage of acinar cell with nuclear Yap1. n = 7, 6, and 7 for each group, respectively. Data are represented as mean ± SEM. ∗p < 0.05, ∗∗p < 0.01, ∗∗∗p < 0.001. One-way ANOVA followed by Tukey’s multiple comparisons test.
Figure 6
Figure 6
Yap1 is required for mTORC1 activation in gcgr−/− fish (A and B) Quantification of the percentage of EdU-labeled acinar cells and the acinar cell size in the pancreas sections WT, gcgr−/−, and gcgr−/− with yap1 knockdown. (C) Representative immunofluorescence images of pS6(240/244) in pancreas sections. All fish carry the Tg(ela3l:EGFP) transgene that labels acinar cells with EGFP (scale bar, 10 μm). (D) Quantification of raw pS6 signal intensity in acinar cells of these fish. (E) Quantification of the percentage of pS6-positive acinar cells in the pancreas sections. n = 7, 6, 8 for each group). Data are represented as mean ± SEM. ∗p < 0.05, ∗∗p < 0.01, ∗∗∗p < 0.001, ∗∗∗∗p < 0.0001. One-way ANOVA followed by Tukey’s multiple comparisons test. (F) Proposed model of IGS-induced acinar cell hyperplasia and hypertrophy.

Similar articles

References

    1. Pin C.L., Ryan J.F., Mehmood R. Acinar cell reprogramming: a clinically important target in pancreatic disease. Epigenomics. 2015;7:267–281. doi: 10.2217/epi.14.83. - DOI - PubMed
    1. Wollny D., Zhao S., Everlien I., Lun X., Brunken J., Brüne D., Ziebell F., Tabansky I., Weichert W., Marciniak-Czochra A., Martin-Villalba A. Single-Cell Analysis Uncovers Clonal Acinar Cell Heterogeneity in the Adult Pancreas. Dev. Cell. 2016;39:289–301. doi: 10.1016/j.devcel.2016.10.002. - DOI - PubMed
    1. Tosti L., Hang Y., Debnath O., Tiesmeyer S., Trefzer T., Steiger K., Ten F.W., Lukassen S., Ballke S., Kühl A.A., et al. Single-Nucleus and In Situ RNA-Sequencing Reveal Cell Topographies in the Human Pancreas. Gastroenterology. 2021;160:1330–1344.e11. doi: 10.1053/j.gastro.2020.11.010. - DOI - PubMed
    1. Case R.M. Synthesis, intracellular transport and discharge of exportable proteins in the pancreatic acinar cell and other cells. Biol. Rev. Camb. Philos. Soc. 1978;53:211–354. doi: 10.1111/j.1469-185x.1978.tb01437.x. - DOI - PubMed
    1. Logsdon C.D., Ji B. The role of protein synthesis and digestive enzymes in acinar cell injury. Nat. Rev. Gastroenterol. Hepatol. 2013;10:362–370. doi: 10.1038/nrgastro.2013.36. - DOI - PMC - PubMed