. 2025 Apr;30(3-4):693-709.
doi: 10.1007/s10495-024-02049-x. Epub 2024 Dec 25.

PWP1 transcriptionally regulates p53, modulating apoptosis and cell cycle to promote gastric cancer progression

Affiliations

PWP1 transcriptionally regulates p53, modulating apoptosis and cell cycle to promote gastric cancer progression

Mingrui Jiang et al. Apoptosis. 2025 Apr.

Abstract

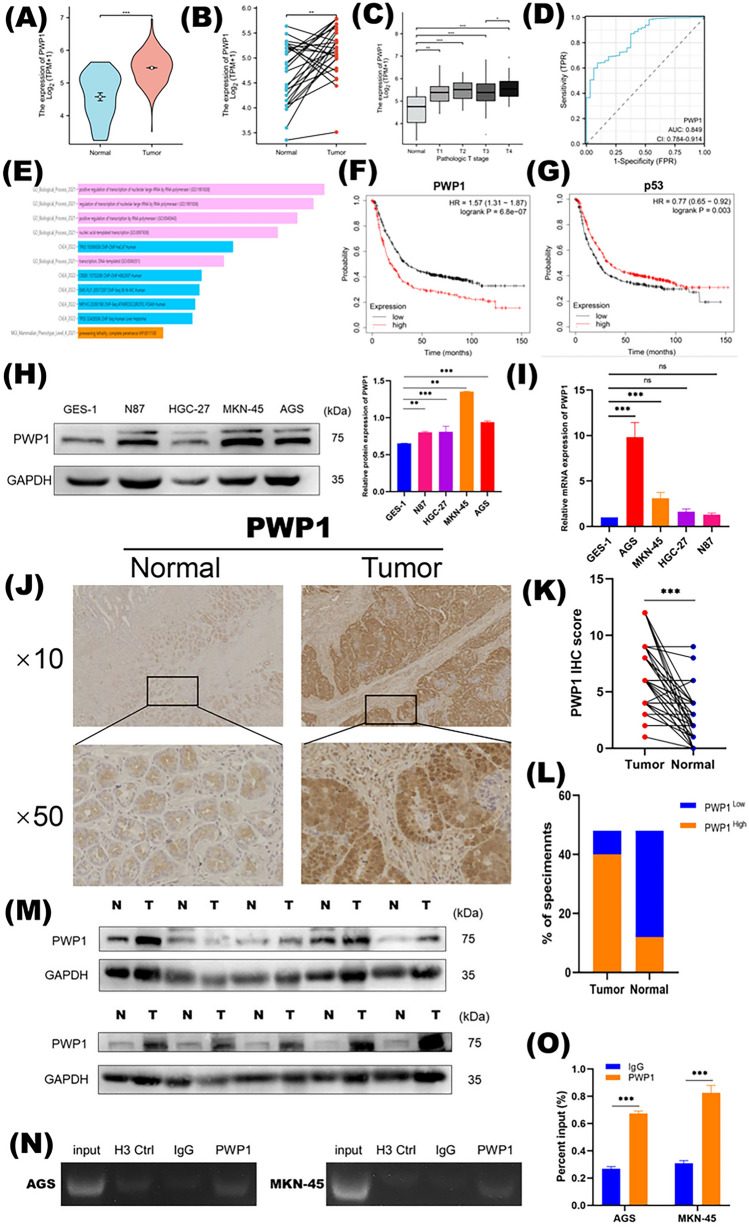
Gastric cancer remains a leading cause of cancer-related mortality worldwide. The prognosis often depends on early detection and understanding the molecular mechanisms involved in its progression. Periodic tryptophan protein 1 (PWP1) has emerged as a novel diagnostic marker, potentially linked to gastric cancer progression. This study aims to elucidate the impact of PWP1 on gastric cancer development, focusing on apoptosis, cell cycle regulation, and the role of p53. This study utilized gastric cancer cell lines to investigate the expression and functional role of Pwp1. Quantitative PCR and Western blot analyses were conducted to measure PWP1 expression levels. Apoptosis was assessed by using flow cytometry and TUNEL assays, and cell cycle analysis was performed to evaluate the impact of PWP1 modulation. Additionally, animal experiments were conducted using mouse models injected with gastric cancer cells, with PWP1 knockdown or overexpression, to observe tumor growth and progression. Statistical significance was evaluated using t-tests and ANOVA where appropriate. Elevated PWP1 expression was observed in gastric cancer tissues compared to normal tissues. PWP1's knockdown resulted in increased apoptosis and cell cycle arrest at the G1 phase, suggesting its role in promoting invasion and proliferation. Furthermore, animal experiments demonstrated reduced tumor growth in mice with PWP1 knockdown. PWP1 was found to transcriptionally regulate p53, affecting its expression and thereby influencing apoptosis and cell cycle pathways in gastric cancer. Our study identifies PWP1 as a novel oncogene frequently overexpressed in gastric cancer (GC). Through transcriptional regulation of p53, PWP1 enhances cell growth by influencing apoptosis and inducing G1 phase cell cycle arrest. These findings underscore PWP1 as a promising therapeutic target for treating GC, suggesting its potential for future clinical applications.

Keywords: Apoptosis; Cell cycle; Gastric cancer; PWP1; p53.


Conflict of interest statement

Declarations. Conflict of interests: The authors declare no conflict of interest. Ethics approval and consent to participate: Approval of the research protocol by the Ethics Committee of North Jiangsu People’s Hospital with the ethics number 2020KY-137. All institutional and national guidelines for the care and use of laboratory animals were followed. And approved by Yangzhou University (NO.202307001). Consent for publication: Not applicable.

Figures

Fig. 1
Fig. 1
PWP1 is highly expressed in gastric cancer and its transcription factor binds to the p53 promoter region. a PWP1 unpaired expression determined based on TCGA database, b paired expression, and c clinical significance. d Receiver Operating Characteristic (ROC) analysis of PWP1. e Enrichment analysis of PWP1 based on the Enrichr-kg database. Kaplan–Meier survival curves of f PWP1 and p53 obtained from Kaplan–Meier Plotter. g Western blot showing the expression of PWP1 in human gastric mucosal epithelial cells (GES-1) and gastric cancer cell lines. h RT-qPCR detection of PWP1 mRNA levels in GES-1 and GC cell lines. i Representative IHC staining images of PWP1 in GC tissue microarrays. j Paired t-test showing immunohistochemistry results. k Statistical analysis of PWP1 expression in GC and adjacent normal tissues. The final score is the product of staining area and intensity. High expression is defined as a final score ≥ 5, low expression as a final score of 0–4. l PWP1 protein expression levels in 10 matched GC samples detected by Western blot (N, normal adjacent tissue; T, tumor tissue). m Chromatin immunoprecipitation (ChIP) assay detecting PWP1 binding to the p53 promoter in AGS and MKN-45 cells. IgG served as a negative control. n ChIP-qPCR results further confirming PWP1 binding to the p53 promoter. * p < 0.05, ** p < 0.01, and *** p < 0.001. NS means statistically insignificant
Fig. 2
Fig. 2
PWP1 knockdown increases p53 expression in vitro, inhibits malignant phenotypes of GC cells, and affects the PI3K/Akt/mTOR signaling pathway. A–d qRT-PCR and Western blot analyses confirm the efficiency of PWP1 knockdown in AGS and MKN-45 cells and significantly increased p53 expression. e, f Scratch assay results showing significantly reduced migration rates in sh-PWP1 groups of AGS and MKN-45 cells compared to NC groups. g, h Transwell assay results showing significantly reduced invasion rates in sh-PWP1 groups of AGS and MKN-45 cells compared to NC groups. i–l CCK8 and colony formation assay results showing significantly reduced proliferation rates in cells with PWP1 knockdown compared to control groups. m, n PWP1 knockdown significantly reduced pPI3K, pAKT, pmTOR, and MDM2 proteins in the PI3K/Akt/mTOR pathway in AGS and MKN-45 cells. * p < 0.05, ** p < 0.01, and *** p < 0.001. NS means statistically insignificant
Fig. 3
Fig. 3
PWP1 overexpression decreases p53 expression in vitro, promotes malignant phenotypes of GC cells, and affects the PI3K/Akt/mTOR signaling pathway. a–d qRT-PCR and Western blot analyses confirm the efficiency of PWP1 overexpression in AGS and MKN-45 cells and significantly decreased p53 expression. e, f Scratch assay results showing significantly increased migration rates in oe-PWP1 groups of AGS and MKN-45 cells compared to NC groups. g, h Transwell assay results showing significantly increased invasion rates in oe-PWP1 groups of AGS and MKN-45 cells compared to NC groups. i–l Colony formation and CCK8 assay results showing significantly increased proliferation rates in cells with PWP1 overexpression compared to control groups. m, n PWP1 overexpression significantly increased pPI3K, pAKT, pmTOR, and MDM2 proteins in the PI3K/Akt/mTOR pathway in AGS and MKN-45 cells. * p < 0.05, ** p < 0.01, and *** p < 0.001. NS means statistically insignificant
Fig. 4
Fig. 4
PWP1 regulates p53 through proliferation and invasion of gastric cancer cells. ad qRT-PCR and Western blot analyses confirm that p53 expression almost returned to initial levels in PWP1-knockdown AGS and MKN-45 cells after p53 knockdown, while PWP1 expression was unaffected by p53 knockdown. e, f Scratch assay results showing increased migration rates in AGS and MKN-45 cells after p53 knockdown compared to NC groups, while the migration rates almost returned to initial levels in cells with continued PWP1 knockdown. g, h Transwell assay results showing that PWP1 knockdown reversed the increased invasion rates caused by p53 knockdown in AGS and MKN-45 cells. il Colony formation and CCK8 assay results showing that PWP1 knockdown reversed the increased proliferation rates caused by p53 knockdown in AGS and MKN-45 cells. m, n Western blot results of markers in GC cells transfected with LV NC, LV sh-p53, or LV sh-p53 + LV sh-PWP1. * p < 0.05, ** p < 0.01, and *** p < 0.001. NS means statistically insignificant
Fig. 5
Fig. 5
PWP1 regulates proliferation and invasion of gastric cancer cells via p53. a–d qRT-PCR and Western blot analyses confirm that p53 expression almost returned to initial levels in PWP1-overexpressing AGS and MKN-45 cells after p53 overexpression, while PWP1 expression was unaffected by p53 knockdown. e, f Scratch assay results showing decreased migration rates in AGS and MKN-45 cells after p53 overexpression compared to NC groups, while the migration rates almost returned to initial levels in cells with continued PWP1 overexpression. g, h Transwell assay results showing that PWP1 overexpression reversed the decreased invasion rates caused by p53 overexpression in AGS and MKN-45 cells. i–l Colony formation and CCK8 assay results showing that PWP1 overexpression reversed the decreased proliferation rates caused by p53 overexpression in AGS and MKN-45 cells. m, n Western blot results of markers in GC cells transfected with LV NC, LV oe-p53, or LV oe-p53 + LV oe-PWP1. * p < 0.05, ** p < 0.01, and *** p < 0.001. NS means statistically insignificant
Fig. 6
Fig. 6
Mechanisms of PWP1 regulation of apoptosis in gastric cancer cells. a Flow cytometry analysis showing increased apoptosis rates in GC cells with PWP1 knockdown compared to NC groups. b TUNEL staining (blue fluorescence, DAPI staining; red fluorescence, TUNEL staining) analysis showing the effect of PWP1 knockdown on apoptosis in GC cells. c, d Effects of PWP1 knockdown on apoptosis-related proteins such as PARP, cleaved PARP, caspase-3, cleaved caspase-3, caspase-9, cleaved caspase-9, Bax, and bcl-2 in GC cells. e Flow cytometry analysis showing decreased apoptosis rates in GC cells with PWP1 overexpression compared to NC groups. f TUNEL staining showing inhibition of apoptosis in GC cells with PWP1 overexpression. G, H Effects of PWP1 overexpression on apoptosis-related proteins in GC cells. i, j Flow cytometry and TUNEL staining results showing that PWP1 knockdown reversed the decreased apoptosis rates caused by p53 knockdown in GC cells. k, l Western blot results of apoptosis-related markers in GC cells transfected with LV NC, LV sh-p53, or LV sh-p53 + LV sh-PWP1. m, n Flow cytometry and TUNEL staining results showing that PWP1 overexpression reversed the increased apoptosis rates caused by p53 overexpression in GC cells. o, p Western blot results of apoptosis-related markers in GC cells transfected with LV NC, LV oe-p53, or LV oe-p53 + LV oe-PWP1. * p < 0.05, ** p < 0.01, and *** p < 0.001. NS means statistically insignificant
Fig. 7
Fig. 7
Mechanisms of PWP1 regulation of the cell cycle in gastric cancer cells. a Flow cytometry analysis of the cell cycle using PI staining in GC cells showing an increased proportion of cells in the G0/G1 phase with PWP1 knockdown compared to NC groups. be Effects of PWP1 knockdown on G1 checkpoint regulators such as CDK2, CDK4, CDK6, cyclin D1, cyclin E2, and p21 in GC cells. (f) Flow cytometry analysis showing a decreased proportion of cells in the G0/G1 phase with PWP1 overexpression compared to NC groups. gj Effects of PWP1 overexpression on G1 checkpoint regulators in GC cells. l PWP1 knockdown reversed the decreased proportion of cells in the G0/G1 phase caused by p53 knockdown in GC cells. lo Western blot results of G1 checkpoint regulators in GC cells transfected with LV NC, LV sh-p53, or LV sh-p53 + LV sh-PWP1. p PWP1 overexpression reversed the decreased proportion of cells in the G0/G1 phase caused by p53 overexpression in GC cells. qt Western blot results of G1 checkpoint regulators in GC cells transfected with LV NC, LV oe-p53, or LV oe-p53 + LV oe-PWP1. * p < 0.05, ** p < 0.01, and *** p < 0.001. NS means statistically insignificant
Fig. 8
Fig. 8
PWP1 Enhances Gastric Cancer Tumorigenesis In Vivo. a Subcutaneous injection of 5 million MKN-45 cells from the NC group, sh-PWP1 group, or oe-PWP1 group into BALB/c nude mice to establish xenograft models. Representative images of dissected xenograft tumors from each group at the end of the experiment. b, c Tumor weight and tumor volume growth curves of subcutaneous xenograft tumors in each group. d, e TUNEL staining of tumor sections showing apoptotic cells. f–h Overexpression of PWP1 reversed the tumor growth inhibition caused by p53 overexpression in mice. jl PWP1 knockdown reversed the accelerated tumor growth caused by p53 knockdown in mice. i, m TUNEL staining showing apoptotic cells in tumor tissues from each group. * p < 0.05, ** p < 0.01, and *** p < 0.001. NS means statistically insignificant

Similar articles

Cited by

References

    1. Bray F, Ferlay J, Soerjomataram I, Siegel RL, Torre LA, Jemal A (2018) Global cancer statistics 2018: GLOBOCAN estimates of incidence and mortality worldwide for 36 cancers in 185 countries. CA Cancer J Clin 68(6):394–424 - PubMed
    1. Smyth EC, Nilsson M, Grabsch HI, van Grieken NCT, Lordick F (2020) Gastric cancer. Lancet 396(10251):635–648 - PubMed
    1. Reed JC (1999) Mechanisms of apoptosis avoidance in cancer. Curr Opin Oncol 11(1):68–75 - PubMed
    1. Sherr CJ (1996) Cancer cell cycles. Science 274(5293):1672–1677 - PubMed
    1. Vousden KH, Lane DP (2007) p53 in health and disease. Nat Rev Mol Cell Biol 8(4):275–283 - PubMed

Publication types

Substances