. 2025 Feb;12(7):e2407064.
doi: 10.1002/advs.202407064. Epub 2024 Dec 25.

Lactylation of Histone H3k18 and Egr1 Promotes Endothelial Glycocalyx Degradation in Sepsis-Induced Acute Lung Injury

Affiliations

Lactylation of Histone H3k18 and Egr1 Promotes Endothelial Glycocalyx Degradation in Sepsis-Induced Acute Lung Injury

Zongqing Lu et al. Adv Sci (Weinh). 2025 Feb.

Abstract

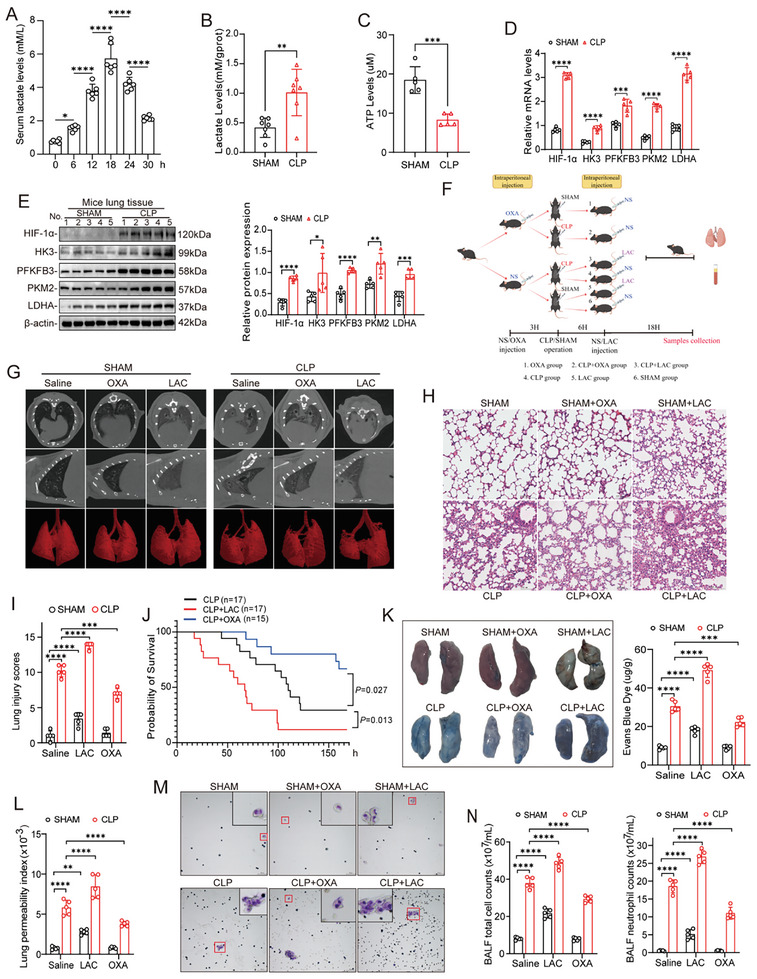
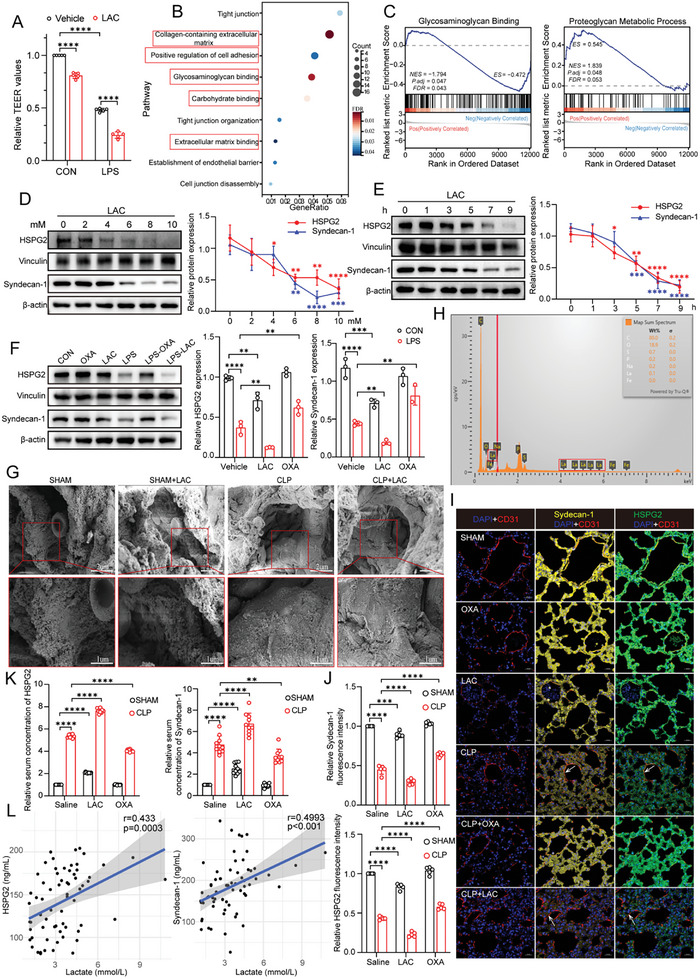
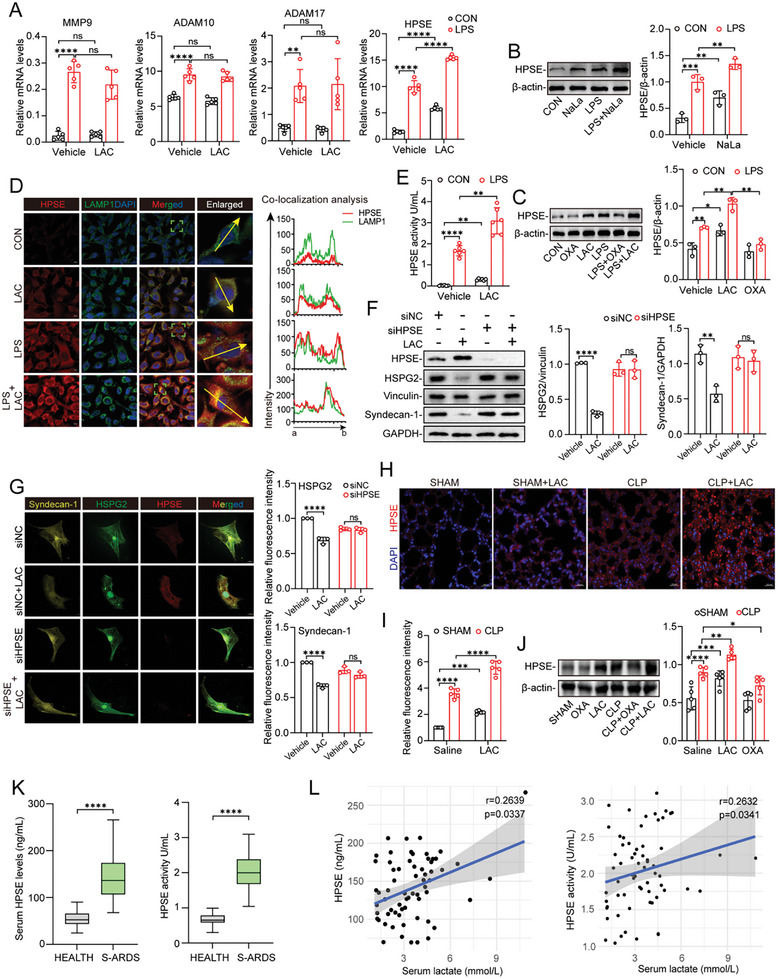
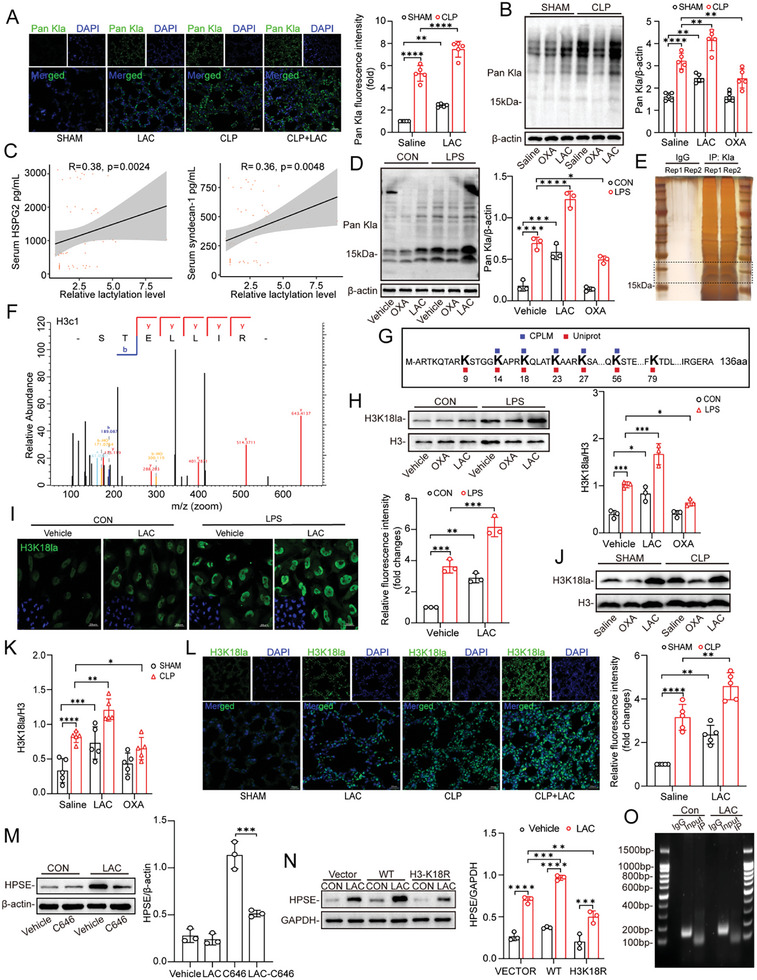
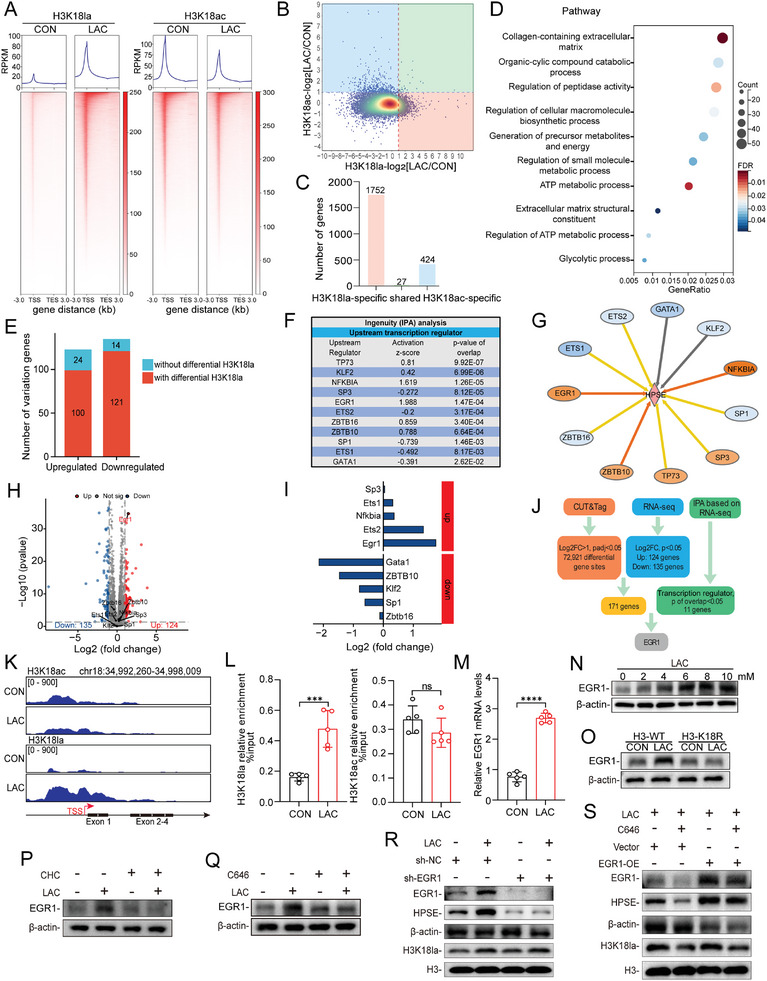
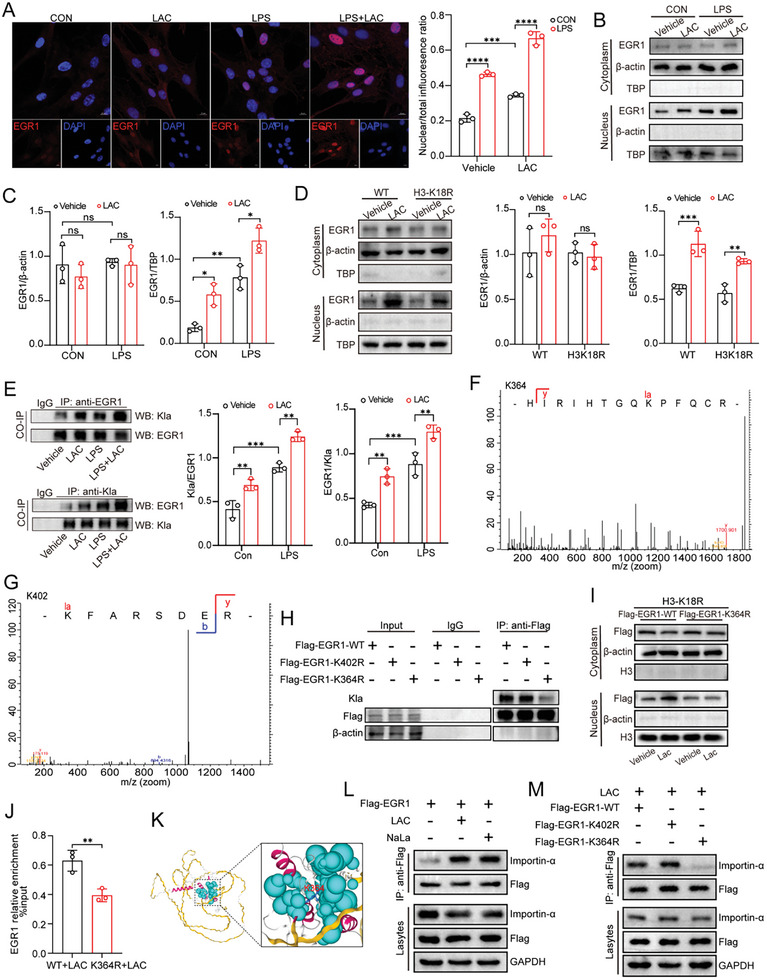
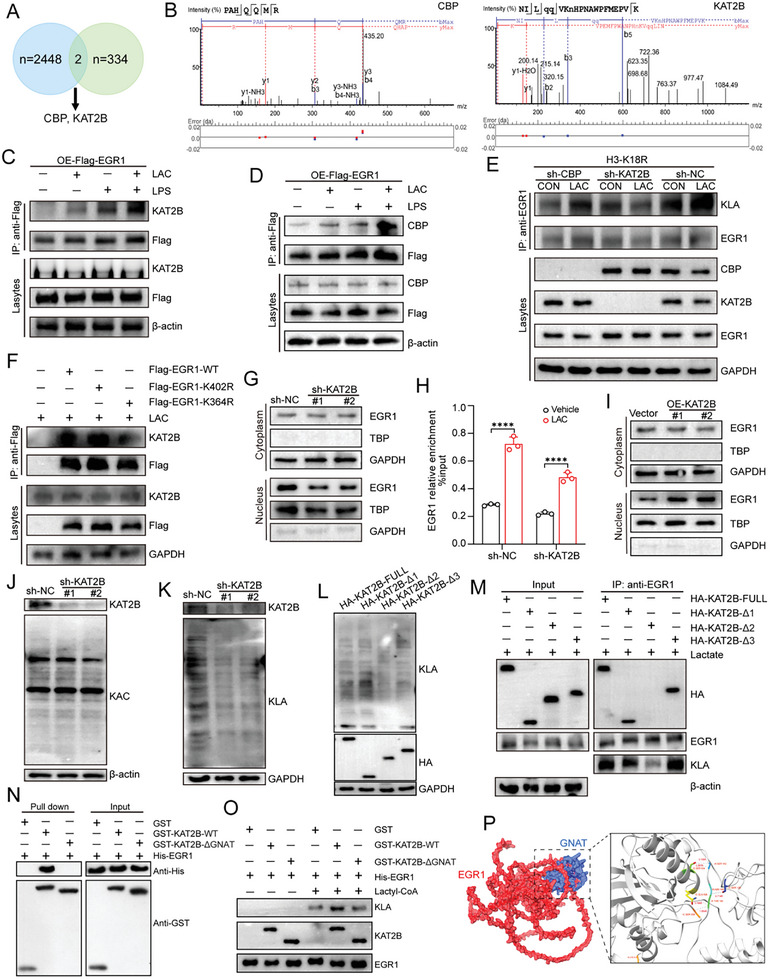
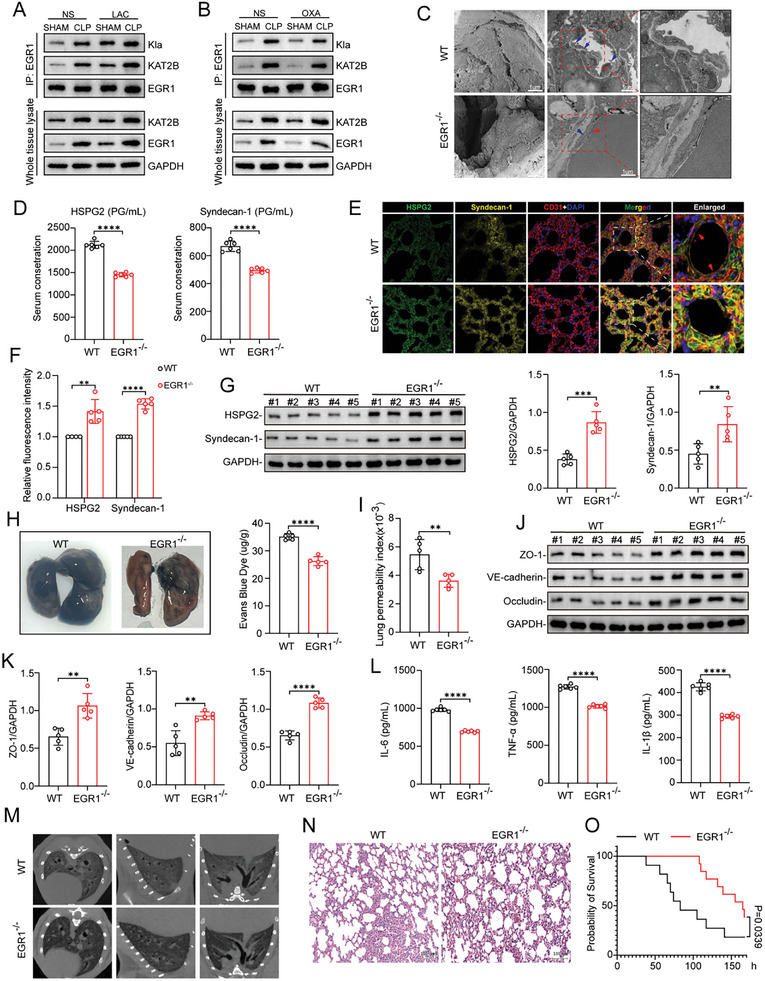
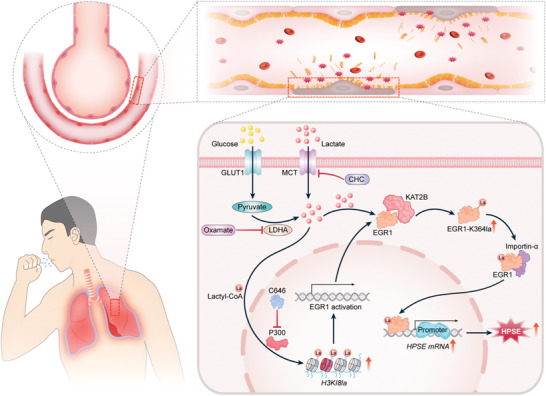
Circulating lactate is a critical biomarker for sepsis-induced acute lung injury (S-ALI) and is strongly associated with poor prognosis. However, whether elevated lactate directly promotes S-ALI and the specific mechanism involved remain unclear. Here, this work shows that lactate causes pulmonary endothelial glycocalyx degradation and worsens ALI during sepsis. Mechanistically, lactate increases the lactylation of K18 of histone H3, which is enriched at the promoter of EGR1 and promotes its transcription, leading to upregulation of heparanase in pulmonary microvascular endothelial cells. In addition, multiple lactylation sites are identified in EGR1, and lactylation is confirmed to occur mainly at K364. K364 lactylation of EGR1 facilitates its interaction with importin-α, in turn promoting its nuclear localization. Importantly, this work identifies KAT2B as a novel lactyltransferase whose GNAT domain directly mediates the lactylation of EGR1 during S-ALI. In vivo, suppression of lactate production or genetic knockout of EGR1 mitigated glycocalyx degradation and ALI and improved survival outcomes in mice with polymicrobial sepsis. Therefore, this study reveals that the crosstalk between metabolic reprogramming in endothelial cells and epigenetic modifications plays a critical role in the pathological processes of S-ALI.

Keywords: EGR1; KAT2B; glycocalyx degradation; lactylation; sepsis‐induced acute lung injury.


Conflict of interest statement

The authors declare no conflict of interest.

Figures

Figure 1
Figure 1
Lactate promotes ALI and pulmonary vascular permeability in mice with polymicrobial sepsis. A) Changes in serum L‐lactic acid levels in mice at various time points after CLP surgery (n = 6 mice per group). B) The lung tissue L‐lactic acid levels in mice 24 h after Sham/CLP surgery (n = 6 mice per group). C) The lung tissue ATP levels in mice 24 h after Sham/CLP surgery (n = 5 mice per group). D,E) The transcription and protein levels of the key enzymes of glycolytic pathway in lung tissue 24 h after Sham/CLP surgery (n = 5 mice per group). F) Diagram of animal experimental procedures. G) Detailed images of pulmonary inflammation were derived with Micro‐CT and 3D reconstruction, in which defect site represent the exudative lesions and consolidation. H) Haematoxylin‐eosin (HE) staining of the lung tissue sections and I) lung injury scores following CLP induced sepsis (n = 5 mice per group). Scale bar, 100 µm. J) Survival rates among CLP (n = 17), CLP+LAC (n = 17), and CLP+OXA (n = 15) group were compared by Kaplan‐Meier test. K) Evaluation of pulmonary vascular leakages using Evans blue tracer. Leakage degree was quantified by detecting the Evans blue dye contents in lung homogenate. L) Calculating the lung permeability index in each group by the following equation: protein content of bronchoalveolar lavage fluid (BALF)/protein content in the plasma (n = 5 mice per group). M) Modified Wright‐Giemsa staining of BALF precipitates. The red boxes show the neutrophils. Scale bar, 50 µm. N) The counts of total cells and neutrophils in BALF of each group. All data were represented as the means ± SD, *p < 0.05, **p < 0.01, ***p < 0.001, and ****p < 0.0001; ns, not significant.
Figure 2
Figure 2
Lactate exacerbates glycocalyx degradation on MPMVECs and in vivo during sepsis. A) Effects of LPS (12 ug mL−1 for 12 h), lactate (8 mM for 7 h), and LPS+lactate on the trans‐endothelial electrical resistance (TEER) of MPMVECs (n = 5). B) Kyoto Encyclopedia of Genes and Genomes (KEGG) pathway analysis of differential genes based on transcriptome sequencing analysis of mRNA expressions in MPMVECs after lactate treatment. C) Gene Set Enrichment Analysis of whole transcriptome differential expression genes in MPMVECs after lactate treatment. D) The effects of different concentrations of lactate on the expression of HSPG2 and syndecan‐1 in MPMVECs (n = 3). E) The effects of different treatment times of lactate on the expression of HSPG2 and syndecan‐1 in MPMVECs (n = 3). F) MPMVECs were pre‐treated with OXA (20 mM for 3 h) or PBS, followed stimulated by LPS (12 ug mL−1 for 12 h), lactate (8 mM for 7 h) or both. HSPG2 and syndecan‐1 were detected by Western blot (n = 3). G) SEM imaging of the glycocalyx structure on the surface of pulmonary vascular in vivo using tracer lanthanum staining after lactate administration in Sham and CLP groups. Scale bar, 2 µm. H) Detection of the elements of the glycocalyx structure by energy‐dispersive X‐ray spectroscopy. I,J) Representative immunofluorescent staining images of HSPG2 (green) and syndecan‐1 (yellow) in endothelial surface of the lung tissues. Endothelial surface were stained with CD31 (red), and nuclei were stained with DAPI (blue). Scale bar, 20 µm; J) quantification of fluorescence intensity was analyzed by ImageJ (n = 5 per group). K) Relative serum concentration of HSPG2 and syndecan‐1 after lactate or OXA administration in Sham and CLP group (n = 10 per group). L) Correlation analysis of serum HSPG2, syndecan‐1 and blood lactate levels in S‐ARDS patients. All data were represented as the means ± SD, *p < 0.05, **p < 0.01, ***p < 0.001, and ****p < 0.0001; ns, not significant.
Figure 3
Figure 3
Lactate promotes glycocalyx degradation by increasing the expression of HPSE. A) RT‐qPCR was used to detect the MMP9, ADAM10, ADAM17, and HPSE mRNA level of MPMVECs after lactate (8 mM for 7 h) treatment, respectively (n = 5). B) The effect of NaLa (8 mM for 7 h) on the expression of HPSE in MPMVECs (n = 3). C) MPMVECs were pre‐treated with OXA (20 mM for 3 h) or PBS, followed stimulated by LPS (12 ug mL−1 for 12 h), lactate (8 mM for 7 h) or both. HPSE was detected by Western blot (n = 3). D) MPMVECs were treated with LPS (12 ug mL−1 for 12 h), lactate (8 mM for 7 h), or both. HPSE (red) and LAMP1 (green) co‐localization was examined by confocal microscope (scale bar, 10um). Nucleus was indicated by DAPI (blue) staining. Co‐localization analysis was performed by ImageJ. Scale bar, 10 µm. E) The levels of HPSE activity in MPMVECs after lactate treatment (8 mM for 7 h) (n = 6). F) MPMVECs were transfected with siRNAs for HPSE and scramble control siRNA before 8 mM lactate stimulation for 7 h, the expression levels of HSPG2, syndecan‐1, and HPSE were detected by Western blot (n = 3). G) HSPG2 (green), syndecan‐1 (yellow), and HPSE (red) immunofluorescence staining in the MPMVECs transfected with si‐NC or si‐HPSE after lactate (8 mM for 7 h) stimulation. Scale bar, 10 µm (n = 3). H) Immunofluorescence and I) relative intensity quantification of HPSE of mice lung tissue sections. Scale bar, 20 µm (n = 5). J) The expression levels of HPSE in lung tissue in different groups (n = 5). K) Comparation of serum HPSE concentration and activity between health individuals and S‐ARDS patients. L) Correlation analysis of serum HPSE concentration and activity with blood lactate levels in S‐ARDS patients. All data were represented as the means±SD, *p < 0.05, **p < 0.01, ***p < 0.001, and ****p < 0.0001; ns, not significant.
Figure 4
Figure 4
Global lactylation and H3K18la levels in the lung are increased during sepsis. A) Representative immunofluorescent staining images of Pan Kla (green) of the mice lung tissue sections and the nuclei were stained with DAPI (blue), Scale bar, 20 µm. Quantification of fluorescence intensity was analyzed by ImageJ (n = 5). B) The Pan Kla immunoblots of lung tissue in different groups (n = 5). C) Correlation analysis of serum HSPG2 and syndecan‐1 concentrations with relative lactylation levels in lung tissue. Relative lactylation levels were measured by Western blot. D) The Pan Kla immunoblots of MPMVECs (n = 3). E) Silver stained SDS‐PAGE of lactylated proteins in MPMVECs after immunoprecipitation assay with anti‐Pan Kla antibody. F) Silver staining‐mass spectrometry (MS) of the band between 15–25 kDa in SDS‐PAGE. G) Lactylation sites on Histone H3 were predicted on CPLM (http://cplm.biocuckoo.cn/index.php) and Uniprot (https://www.uniprot.org/). H) The protein levels of H3K18la in MPMVECs after pre‐treated with OXA (20 mM for 3 h) or PBS, followed stimulated by LPS (12 ug mL−1 for 12 h), lactate (8 mM for 7 h) or both (n = 3). I) Immunofluorescence and relative intensity quantification of H3K18la (green) in MPMVECs after treatment with LPS (12 ug mL−1 for 12 h), lactate (8 mM for 7 h), or both. Scale bar, 20 µm (n = 3). J,K) Expression levels of H3K18la in mice lung tissue of different groups (n = 5). L) Immunofluorescence and relative intensity quantification of H3K18la (green) of mice lung tissue sections in different groups. Scale bar, 20 µm (n = 5). M) The effect of pre‐treated C646 (5uM) for 3 h on the protein expression of HPSE in MPMVECs (n = 3). N) Expression levels of HPSE in control vector, H3‐WT, and H3‐K18R overexpressed MPMVECs after lactate stimulation or not (n = 3). O) ChIP‐PCR assay were used to detect the enrichment of H3K18la at the promoter region of HPSE after lactate stimulation (8 mM) or not. All data were represented as the means±SD, *p < 0.05, **p < 0.01, ***p < 0.001, and ****p < 0.0001; ns, not significant.
Figure 5
Figure 5
H3K18la enhances the expression of HPSE by increasing the activation of EGR1. A) Heatmaps for genomic occupancy of H3K18la and H3K18ac±3kb flanking transcription start site in MPMVECs after be stimulated with 8 mM lactate for 7h. Color depth indicates the relative number of reads, genes with similar distribution patterns are clustered together through a clustering algorithm to show the binding trends of lactylation modifications on all genes. B) Scatterplot and C) bar plot showing genes with promoters marked by increases in only H3K18la (H3K18la log2[LAC/CON] ≧ 1 and H3K18ac log2[LAC/CON] < 1; H3K18la‐specific genes), increases in both H3K18la and H3K18ac (H3K18la log2[LAC/CON] ≧ 1 and H3K18ac log2[LAC/CON] ≧ 1; shared genes), or increases in only H3K18ac (H3K18la log2[LAC/CON] < 1 and H3K18ac log2[LAC/CON] ≧ 1; H3K18ac‐specific genes). D) KEGG pathway analysis of genes bound by H3K18la in MPMVECs. E) Bar graph indicating the number of up‐regulated and down‐regulated genes with or without differential H3K18la modification. F) Potential transcription factors of HPSE by ingenuity pathway analysis based on RNA‐seq. G) An upstream regulatory network diagram shows the interactions between HPSE and its directly related up‐stream transcription factors. The different colors in the ellipses indicate the expression of genes in the transcriptome. Red ellipses indicate up‐regulated genes, and green ellipses indicate downregulated genes. The orange and gray line indicate the expression state with consistent activation or suppression between the upstream regulator and the gene, respectively, while the yellow line indicates the expression state with inconsistent activation between the upstream regulator and the gene. H) Volcano plot shows the distribution of the potential up‐stream transcription factors of HPSE in MPMVECs after lactate treatment. I) Rank of the potential up‐stream transcription factors of HPSE based on their H3K18la modifications degree. J) Bioinformatics analysis filtered EGR1 as a downstream target of H3K18la. K) IGV tracks for EGR1 from CUT&Tag analysis. L) ChIP‐qPCR assays of H3K18la and H3K18ac occupancy rates in the promoter region of EGR1 after lactate treatment (n = 5). M) RT‐qPCR was used to detect the EGR1 mRNA level in MPMVECs after lactate (8 mM for 7 h) treatment (n = 5). N) The effect of different concentrations of lactate on the EGR1 expression in MPMVECs. O) Expression levels of EGR1 in the K18R site mutation or wild‐type histone H3 overexpressed MPMVECs after 8 mM lactate treatment for 7h. P) MPMVECs were pre‐treated with 3 mM CHC for 1 h, and further stimulated with 8 mM lactate for 7h. The expression of EGR1 in cells was detected by Western blot. Q) MPMVECs were pre‐treated with 5uM C646 for 3 h, and further stimulated with 8 mM lactate for 7h. The expression of EGR1 in cells was detected by Western blot. R) Western blot assay showed that EGR1 knockdown reversed the up‐regulation of HPSE induced by increased H3K18la after 8 mM lactate treatment. S) Overexpression of EGR1 attenuated the effect of C646 on HPSE expression. All data were represented as the means±SD, *p < 0.05, **p < 0.01, ***p < 0.001, and ****p < 0.0001; ns, not significant.
Figure 6
Figure 6
Lactate increases EGR1 binding to Importin‐α via K364la, in turn facilitating EGR1 nuclear localization A) Immunofluorescence of EGR1 (red) in MPMVECs after treatment with LPS (12 ug mL−1 for 12 h), lactate (8 mM for 7 h), or both. Nuclei were stained with DAPI (blue). Scale bar, 10 µm (n = 3). B‐C) After MPMVECs be treated with LPS (12 ug mL−1 for 12 h), lactate (8 mM for 7 h), or both, the cytoplasmic and nuclear EGR1 expression was measured by Western blot (n = 3). D) Cytoplasmic and nuclear EGR1 expression was measured in MPMVECs expressing H3‐WT or the K18R mutant after lactate (8 mM for 7 h) stimulation by Western blot (n = 3). E) Immunoprecipitation (IP) was performed to examine lactylation of EGR1 in MPMVECs after treatment with LPS (12 ug mL−1 for 12 h), lactate (8 mM for 7 h), or both (n = 3). F,G) Illustration of possible lactylation sites of EGR1 in the MPMVECs analyzed via IP‐LC‐MS/MS. Two possible lactylation sites of EGR1 observed are shown. H) K364R, K402R, or wild‐type Flag‐EGR1 overexpressed MPMVECs were constructed respectively through overexpression plasmid. Flag‐EGR1 proteins were pulled down by Flag antibody and detected with anti‐Pan Kla antibody. I) The effect of lactate treatment (8 mM for 7 h) on Flag‐EGR1 protein distribution after overexpressed Flag‐EGR1‐WT and Flag‐EGR1‐K364R in cells expressing the H3‐K18R mutant. J) ChIP‐qPCR assays of EGR1 occupancy rates in the promoter region of HPSE after K364R mutation (n = 3). K) Ribbon diagram of the crystal structure of mouse EGR1 protein (PDB entry P08046) was obtained from AlphaFold Protein Structure Database (https://alphafold.ebi.ac.uk). We used YINFO online platform (https://cloud.yinfotek.com) to visualize the C2H2 zinc finger domains (red) and label the K364 site (blue). L) After treatment with lactate (8 mM for 7 h) or NaLa lactate (8 mM for 7 h), co‐IP was performed to examine the interaction between Flag‐EGR1 protein and Importin‐α in MPMVECs overexpressing the Flag‐EGR1. M) After treatment with lactate (8 mM for 7 h), co‐IP was performed to examine the interaction between Flag‐EGR1 protein and Importin‐α in MPMVECs overexpressing the K364R, K402R, or wild‐type Flag‐EGR1. All data were represented as the means±SD, *p < 0.05, **p < 0.01, ***p < 0.001, and ****p < 0.0001; ns, not significant.
Figure 7
Figure 7
Identification of KAT2B as an EGR1 lactyltransferase. A) Identifying EGR1‐interacting acetyltransferase using IP in combination with LC‐MS/MS. B) The spectrograms showed mass spectroscopy‐identified CBP and KAT2B peptides. C) After MPMVECs be treated with LPS (12 ug mL−1 for 12 h), lactate (8 mM for 7 h), or both, co‐IP was performed to examine the interaction between Flag‐EGR1 protein and KAT2B in MPMVECs overexpressing the Flag‐EGR1. D) After MPMVECs be treated with LPS (12 ug mL−1 for 12 h), lactate (8 mM for 7 h), or both, co‐IP was performed to examine the interaction between Flag‐EGR1 protein and CBP in MPMVECs overexpressing the Flag‐EGR1. E) Kla levels of EGR1 in the H3‐K18R mutant MPMVECs transfected with scramble, CBP, or KAT2B‐targted shRNA. F) co‐IP was performed to examine the interaction between Flag‐EGR1 protein and KAT2B in MPMVECs overexpressed with WT, K402 or K364 point mutatio‐EGR1 after lactate stimulation (8 mM). G) After treatment with lactate (8 mM) for 7 h, cytoplasmic and nuclear EGR1 expression was measured in MPMVEC transfected with scramble or KAT2B‐targted shRNA. H) After transfected with scramble or KAT2B‐targted shRNA, ChIP‐qPCR detected EGR1 occupancy rates in the promoter region of HPSE after lactate stimulation (8 mM) (n = 3). I) After treatment with lactate (8 mM) for 7 h, cytoplasmic and nuclear EGR1 expression was measured in MPMVEC overexpressed with exogenous KAT2B. J) Global Kac levels of MPMVECs transfected with scramble or KAT2B‐targted shRNAs in the presence of lactate (8 mM). K) Global Kla levels of MPMVECs transfected with scramble or KAT2B‐targted shRNAs in the presence of lactate (8 mM). L) Global Kla levels of control vector or HA‐tagged KAT2B truncations‐overexpressed MPMVECs after lactate stimulation (8 mM). M) After treatment with lactate (8 mM for 7 h), co‐IP was performed to examine the lactylation levels of EGR1 and its interaction with HA‐KAT2B protein in control vector or HA‐tagged KAT2B truncations‐overexpressed MPMVECs. N) GST‐pull down assay was performed to examine the direct interaction between GST‐KAT2B‐WT, GST‐KAT2B‐ΔGNAT with His‐EGR1, respectively. O) In vitro EGR1 lactylation assay. Purified GST‐KAT2B‐WT or GST‐KAT2B‐ΔGNAT was incubated with purified His‐EGR1 with or without lactyl‐CoA. Kla levels of EGR1 were analyzed by WB. P) Molecular docking model of EGR1 (red) (PDB entry P08046) interacting with the GNAT‐domain of KAT2B (PDB entry Q9JHD1) (blue). All data were represented as the means±SD, *p < 0.05, **p < 0.01, ***p < 0.001, and ****p < 0.0001; ns, not significant.
Figure 8
Figure 8
EGR1 knockout attenuates glycocalyx degradation and ALI in mice with polymicrobial sepsis. A) Expression of KAT2B and EGR1 in whole lung tissue lysate of mice injected with lactate (0.5 g kg−1 body weight) or not after Sham and CLP surgery. co‐IP was further performed to examine the lactylation levels of EGR1 and its interaction with KAT2B in tissue lysate. B) Expression of KAT2B and EGR1 in whole lung tissue lysate of mice injected with sodium oxamate (0.75 g kg−1 body weight) or not after Sham and CLP surgery. co‐IP was further performed to examine the lactylation levels of EGR1 and its interaction with KAT2B in tissue lysate. C) SEM and TEM imaging of the glycocalyx structure on the surface of pulmonary vascular using tracer lanthanum staining of in EGR1‐WT or EGR1−/− mice after CLP surgery. Scale bar, 1µm. D) Serum concentration of HSPG2 and syndecan‐1 of EGR1‐WT or EGR1−/− mice after CLP surgery (n = 6). E) Representative immunofluorescent staining images of HSPG2 (green) and syndecan‐1 (yellow) in endothelial surface of the lung tissues in EGR1‐WT or EGR1−/− mice after CLP surgery. Endothelial surface were stained with CD31 (red), and nuclei were stained with DAPI (blue). Scale bar, 20 µm; F) quantification of fluorescence intensity was analyzed by ImageJ (n = 5 per group). G) Content of HSPG2 and syndecan‐1 in lung tissue of EGR1‐WT or EGR1−/− mice after CLP surgery were detected by WB. The Right panel represents WB quantification (n = 5). H) Evans blue tracer in whole lung of EGR1‐WT or EGR1−/− mice after CLP surgery. The Right panel represents Evans blue dye contents quantification (n = 5). I) Lung permeability index of EGR1‐WT or EGR1−/− mice after CLP surgery (n = 5). J) Expression of ZO‐1 and Occludin in lung tissue of EGR1‐WT or EGR1−/− mice after CLP surgery were detected by WB. K) WB quantification (n = 5). L) Concentration of IL‐6, TNF‐α, and IL‐1β in BALF of EGR1‐WT or EGR1−/− mice after CLP surgery (n = 6). M) Detailed images of pulmonary inflammation of EGR1‐WT or EGR1−/− mice after CLP surgery were derived with Micro‐CT. N) Representative HE staining of the lung tissue section of EGR1‐WT or EGR1−/− mice after CLP surgery. Scale bar, 100 µm. O) Survival rates among EGR1‐WT or EGR1−/− mice were compared by Kaplan‐Meier test. All data were represented as the means±SD, *p < 0.05, **p < 0.01, ***p < 0.001, and ****p < 0.0001; ns, not significant.
Figure 9
Figure 9
Schematic of enhanced glycolysis‐induced lactate overproduction promoting pulmonary endothelial glycocalyx degradation and ALI via histone H3K18 and EGR1 lactylation.

References

    1. Evans L., Rhodes A., Alhazzani W., Antonelli M., Coopersmith C. M., French C., Machado F. R., Mcintyre L., Ostermann M., Prescott H. C., Schorr C., Simpson S., Wiersinga W. J., Alshamsi F., Angus D. C., Arabi Y., Azevedo L., Beale R., Beilman G., Belley‐Cote E., Burry L., Cecconi M., Centofanti J., Coz Yataco A., De Waele J., Dellinger R. P., Doi K., Du B., Estenssoro E., Ferrer R., et al., Intensive Care Med. 2021, 47, 1181. - PMC - PubMed
    1. Fleischmann‐Struzek C., Mellhammar L., Rose N., Cassini A., Rudd K. E., Schlattmann P., Allegranzi B., Reinhart K., Intensive Care Med. 2020, 46, 1552. - PMC - PubMed
    1. Xie J., Wang H., Kang Y., Zhou L., Liu Z., Qin B., Ma X., Cao X., Chen D., Lu W., Yao C., Yu K., Yao X., Shang H., Qiu H., Yang Y., Crit. Care Med. 2020, 48, e209. - PubMed
    1. McMullan R. R., McAuley D. F., O'Kane C. M., Silversides J. A., Crit. Care 2024, 28, 97. - PMC - PubMed
    1. Goligorsky M. S., Sun D., Am. J. Pathol. 2020, 190, 791. - PMC - PubMed

LinkOut - more resources