. 2025 Feb:79:103466.
doi: 10.1016/j.redox.2024.103466. Epub 2024 Dec 10.

Cardiac secreted HSP90α exacerbates pressure overload myocardial hypertrophy and heart failure

Affiliations

Cardiac secreted HSP90α exacerbates pressure overload myocardial hypertrophy and heart failure

Le Pan et al. Redox Biol. 2025 Feb.

Abstract

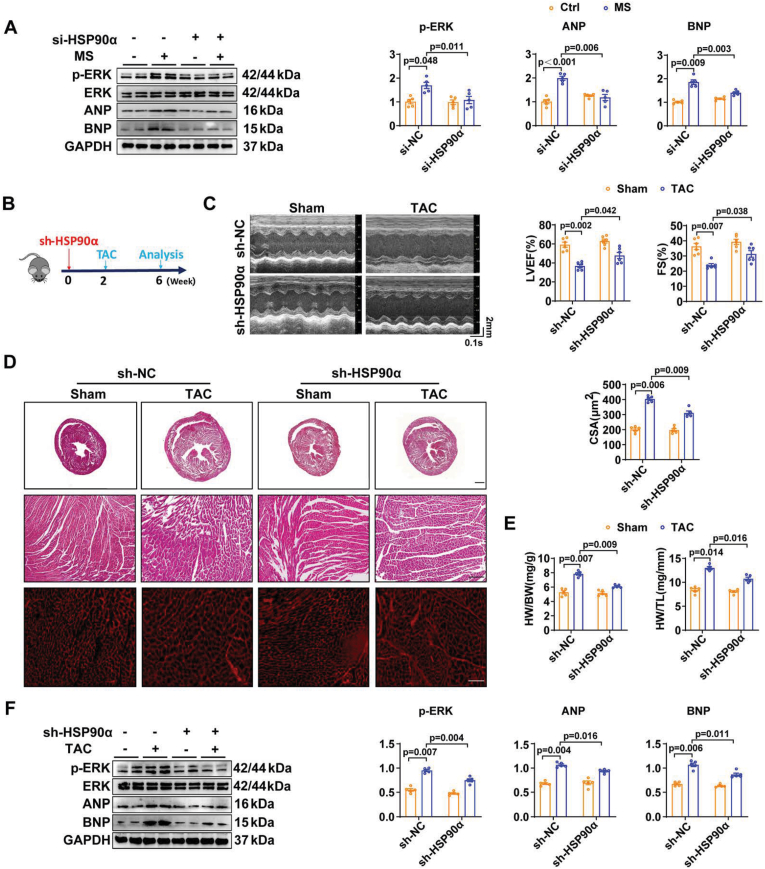
Sustained myocardial hypertrophy or left ventricular hypertrophy (LVH) triggered by pressure overload is strongly linked to adverse cardiovascular outcomes. Here, we investigated the clinical relationship between serum HSP90α (an isoform of HSP90) levels and LVH in patients with hypertension or aortic stenosis (AS) and explored underlying mechanisms in pressure overload mouse model. We built a pressure overload mouse model via transverse aortic constriction (TAC). Compared to controls, elevated serum HSP90α levels were observed in patients with hypertension or AS, and the levels positively correlated with LVH. Similarly, HSP90α levels increased in heart tissues from patients with obstructive hypertrophic cardiomyopathy (HCM), and in mice post-TAC. TAC induced the enhanced cardiac expression and secretion of HSP90α from cardiomyocytes and cardiac fibroblasts. Knockdown of HSP90α or blockade of extracellular HSP90α (eHSP90α) attenuated cardiac hypertrophy and dysfunction by inhibition of β-catenin/TCF7 signaling under pressure overload. Further analysis revealed that eHSP90α interacted with EC1-EC2 region of N-cadherin to activate β-catenin, enhancing the transcription of hypertrophic genes by TCF7, resulting in cardiac hypertrophy and dysfunction under pressure overload. These insights suggest the therapeutic potential of targeting HSP90α-initiated signaling pathway against cardiac hypertrophy and heart failure under pressure overload.

Keywords: Cardiac hypertrophy; HSP90; Heart failure; Pressure overload; β-catenin.


Conflict of interest statement

Declaration of competing interest The authors declare that they have no known competing financial interests or personal relationships that could have appeared to influence the work reported in this paper.

Figures

Image 1
Graphical abstract
Fig. 1
Fig. 1
Serum HSP90α levels are elevated in patients with hypertension or aortic stenosis (AS). A, Experimental design for serum HSP90α levels in the hypertension (HBP), aortic valve stenosis (AS) and corresponding control group (Ctrl) group. B, The serum HSP90α level in the control group (Ctrl, n = 74) and hypertension group (HBP, n = 74) after PSM. C, The serum HSP90α level in normal group (n = 74), elevated group (n = 19), stage 1 group (n = 35) and stage 2 group (n = 20) after PSM. D, The serum HSP90α level in well-controlled hypertension group (Well-Con, n = 77) and poor-controlled hypertension group (Poor-Con, n = 77) after PSM. E, Analysis of the relationship between interventricular septum (IVS) and Log-Hsp90α in the hypertension group. F, The serum HSP90α level in the control group (n = 68) and aortic valve stenosis (AS) group (n = 68) after PSM. G, Analysis of the relationship between IVS and Log-Hsp90α in the AS group.
Fig. 2
Fig. 2
Pressure overload induces increased expression and secretion of HSP90α from cardiomyocytes and cardiac fibroblasts. A, Western blot analysis of HSP90α, ANP and BNP expressions in hypertrophic cardiomyopathy (HCM) and normal myocardium (Ctrl) heart tissues, n = 6/group. B, Western blot analysis of HSP90α, p-ERK, ANP and BNP expressions in heart tissue at different time points (3 days, 1 week, 2 weeks, 4 weeks) after TAC. Sham: Sham operation. n = 5/group. C-D, Western blot analysis of HSP90α expression in culture medium and cardiomyocytes (CMs) or cardiac fibroblasts (CFs) at different time points (3, 6, 12, 24 and 48h) after mechanical stretch (MS), n = 5–6/group. E, Western blot analysis of HSP90α in cardiomyocytes (CMs) and cardiac fibroblasts (CFs) isolated from mice 2 weeks after TAC and sham operated mice, n = 6/group.
Fig. 3
Fig. 3
Knockdown of HSP90α ameliorates myocardial hypertrophy under pressure overload. A, Western blot analysis of p-ERK, ANP and BNP expressions in cardiomyocytes pre-transfected with si-HSP90α or si-NC followed by mechanical stretch or not, n = 5/group. B, Experimental design for the sh-HSP90α-AAV9 (Sh-HSP90α) or sh-NC-AAV9 (sh-NC, as control) injected mice followed by TAC or sham operation. C, Representative echocardiography M-mode images left ventricular ejection fraction (LVEF) and shortening fraction (FS) obtained from sh-HSP90α or sh-NC mice followed by TAC or sham operation, n = 5–6/group. D, Representative HE staining and WGA images of heart tissue obtained from sh-HSP90α or sh-NC mice followed by TAC or sham operation. scale bar, 1 mm; 100 μm; 50 μm. n = 5–6/group. E, Heart weight/body weight ratio (HW/BW) and heart weight/tibia length (HW/TL) of sh-HSP90α or sh-NC mice followed by TAC or sham operation, n = 5–6/group. F, Western blot analysis of p-ERK, ANP and BNP expressions in heart tissue of sh-HSP90α or sh-NC mice followed by TAC or sham operation, n = 5/group.
Fig. 4
Fig. 4
The secretion of HSP90α from cardiomyocytes plays a critical role in cardiac hypertrophy. A, Western blot analysis of HSP90α expression in culture medium and cardiomyocytes (CMs) pre-administered with 1G6-D7 (eHSP90α neutralizing antibody) or lgG followed by mechanical stretch (MS) or not, n = 5/group. B, Western blot analysis of p-ERK, ANP and BNP expressions in cardiomyocytes pre-administered with 1G6-D7 or lgG followed by mechanical stretch(MS) or not, n = 5/group. C, Experimental design for the mice infused with 1G6-D7 or lgG following TAC or shamoperation. D, Representative echocardiography M-mode images left ventricular ejection fraction (LVEF) and shortening fraction (FS) obtained from mice infused with 1G6-D7 or lgG following TAC or sham operation, n = 5–6/group. E, Representative HE and WGA images of heart tissue obtained from mice infused with 1G6-D7 or lgG following TAC or sham operation, scale bar, 1 mm; 100 μm; 50 μm. n = 5–6/group. F, Heart weight/body weight ratio (HW/BW) and heart weight/tibia length (HW/TL) of mice infused with 1G6-D7 or lgG follwoinfollowing TAC or sham operation, n = 5–6/group. G, Western blot analysis of p-ERK, ANP, and BNP expressions in heart tissue of mice infused with 1G6-D7 or lgG following TAC or sham operation, n = 5/group. H, Western blot analysis of HSP90α expression in serum and heart tissue of mice infused with 1G6-D7 or lgG following TAC or sham operation, n = 5/group.
Fig. 5
Fig. 5
HSP90α promotes cardiac hypertrophy by activation of β-catenin under pressure overload. A, The Venn diagram and heatmap shows the KEGG enrichment pathways analyzed from dataset GSE12287 and GSE32453. B, Western blot analysis of active β-catenin expression in heart tissue of sh-HSP90α or sh-NC mice followed by TAC or sham operation, n = 5/group. C, Western blot analysis of the active β-catenin expression in cardiomyocytes pre-transfected with si-HSP90α or si-NC followed by mechanical stretch(MS) or not, n = 5/group. D, Western blot analysis of the active β-catenin expression in heart tissue of mice infused with 1G6-D7 (HSP90α neutralizing antibody) or lgG following TAC or sham operation, n = 5/group. E, Western blot analysis of the active β-catenin expression in cardiomyocytes pre-administered 1G6-D7 or lgG followed by mechanical stretch(MS) or not, n = 5/group. F, Left ventricular ejection fraction (LVEF) and shortening fraction (FS) obtained from mice infused with recombinant human HSP90α (rHSP90α) or PBS followed by Tegatrabetan (Tega, β-catenin inhibitor) or DMSO, n = 5–6/group. G, Representative HE and WGA images of heart tissue obtained from mice infused with rHSP90α or PBS followed by Tegatrabetan or DMSO, scale bar, 1 mm; 100 μm; 50 μm. n = 5–6/group. H, Western blot analysis of the expressions of active β-catenin, p-ERK, ANP and BNP in cardiomyocytes pre-administered with rHSP90α or PBS follow by Tegatrabetan or DMSO , n = 5/group. I, Western blot analysis of the expressions of active β-catenin, p-ERK, ANP and BNP expression in mechanical stretch cardiomyocytes pre-transfected with si-HSP90α or si-NC followed by SKL2001 (β-catenin agonist) or DMSO administration, n = 5/group. Active-β-catenin is normalized with total β-catenin.
Fig. 6
Fig. 6
HSP90α activates the β-catenin signaling by stimulating TCF7 binding to ANP and BNP promoters to promote those genes transcription in cardiomyocytes. A, Real-time PCR analysis of ANP and BNP mRNA levels in heart tissue of sh-HSP90α or sh-NC mice followed by TAC or sham operation, n = 5/group. B, Real-time PCR analysis of ANP and BNP mRNA levels in AC16 cells administered with recombinant human HSP90α (rHSP90α) or PBS following Tegatrabetan (Tega, β-catenin inhibitors) or DMSO, n = 6/group. C, Real-time PCR analysis of ANP and BNP mRNA levels in AC16 cells administered with SKL2001 (β-catenin agonists) or DMSO, n = 6/group. D, Analysis of ANP and BNP promoter regions interacted with TCF7 by JASPAR database of TCF7. E, ChIP-qPCR analysis of TCF7 binding to ANP and BNP promoters in the AC16 cells administered rHSP90α or PBS, n = 6/group. F, ChIP-qPCR analysis of TCF7 binding to ANP and BNP promoters in the AC16 cells pre-administered with rHSP90 PBS followed by Tegatrabetan (Tega) or DMSO followed by rHSP90α or PBS administration, n = 6/group. G, Western blot analysis of the TCF7 expression in heart tissue of mice infused with 1G6-D7 or lgG following TAC or sham operation, n = 5/group. H, Real-time PCR analysis of TCF7 mRNA levels in cardiomyocytes (CMs) administered with the different concentration of rHSP90α. PBS was used aswith control, n = 6/group. I, Western blot analysis of the TCF7, HSP90α, p-ERK, ANP and BNP expressions in cardiomyocytes pre-transfected with si-TCF7 or si-NC followed by rHSP90α or PBS administration, n = 5/group. J, Western blot analysis of TCF7, HSP90α, p-ERK, ANP and BNP expression in cardiomyocytes pre-administered with SCH772984 (SCH, ERK specific inhibitor) or DMSO followed by rHSP90α or PBS administration, n = 5/group.
Fig. 7
Fig. 7
Secreted HSP90α interacts with N-cadherin to induce the activation of β-catenin/TCF7 signaling in cardiomyocytes. A, Experimental design for the Nano-HPLC-MS/MS analysis of the proteins interacting with HSP90α in HCM tissue. B, Mass spectra image of N-cadherin for Nano-HPLC-MS/MS analysis of HSP90α-interacting proteins in HCM. C, The Protein-Protein Interaction (PPI) network diagram generated by STRING analysis shows the proteins interacted with β-catenin (CTNNB1). D, Western blot after immunoprecipitation (IP) of HSP90α or β-catenin in Cos7 cell line transfected with N-cadherin plasmid. E, TOPflash luciferase reporter to detect the effect of overexpression of N-cadherin on activation of β-catenin in Cos7 cells treated with rHSP90α or PBS, n = 6/group. F, Proximity Ligation Assay (PLA) shows the direct interaction of HSP90α and N-cadherin in PBS or rHSP9α treated cardiomyocytes, n = 5/group Scale bar: 25 μm. G, IP analysis of the interaction of HSP90α and N-cadherin or N-cadherin and β-catenin in TAC and sham mice heart tissue. H, PLA shows the direct interaction of HSP90α and N-cadherin in heart tissue of sham or TAC mice, n = 5–6/group, Scale bar: 50 μm. I, PLA shows the direct interaction of N-cadherin and β-catenin in heart tissue of sham or TAC mice, n = 5–6/group, Scale bar: 50 μm. J, Immunofluorescence assay shows the colocalization of HSP90α and N-cadherin in heart tissue of sham or TAC mice, n = 5–6/group, Scale bar: 25 μm.
Fig. 8
Fig. 8
N-cadherin plays a vital effect in HSP90α-mediated cardiac hypertrophy in vivo and in vitro. A, Western blot analysis of the N-cadherin, HSP90α, active β-catenin, p-ERK, ANP, BNP and TCF7 expressions in cardiomyocytes (CMs) pre-transfected with si-N-cadherin or si-NC followed by recombinant HSP90α (rHSP90α) or PBS administration, n = 5/group, active-β-catenin is normalized with total β-catenin. B, Immunofluorescence analysis of surface area of cardiomyocytes (CMs) pre-transfected with si-N-cadherin or si-NC followed by rHSP90α or PBS administration, n = 5/group. Scale bar: 25 μm. C, Experimental design for the sh-NC-AAV9 (sh-NC) or sh-N-cadherin-AAV9 (sh-N-cad) injected mice followed by rHSP90α or PBS administration. D, Representative echocardiography M-mode images of left ventricular ejection fraction (LVEF) and shortening fraction (FS) obtained from sh-NC or sh-N-cadherin mice followed by rHSP90α or PBS administration, n = 5–6/group. E, Representative HE and WGA staining images of heart tissue obtained from sh-NC or sh-N-cadherin mice followed by rHSP90α or PBS administration, scale bar, 1 mm; 100 μm; 50 μm. n = 5–6/group. F, Heart weight/body weight ratio (HW/BW) and heart weight/tibia length (HW/TL) of sh-NC or sh-N-cadherin mice followed by rHSP90α or PBS administration, n = 5–6/group.
Fig. 9
Fig. 9
Secreted HSP90α binds with the 160–382 domain of N-cadherin to activate β-catenin and cardiac hypertrophy. A, Schematic depiction of N-cadherin, Pro: the cadherin-Pro region; EC1-5: five extracellular cadherin domain repeats; TM: the transmembrane region; Cyto: the cytoplasmic tail. B, Western blot analysis of N-cadherin and β-catenin in Cos 7 cells pre-transfected with N-cadherin full-length, N-cadherin del160-382 or N-cadherin del160-724 plasmids respectively, and then treated with or without rHSP90α. C, TOPflash luciferase reporter analysis in Cos7 cells grouped as same as in (B), n = 6/group. D, Summary of this study. Pressure overload mediates the increased cardiac expression and secretion of HSP90α, and cardiac secreted HSP90α specifically activates β-catenin/TCF7 signaling by binding N-cadherin of cardiomyocyte membrane, induces transcription of hypertrophic genes ANP and BNP, promotes cardiac hypertrophy and subsequently causes cardiac dysfunction.

References

    1. Felix-Redondo F.J., Fernandez-Berges D., Calderon A., et al. Prevalence of left-ventricular hypertrophy by multiple electrocardiographic criteria in general population: hermex study. J. Hypertens. 2012;30(7):1460–1467. - PubMed
    1. Cuspidi C., Sala C., Negri F., et al. Prevalence of left-ventricular hypertrophy in hypertension: an updated review of echocardiographic studies. J. Hum. Hypertens. 2012;26(6):343–349. - PubMed
    1. Cioffi G., Faggiano P., Vizzardi E., et al. Prognostic effect of inappropriately high left ventricular mass in asymptomatic severe aortic stenosis. Heart. 2011;97(4):301–307. - PubMed
    1. Tham Y.K., Bernardo B.C., Ooi J.Y., et al. Pathophysiology of cardiac hypertrophy and heart failure: signaling pathways and novel therapeutic targets. Arch. Toxicol. 2015;89(9):1401–1438. - PubMed
    1. Richter K., Buchner J. Hsp90: chaperoning signal transduction. J. Cell. Physiol. 2001;188(3):281–290. - PubMed

MeSH terms

Substances