. 2024 Dec 26;24(1):1246.
doi: 10.1186/s12870-024-05932-6.

Overexpression of an NF-YB gene family member, EaNF-YB2, enhances drought tolerance in sugarcane (Saccharum Spp. Hybrid)

Affiliations

Overexpression of an NF-YB gene family member, EaNF-YB2, enhances drought tolerance in sugarcane (Saccharum Spp. Hybrid)

Appunu Chinnaswamy et al. BMC Plant Biol. .

Abstract

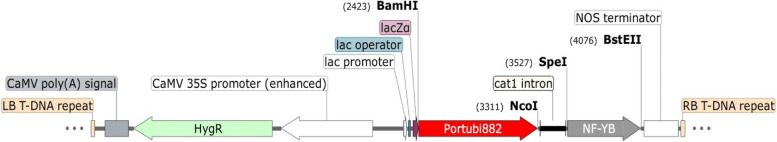
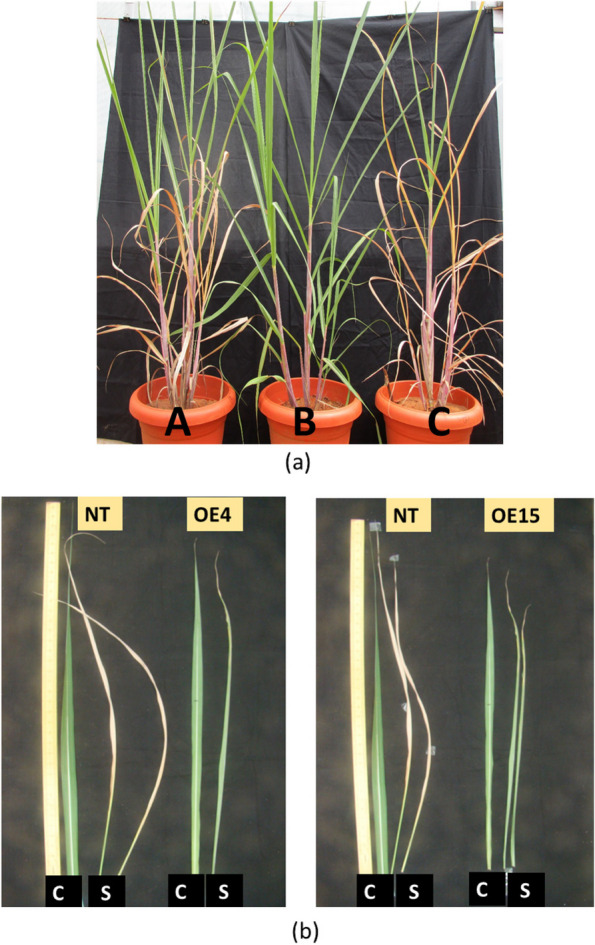
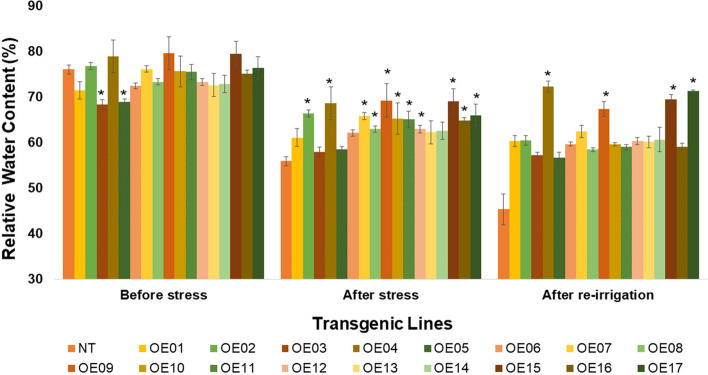
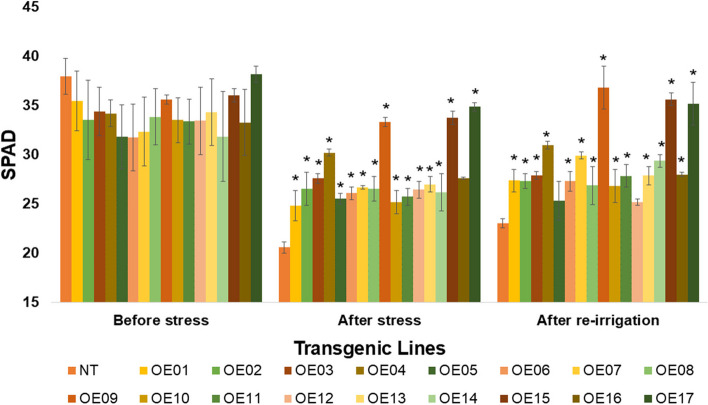
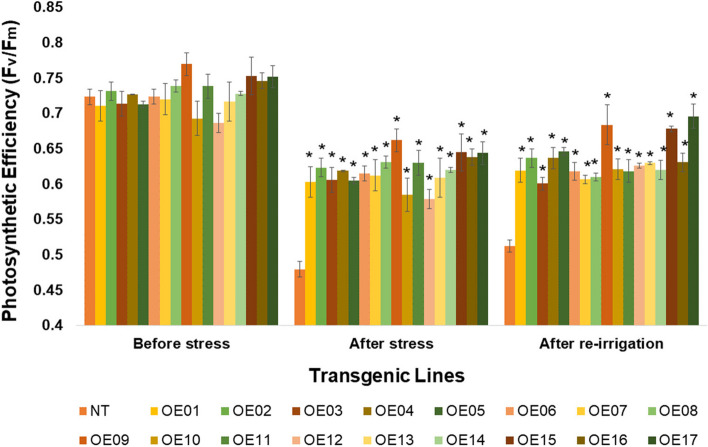
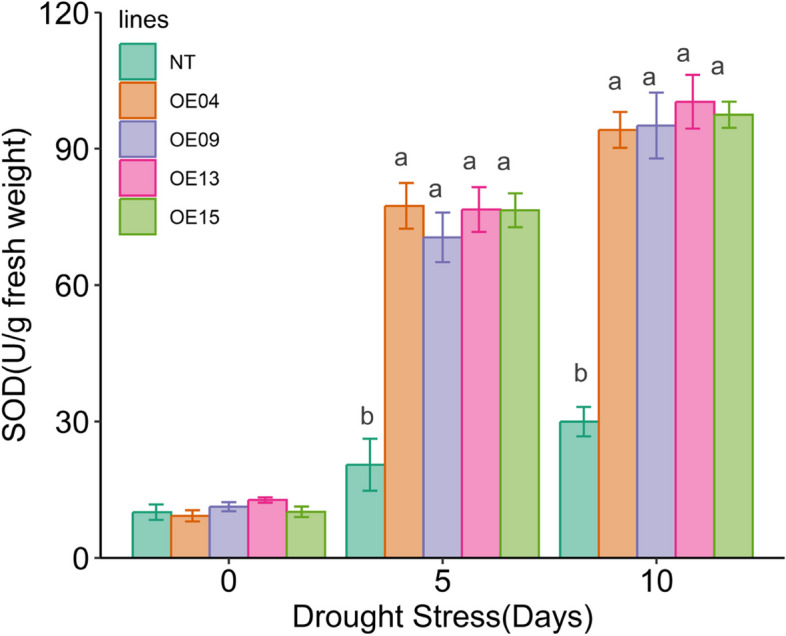
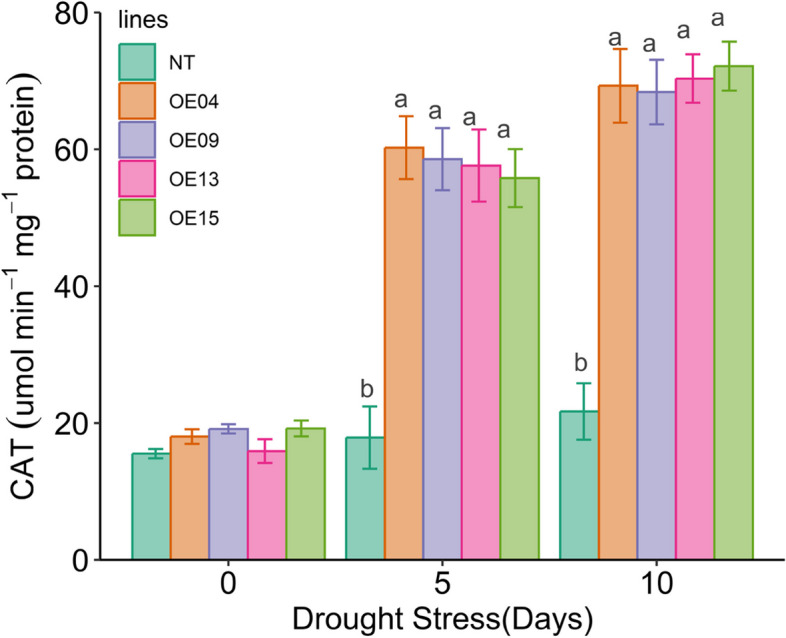
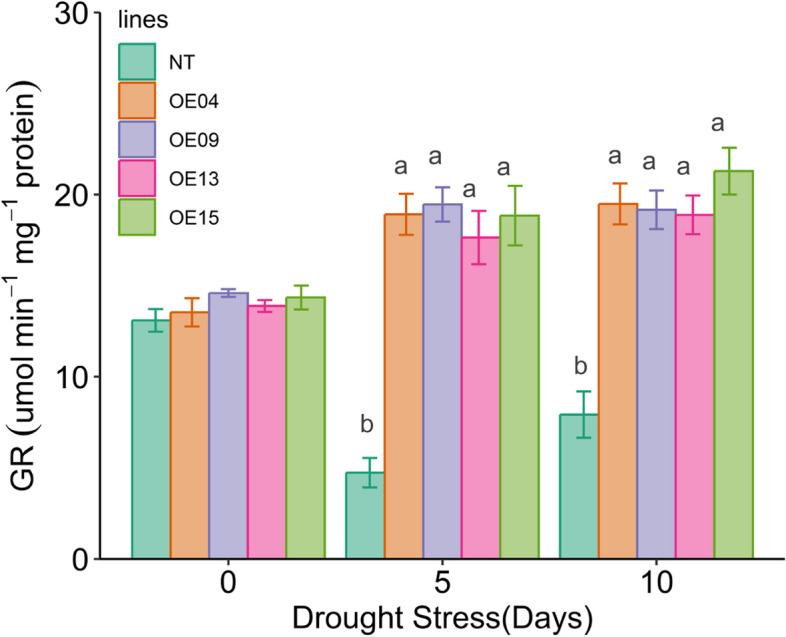
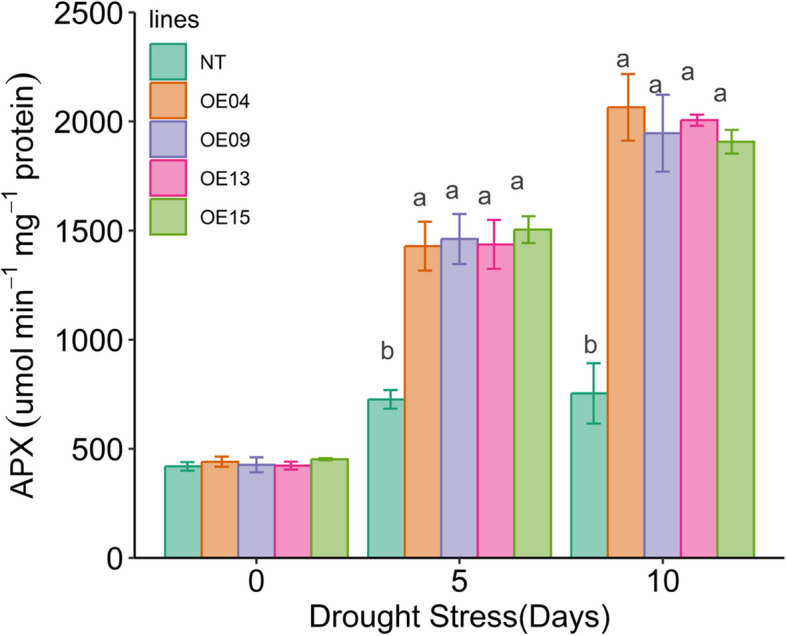
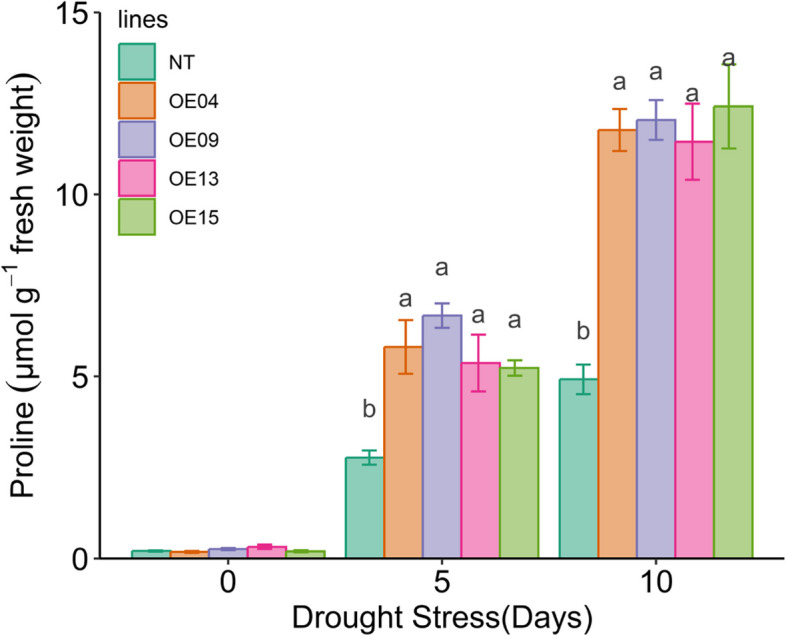
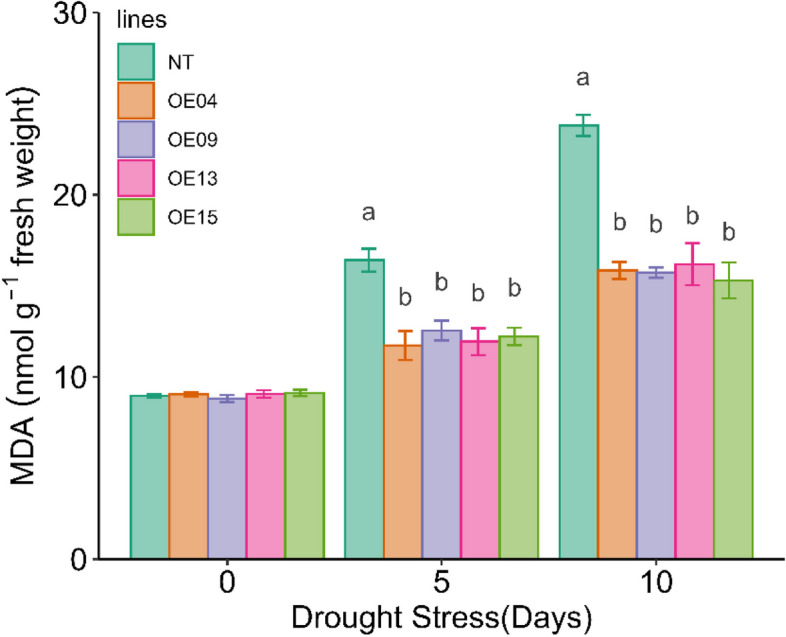
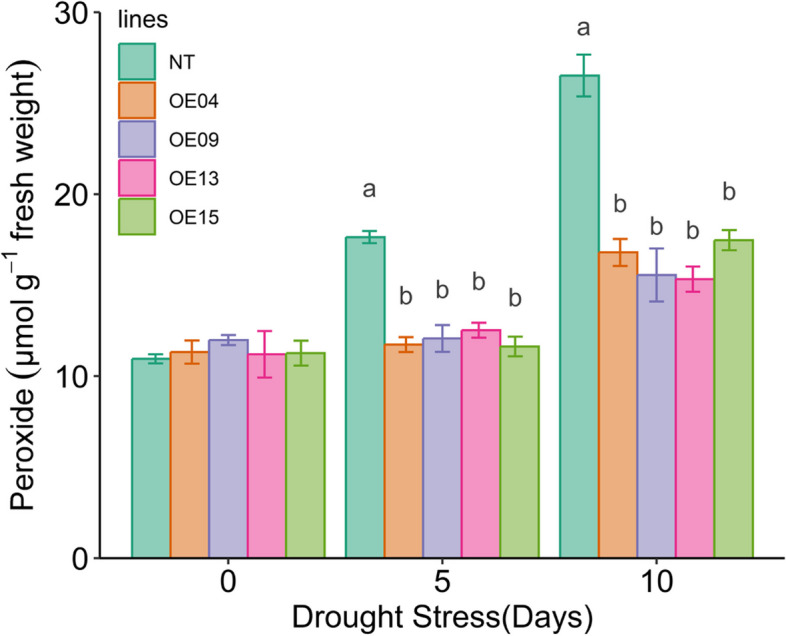
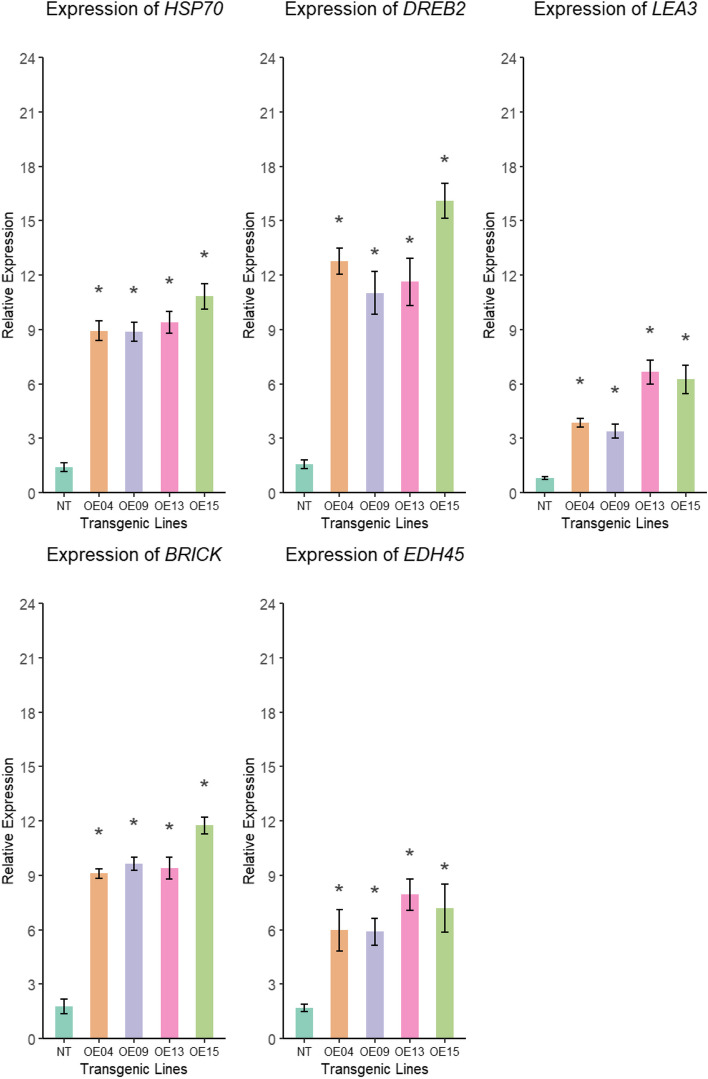
Background: Drought is one of main critical factors that limits sugarcane productivity and juice quality in tropical regions. The unprecedented changes in climate such as monsoon failure, increase in temperature and other factors warrant the need for development of stress tolerant cultivars to sustain sugar production. Plant Nuclear factor (NF-Y) is one of the major classes of transcription factors that have a major role in plant development and abiotic stress response. In our previous studies, we found that under drought conditions, the nuclear factor NF-YB2 was highly expressed in Erianthus arundinaceus, an abiotic stress tolerant wild genus of Saccharum species. In this study, the coding sequence of NF-YB2 gene was isolated from Erianthus arundinaceus and overexpressed in sugarcane to develop drought tolerant lines. RESULTS : EaNF-YB2 overexpressing sugarcane (OE) lines had higher relative water content, chlorophyll content and photosynthetic efficiency compared to non-transgenic (NT) control. In addition, overexpressing lines had higher activity of antioxidant enzymes such as superoxide dismutase (SOD), catalase (CAT), ascorbate peroxidase (APX), and glutathione reductase (GR), and higher proline content, lower malondialdehyde (MDA) and peroxide (H2O2) contents. The expression studies revealed that EaNF-YB2 expression was significantly higher in OE lines than NT control under drought stress. The OE lines had an elevated expression of abiotic stress responsive genes such as BRICK, HSP 70, DREB2, EDH45, and LEA3. The morphological analysis revealed that OE lines exhibited less wilting than NT under drought conditions.

Conclusion: This study provides insights into the role of the EaNF-YB2 gene in drought tolerance in sugarcane. Based on the findings of this study, the EaNF-YB2 gene can be potentially exploited to produce drought tolerant sugarcane cultivars to sustain sugarcane production under water deficit conditions.

Keywords: EaNF-YB2; Erianthus Arundinaceus; Drought tolerance; Sugarcane.


Conflict of interest statement

Declarations. Ethics approval and consent to participate: The Saccharum spp. Hybrid (Co 86032) used in this study was developed at the ICAR-Sugarcane Breeding Institute, Coimbatore, India, a government-funded institute. The experimental material involved follows institutional, national, and international guidelines and legislation. Consent for publication: Not applicable. Competing interests: The authors declare no competing interests.

Figures

Fig. 1
Fig. 1
Schematic representation of binary vector (pSBI-EaNF-YB2) generated for plant transformation with EaNF-YB2
Fig. 2
Fig. 2
Molecular analysis of putative transgenic lines; a PCR amplification using EaNF-YB2 gene specific primers; b PCR amplification using portubi882 primers; c PCR amplification using promoter and gene fusion primers
Fig. 3
Fig. 3
Morphological changes after 10 days of drought stress; a A - Non-transgenic (NT) control, B - NT under drought stress and C - OE15 under drought stress; EaNF-YB2 OE lines showed less leaf rolling, wilting and maintained leaf greenness in comparison to NT control. C, stands for control plants and S, stands for drought treated plants
Fig. 4
Fig. 4
Relative water content in OE lines before drought stress, 10th day of drought stress and 15th day (after re-irrigation). The values are represented as mean of three replications and error bars represent standard error. Overexpressing lines exhibited significantly higher relative water content compared to non-transformed control plants
Fig. 5
Fig. 5
Chlorophyll content (SPAD) in OE lines and control plant before inducing drought stress, 10th day of drought stress and 15th day (after re-irrigation). The values are represented as mean of three replications and error bars represent standard error. All overexpressing lines showed significantly higher SPAD units compared to non-transformed control plants
Fig. 6
Fig. 6
Photosynthetic efficiency (Fv/Fm) in OE lines and control plant before inducing drought stress, 10th day of drought stress and 15th day after re-irrigation. The values are represented as mean of three replications and error bars represent standard error. All overexpressing lines showed significantly higher photosynthetic efficiency compared to non-transformed wild type plants
Fig. 7
Fig. 7
The SOD activity in OE lines along with NT on 0th, 5th and 10th day of drought stress. The values are represented as the mean of three replications and error bars represent standard error. The different letters show the significant difference at P < 0.05 (Duncan’s multiple range test)
Fig. 8
Fig. 8
The CAT activity in OE lines along with NT on 0th, 5th and 10th day of drought stress. The values are represented as the mean of three replications and error bars represent standard error. The different letters show the significant difference at P < 0.05 (Duncan’s multiple range test)
Fig. 9
Fig. 9
The GR activity in OE lines along with NT on 0th, 5th and 10th day of drought stress. The values are represented as the mean of three replications and error bars represent standard error. The different letters show the significant difference at P < 0.05 (Duncan’s multiple range test)
Fig. 10
Fig. 10
APX activity in OE lines along with NT on 0th, 5th and 10th day of drought stress. The values are represented as the mean of three replications and error bars represent standard error. The different letters show the significant difference at P < 0.05 (Duncan’s multiple range test)
Fig. 11
Fig. 11
Proline content in OE lines along with NT on 0th, 5th and 10th day of drought stress. The values are represented as the mean of three replications and error bars represent standard error. The different letters show the significant difference at P < 0.05 (Duncan’s multiple range test)
Fig. 12
Fig. 12
MDA content in OE lines along with NT on 0th, 5th and 10th day of drought stress. The values are represented as the mean of three replications and error bars represent standard error. The different letters show the significant difference at P < 0.05 (Duncan’s multiple range test)
Fig. 13
Fig. 13
H2O2 content in OE lines along with NT on 0th, 5th and 10th day of drought stress. The values are represented as the mean of three replications and error bars represent standard error. The different letters show the significant difference at P < 0.05 (Duncan’s multiple range test)
Fig. 14
Fig. 14
Relative expression of EaNF-YB2 gene in OE lines along with NT on 10th day of drought stress. The values are represented as the mean of three replications and error bars represent standard error. The different letters show the significant difference at P < 0.05 (Duncan’s multiple range test)
Fig. 15
Fig. 15
Relative expression of abiotic stress responsive genes in OE lines along with NT on 10th day of drought stress. The values are represented as the mean of three replications and error bars represent standard error. Asterisk (*) indicates the significant difference at P < 0.05 (Duncan’s multiple range test)

References

    1. Chaves-Sanjuan A, Gnesutta N, Gobbini A, Martignago D, Bernardini A, Fornara F, et al. Structural determinants for NF‐Y subunit organization and NF‐Y/DNA association in plants. Plant J. 2021;105:49–61. - PubMed
    1. Liu J-X, Howell SH. bZIP28 and NF-Y transcription factors are activated by ER stress and assemble into a transcriptional complex to regulate stress response genes in Arabidopsis. Plant Cell. 2010;22:782–96. - PMC - PubMed
    1. Zhao H, Wu D, Kong F, Lin K, Zhang H, Li G. The Arabidopsis thaliana nuclear factor Y transcription factors. Front Plant Sci. 2017;7:2045. - PMC - PubMed
    1. Forsburg SL, Guarente L. Identification and characterization of HAP4: a third component of the CCAAT-bound HAP2/HAP3 heteromer. Genes Dev. 1989;3:1166–78. - PubMed
    1. Laloum T, De Mita S, Gamas P, Baudin M, Niebel A. CCAAT-box binding transcription factors in plants: Y so many? Trends Plant Sci. 2013;18:157–66. - PubMed

MeSH terms

LinkOut - more resources