. 2024 Dec 15;45(18):e70120.
doi: 10.1002/hbm.70120.

Advancing Thalamic Nuclei Segmentation: The Impact of Compressed Sensing on MRI Processing

Affiliations

Advancing Thalamic Nuclei Segmentation: The Impact of Compressed Sensing on MRI Processing

Sebastian Hübner et al. Hum Brain Mapp. .

Abstract

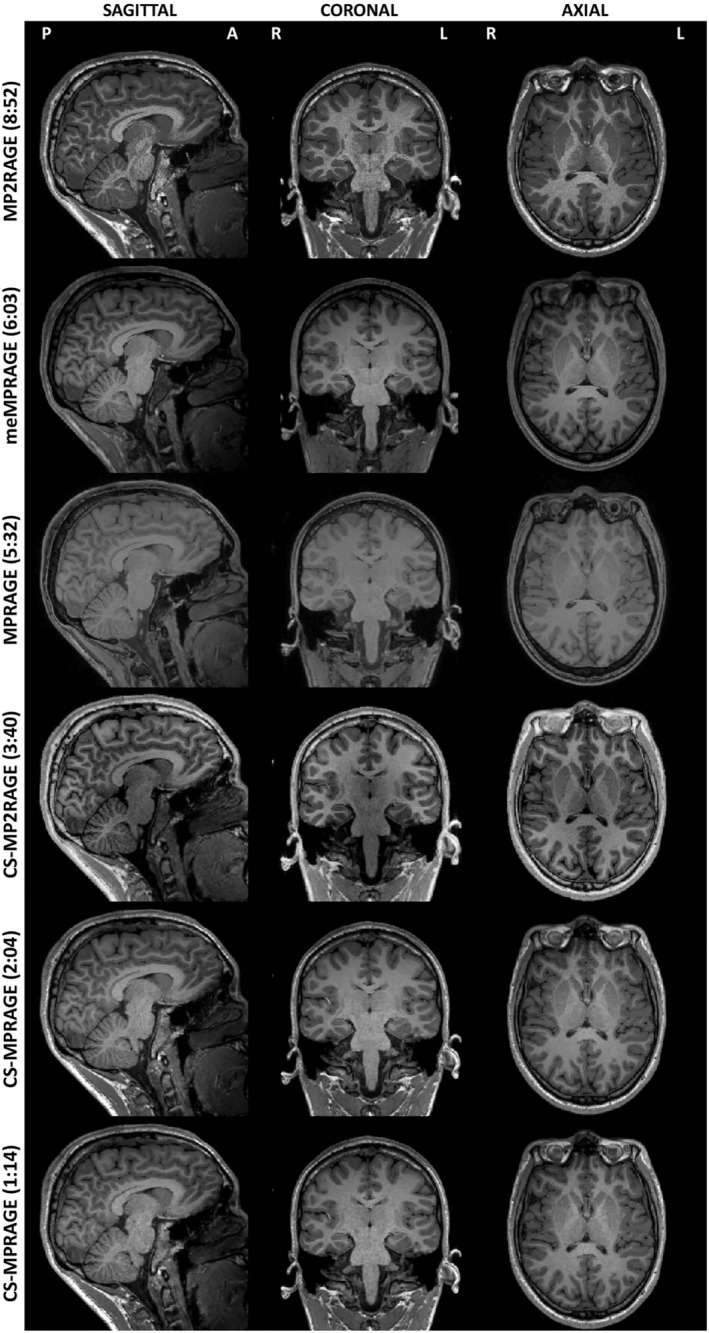
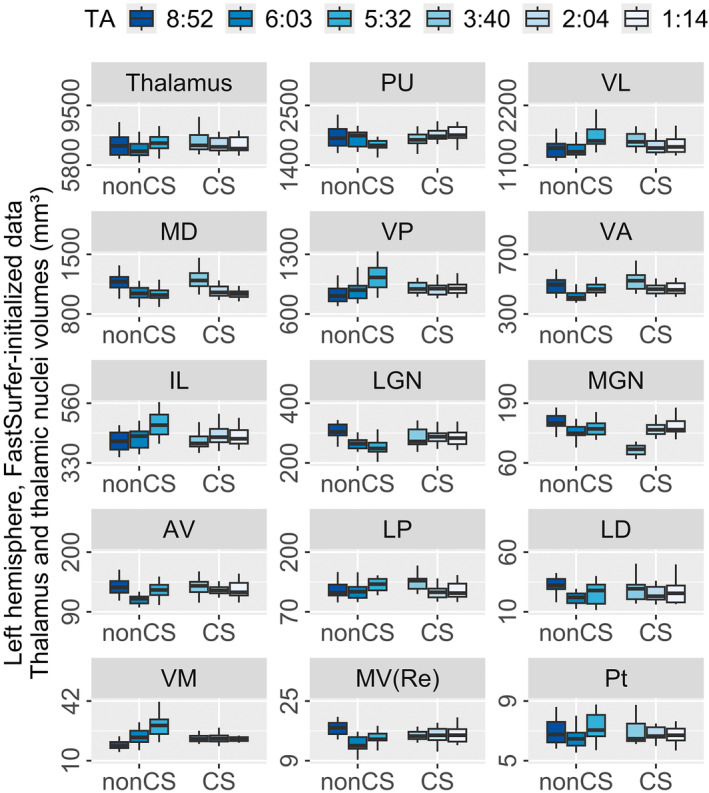
The thalamus is a collection of gray matter nuclei that play a crucial role in sensorimotor processing and modulation of cortical activity. Characterizing thalamic nuclei non-invasively with structural MRI is particularly relevant for patient populations with Parkinson's disease, epilepsy, dementia, and schizophrenia. However, severe head motion in these populations poses a significant challenge for in vivo mapping of thalamic nuclei. Recent advancements have leveraged the compressed sensing (CS) framework to accelerate structural MRI acquisition times in MPRAGE sequence variants, while fast segmentation tools like FastSurfer have reduced processing times in neuroimaging research. In this study, we evaluated thalamic nuclei segmentations derived from six different MPRAGE variants with varying degrees of CS acceleration (from about 9 to about 1-min acquisitions). Thalamic segmentations were initialized from either FastSurfer or FreeSurfer, and the robustness of the thalamic nuclei segmentation tool to different initialization inputs was evaluated. Our findings show minimal sequence effects with no systematic bias, and low volume variability across sequences for the whole thalamus and major thalamic nuclei. Notably, CS-accelerated sequences produced less variable volumes compared to non-CS sequences. Additionally, segmentations of thalamic nuclei initialized from FastSurfer and FreeSurfer were highly comparable. We provide the first evidence supporting that a good segmentation quality of thalamic nuclei with CS T1-weighted image acceleration in a clinical 3T MRI system is possible. Our findings encourage future applications of fast T1-weighted MRI to study deep gray matter. CS-accelerated sequences and rapid segmentation methods are promising tools for future studies aiming to characterize thalamic nuclei in vivo at 3T in both healthy individuals and clinical populations.

Keywords: FastSurfer; FreeSurfer; compressed sensing MRI; fast MRI acquisition; segmentation; thalamic nuclei; volumetric characterization.


Conflict of interest statement

Tobias Kober and Tom Hilbert are employed by Siemens Healthineers International AG, Switzerland.

Figures

FIGURE 1
FIGURE 1
T1‐weighted image contrasts of differently accelerated MPRAGE variants. Qualitative comparisons of sagittal, coronal, and axial planes of a representative sample subject across the considered sequences (acquisition times in brackets are in minutes: seconds, sequences details in Table 1). Image brightness parameters were adjusted to better show tissue contrasts. Slices are taken at central thalamus (subject's native space). Sagittal images show the right hemisphere.
FIGURE 2
FIGURE 2
Thalamic nuclei segmentation. FreeSurfer 3D rendering of thalamic nuclei in their lateral‐medial (top row), rostral‐caudal (middle row), and dorsal‐ventral (bottom row) aspects on T1‐weighted multiecho MPRAGE data of a representative sample subject. In the present study, thalamic nuclei subdivisions were merged as follows: PU (PuM, PuA, PuL, PuI); VL (VLa, VLp); MD (MDm, MDl); VA (VA, VAmc); and IL (CM, CeM, CL, Pc, Pf). See Table S1 for nuclei colors and details on the relabeling scheme.
FIGURE 3
FIGURE 3
Thalamic nuclei segmentations for differently accelerated MPRAGE variants. FastSurfer‐initialized automated thalamic nuclei parcellations of a representative sample subject across the considered MPRAGE variants (acquisition times in brackets are in minutes:seconds, sequences details in Table 1). Sagittal, coronal, and axial planes of parcellations are with the same brightness parameters as in Figure 1. As in Figure 1, slices are taken at central thalamus (subject's native space). Sagittal images show the right hemisphere. Nuclei labels and colors as in Figure 2 and Table S1. FreeSurfer‐initialized data of the same subject's native space can be seen in Figure S1.
FIGURE 4
FIGURE 4
Within‐subject volume variation in thalamic structures across MPRAGE variants. (A) Thalamic volumes (logarithmic color‐coding by size, FastSurfer‐initialized thalamic data) for each MPRAGE variant, grouped as noncompressed sensing (non‐CS) and compressed sensing (CS) accelerations, and listed by decreasing acquisition times (TA: 8:52, MP2RAGE; 6:03, meMPRAGE; 5:32, MPRAGE; 3:40, CS‐MP2RAGE; 2:04 and 1:14, CS‐MPRAGE; TA is in minutes:seconds). Left hemispheric data were presented; right‐hemispheric data were similar; (B) Within‐subject coefficients of variation (CV) across MPRAGE sequences for thalamic structures (left and right hemispheres averaged), considering CV from non‐CS (blue) and CS (red) sequences separately in FastSurfer‐initialized thalamic nuclei segmentations. (C) Same as in panel (B), but using FreeSurfer‐initialized thalamic nuclei segmentations; (D) Negative correlation trend between thalamic nuclei CV and volume (FastSurfer‐initialized thalamic data averaged across hemispheres, sequences, and segmentation initializations). (E) Significant positive correlation between CV of FreeSurfer‐ and FastSurfer‐initialized thalamic segmentations (data averaged across hemispheres and sequences). In panels (B) and (C), the gray dashed line represents a CV of 10% for visual reference purposes; thalamic labels correspond to the list on the left‐hand side of panel (A). In panels (D) and (E), whole thalamus and L‐Sg nucleus were excluded (see text for details); including whole thalamus data in the linear fit did not alter results significantly for both associations (results not reported); Pearson's r coefficients and their significance are presented; regression models show 95% confidence intervals of predictive values. In all panels, FastSurfer and FreeSurfer labels refer to the two segmentation initializations. Thalamic nuclei labels in Table S1. FreeSurfer‐initialized thalamic volumes are shown in Figure S2.
FIGURE 5
FIGURE 5
MPRAGE sequence effects on thalamic volumes. FastSurfer‐initialized volumetric segmentations in thalamic structures (group median and interquartile range, left hemisphere) for each MPRAGE sequence (see Table 1 for details on sequences). For each structure, box‐and‐whiskers are color‐coded, sorted in descending order of acquisition time (TA), and grouped as noncompressed sensing (non‐CS) and compressed sensing (CS)‐accelerated sequences; Friedman tests yielded significant sequence effects for all thalamic structures in the left hemisphere (see Table 2). Right hemisphere was similar. Sequence TA (min:sec): 8:52, MP2RAGE; 6:03, meMPRAGE; 5:32, MPRAGE; 3:40, CS‐MP2RAGE; 2:04 and 1:14, CS‐MPRAGE. Thalamic nuclei labels as in Table S1. FreeSurfer‐initialized thalamic volumes are shown in Figure S2.
FIGURE 6
FIGURE 6
Pairwise correlations of thalamic volumes across MPRAGE variants. Thalamic volume correlations for pairs of sequences are presented as color‐coded Pearson's correlation coefficients (r, FastSurfer‐initialized data). For each correlation matrix, sequence acquisition times (min:sec) are displayed on the axes (8:52, MP2RAGE; 6:03, meMPRAGE; 5:32, MPRAGE; 3:40, CS‐MP2RAGE; 2:04 and 1:14, CS‐MPRAGE). Pearson's r interval, shown in legend, ranges from 0 to 1. Thalamic nuclei labels as in Table S1. Pairwise correlations in FreeSurfer‐initialized thalamic data are presented in Figure S3.
FIGURE 7
FIGURE 7
Within‐subject and within‐sequence comparison of FreeSurfer‐ and FastSurfer‐initialized thalamic segmentation across MPRAGE variants. Bland–Altman analysis comparing thalamic volumes from the two considered segmentation tools. For each thalamic structure, normalized mean differences were computed as the ratio of the absolute difference between volumes of the two tools to their mean, for each subject and then group averaged. Here, normalized mean differences are reported as the mean across subjects, expressed as percentage, and color‐coded. Only volume variabilities higher than 10% were colored, to better highlight the highest differences (notably, nuclei MGN and LD, mean volumes across sequences of 126 and 30 mm3, respectively). On the x‐axis, sequences are sorted in descending order of acquisition time (TA, min:sec), and grouped as noncompressed sensing (non‐CS) and compressed sensing (CS); on the y‐axis, thalamic structures are sorted in descending order of mean volume across sequences. Thalamic nuclei labels as in Table S1.
FIGURE 8
FIGURE 8
Spatial similarity of thalamic nuclei segmentations using Dice Similarity Coefficient (DSC) analysis. (A) DSC in the whole thalamus and thalamic nuclei comparing FreeSurfer‐ vs. FastSurfer‐initialized thalamic nuclei segmentations in MPRAGE variants. (B) DSC in the whole thalamus and thalamic nuclei comparing all sequences relative to multiecho MPRAGE (meMPRAGE) in FastSurfer‐initialized thalamic data. In both panels, error bars represent one standard deviation from mean DSC across subjects. Thalamic structures are sorted in descending order of mean volume across sequences. For each structure, sequences are color‐coded and sorted in descending order of acquisition time (TA). Thalamic nuclei labels in Table S1. Sequences TA (min:sec): 8:52, MP2RAGE; 6:03, meMPRAGE; 5:32, MPRAGE; 3:40, CSMP2RAGE; 2:04 and 1:14, CSMPRAGE.

Similar articles

Cited by

References

    1. Alonso, J. , Pareto D., Alberich M., et al. 2021. “Quantitative Comparison of Subcortical and Ventricular Volumetry Derived From MPRAGE and MP2RAGE Images Using Different Brain Morphometry Software.” Magnetic Resonance Materials in Physics, Biology and Medicine 34, no. 6: 903–914. - PubMed
    1. Arend, I. , Henik A., and Okon‐Singer H.. 2015. “Dissociating Emotion and Attention Functions in the Pulvinar Nucleus of the Thalamus.” Neuropsychology 29, no. 2: 191–196. - PubMed
    1. Bartzokis, G. , Mintz J., Marx P., et al. 1993. “Reliability of In Vivo Volume Measures of Hippocampus and Other Brain Structures Using MRI.” Magnetic Resonance Imaging 11, no. 7: 993–1006. 10.1016/0730-725x(93)90218-3. - DOI - PubMed
    1. Baum, G. L. , Roalf D. R., Cook P. A., et al. 2018. “The Impact of In‐Scanner Head Motion on Structural Connectivity Derived From Diffusion MRI.” NeuroImage 173: 275–286. - PMC - PubMed
    1. Behrens, T. E. , Johansen‐Berg H., Woolrich M. W., et al. 2003. “Non‐Invasive Mapping of Connections Between Human Thalamus and Cortex Using Diffusion Imaging.” Nature Neuroscience 6, no. 7: 750–757. - PubMed