

Identification of key factors related to digital health observational study adherence and retention by data-driven approaches: an exploratory secondary analysis of two prospective longitudinal studies
- PMID: 39722250
- PMCID: PMC11725373
- DOI: 10.1016/S2589-7500(24)00219-X
Identification of key factors related to digital health observational study adherence and retention by data-driven approaches: an exploratory secondary analysis of two prospective longitudinal studies
Abstract
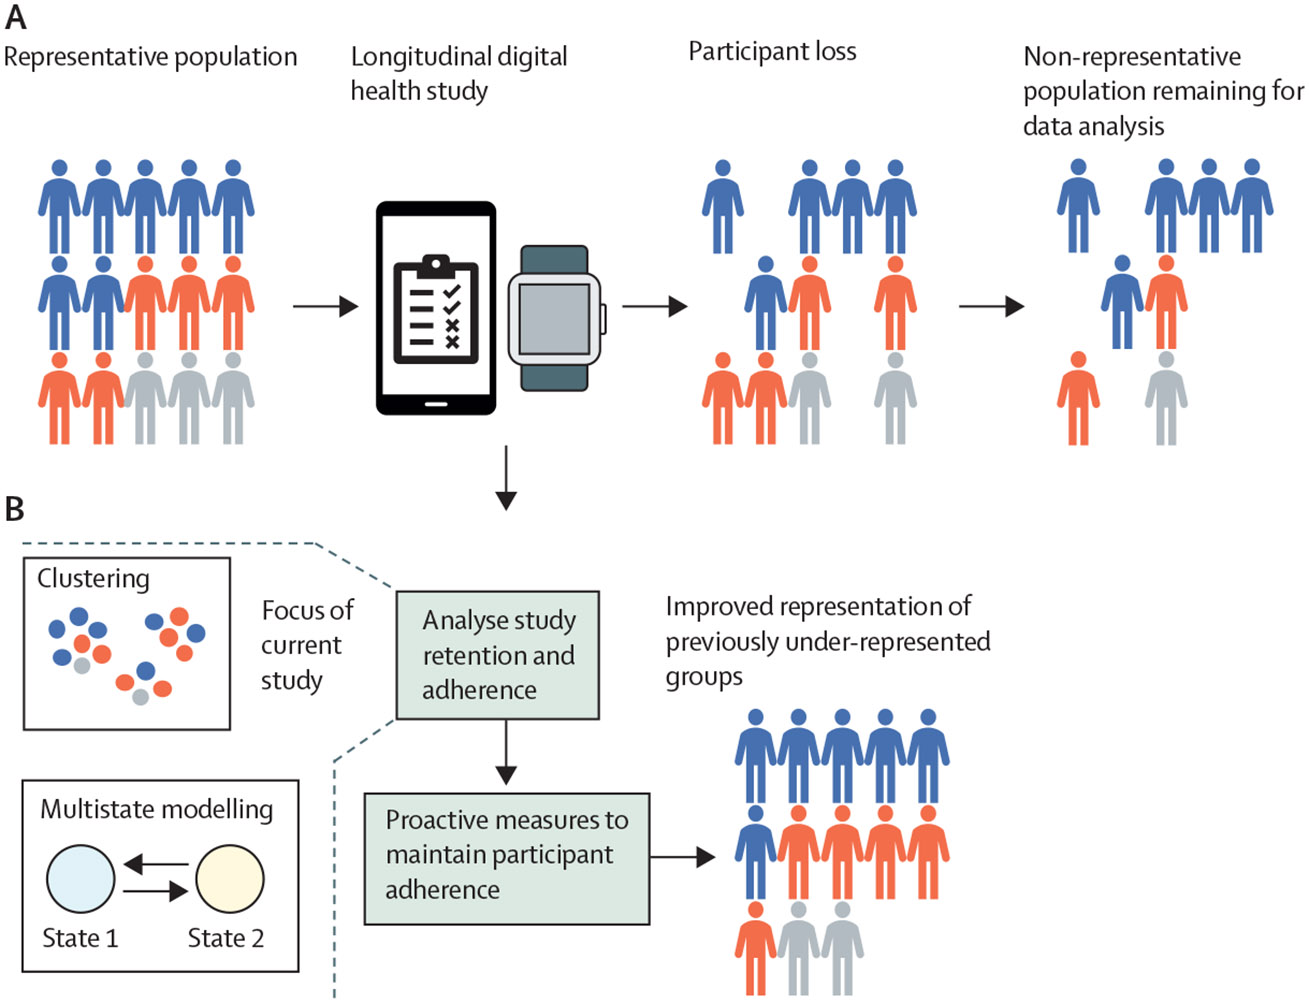
Background: Longitudinal digital health studies combine passively collected information from digital devices, such as commercial wearable devices, and actively contributed data, such as surveys, from participants. Although the use of smartphones and access to the internet supports the development of these studies, challenges exist in collecting representative data due to low adherence and retention. We aimed to identify key factors related to adherence and retention in digital health studies and develop a methodology to identify factors that are associated with and might affect study participant engagement.
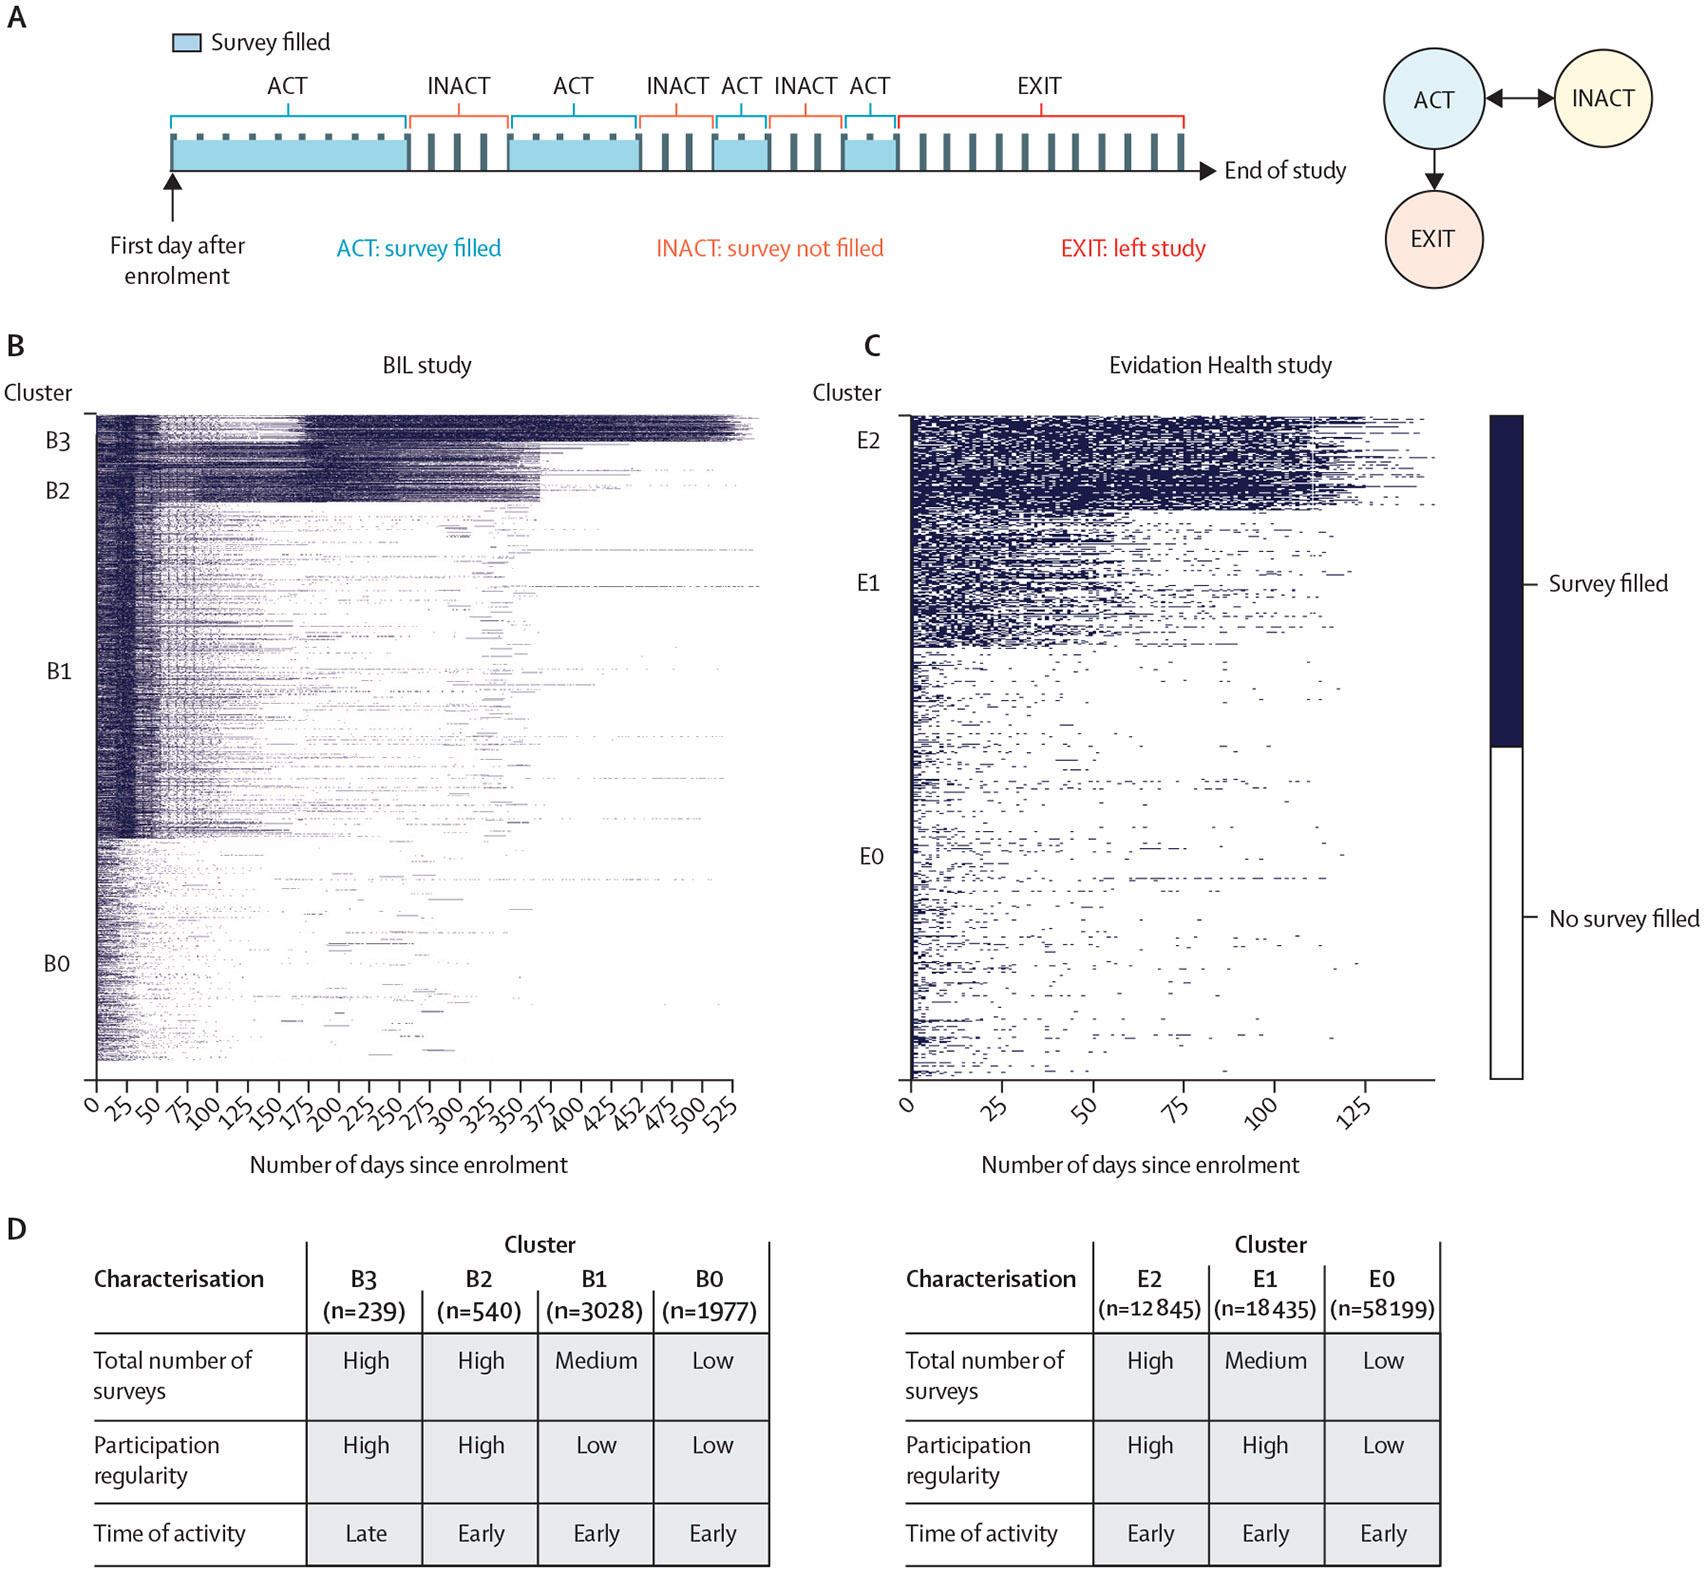
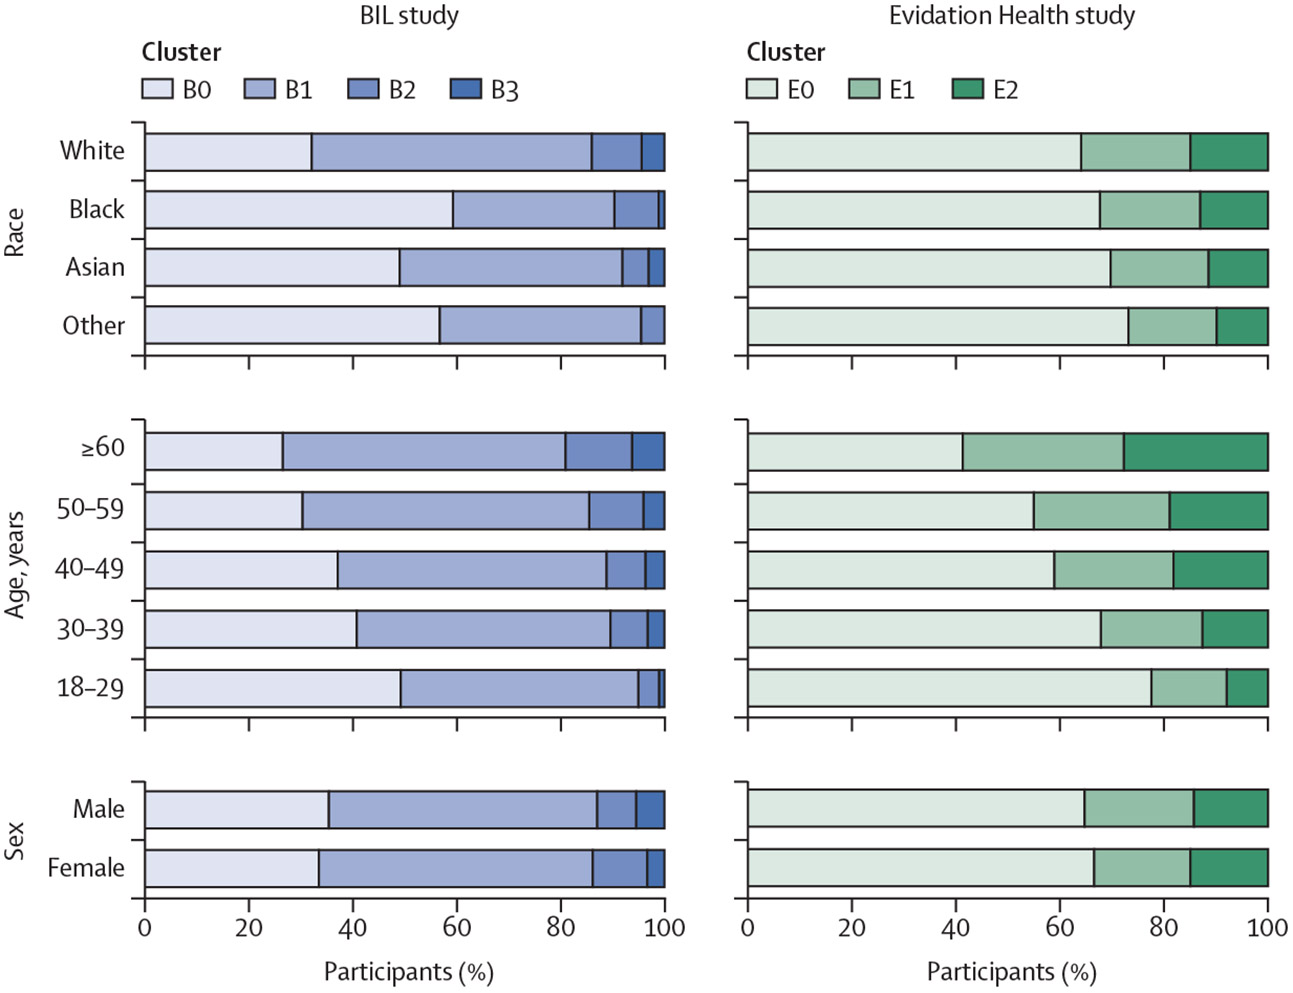
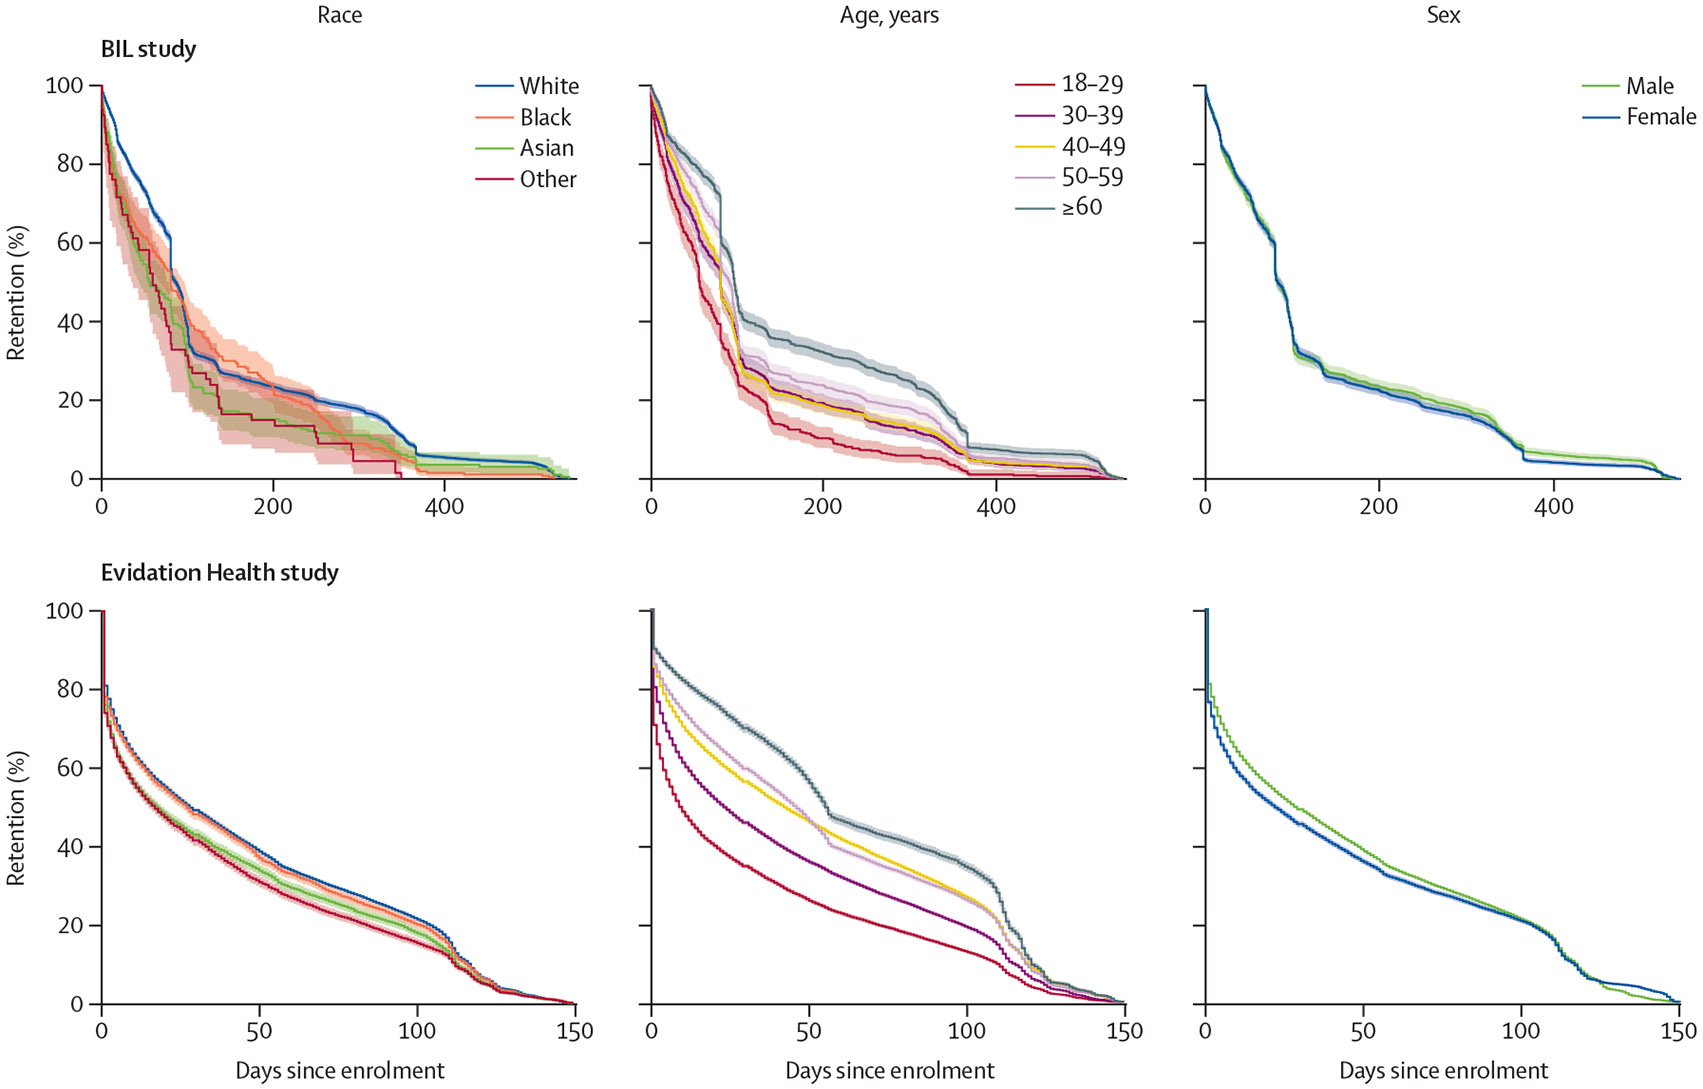
Methods: In this exploratory secondary analysis, we used data from two separate prospective longitudinal digital health studies, conducted among adult participants (age ≥18 years) during the COVID-19 pandemic by the BIG IDEAs Laboratory (BIL) at Duke University (Durham, NC, USA; April 2, 2020 to May 25, 2021) and Evidation Health (San Mateo, CA, USA; April 4 to Aug 31, 2020). Prospective daily or weekly surveys were administered for up to 15 months in the BIL study and daily surveys were administered for 5 months in the Evidation Health study. We defined metrics related to adherence to assess how participants engage with longitudinal digital health studies and developed models to infer how demographic factors and the day of survey delivery might be associated with these metrics. We defined retention as the time until a participant drops out of the study. For the purpose of clustering analysis, we defined three metrics of survey adherence: (1) total number of surveys completed, (2) participation regularity (ie, frequency of filling out surveys consecutively), and (3) time of activity (ie, engagement pattern relative to enrolment time). We assessed these metrics and explored differences by age, sex, race, and day of survey delivery. We analysed the data by unsupervised clustering, survival analysis, and recurrent event analysis with multistate modelling, with analyses restricted to individuals who provided data on age, sex, and race.
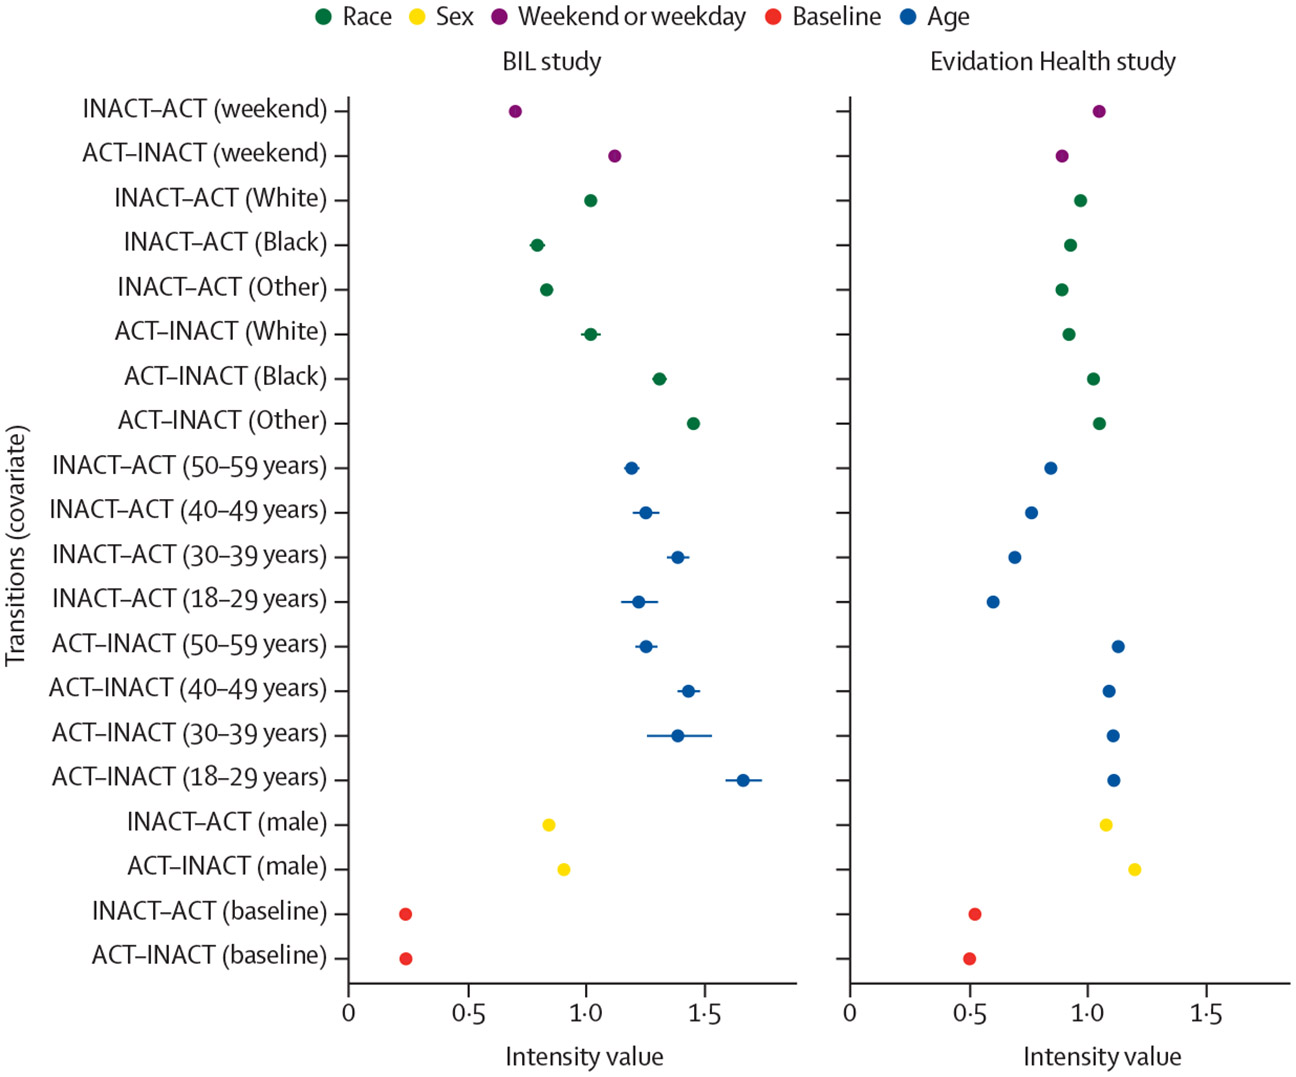
Findings: In the BIL study, 5784 unique participants with the required demographic data completed 388 600 unique daily surveys (mean 67 [SD 90] surveys per participant). In the Evidation Health study, 89 479 unique participants with the required demographic data completed 2 080 992 unique daily surveys (23 [32] surveys per participant). Participants were grouped into adherence clusters based on the three metrics of adherence, and we identified statistically discernible differences in age, race, and sex between clusters. Most of the individuals aged 18-29 years were observed in the clusters with low or medium adherence, whereas the oldest age group (≥60 years) was generally more represented in clusters with high adherence than younger age groups. For retention, survival analysis indicated that 18-29 years was the age group with the highest risk of exiting the study at any given point in time (BIL study, hazard ratio [HR] for 18-29 years vs ≥60 years, 1·69 [95% CI 1·53-1·86; p<0·0001]; Evidation Health study, HR 1·50 [1·47-1·53; p<0·0001]). Sex and race were not discernible predictors of retention in the BIL study. In the Evidation Health study, male participants (vs female participants; HR 0·96 [0·94-0·98]; p<0·0001) and White participants (vs Asian participants; HR 0·96 [0·93-0·98; p=0·0004) had a lower risk of study exit, and Other race participants (vs Asian participants) had a higher risk of study exit (HR 1·10 [1·06-1·14; p<0·0001]). Recurrent event analysis confirmed age as the factor most associated with adherence; for the 18-29 years age group (vs ≥60 years group), the transition intensity from an active to inactive state per day in the BIL study was 1·661 (95% CI 1·606-1·718) and in the Evidation Health study was 1·108 (1·094-1·121). Participation patterns were variable by race and sex between the studies.
Interpretation: Our analyses revealed that age was consistently associated with adherence and retention, with younger participants having lower adherence and higher dropout rates than older participants. Unsupervised clustering and survival analyses are established methods in this field, whereas the use of recurrent event analysis, was, to our knowledge, the first instance of the application of this method to remote digital health data. These methods can help to understand participant engagement in digital health studies, supporting targeted measures to improve adherence and retention.
Funding: US National Science Foundation, US National Institutes of Health, Microsoft AI for Health, Duke Clinical and Translational Science Institute, North Carolina Biotechnology Center, Duke MEDx, Duke Bass Connections, Duke Margolis Center for Health Policy, and Duke Office of Information Technology.
Copyright © 2025 The Author(s). Published by Elsevier Ltd. This is an Open Access article under the CC BY-NC-ND 4.0 license. Published by Elsevier Ltd.. All rights reserved.
Conflict of interest statement
Declaration of interests At the time of writing, JPD received a US National Institutes of Health (NIH) grant (number R01 DK133531) and consulting fees as a consultant for Gold Track. JPD has received honoraria for lectures and support for attending meetings from the American College of Cardiology, the Academy of Managed Care Pharmacy, Shionogi, the American College of Sports Medicine, the International Society for the Measurement of Physical Behaviour, Harvard University, Dartmouth College, the Foundation for the National Institutes of Health, and the Chan Zuckerberg Initiative. JPD was a Scientific Advisor for Veri and was an Associate Editor for npj Digital Medicine. EJD and LF were employees of Evidation Health at the time of data collection and writing. LF is the co-founder of Evidation Health and holds stocks in Evidation Health. IMO is a consultant at Evidation Health. PJC and MMHS declare no competing interests.
Figures
Comment in
-
A long STANDING commitment to improving health care.Lancet Digit Health. 2025 Jan;7(1):e1. doi: 10.1016/j.landig.2024.12.005. Epub 2024 Dec 18. Lancet Digit Health. 2025. PMID: 39701920 No abstract available.
References
-
- Vogels EA. About one-in-five Americans use a smart watch or fitness tracker. Jan 9, 2020. Pew Research Center. https://www.pewresearch.org/fact-tank/2020/01/09/about-one-in-five-ameri... (accessed Sept 16, 2020).
-
- Pew Research Center. Mobile fact sheet. Jan 31, 2024. https://www.pewresearch.org/internet/fact-sheet/mobile/ (accessed June 14, 2024).
-
- Laricchia F. Wearable devices ownership in the United States in 2021, by age. March 10, 2023. https://www.statista.com/statistics/1310364/wearable-devices-ownership-a... (accessed May 25, 2023).
Publication types
MeSH terms
Grants and funding
LinkOut - more resources
Full Text Sources
Medical
Miscellaneous
