. 2024 Dec 11:15:1461682.
doi: 10.3389/fneur.2024.1461682. eCollection 2024.

Developmental deglutition and intrinsic tongue muscle maturation phenotypes in the Ts65Dn mouse model of Down syndrome

Affiliations

Developmental deglutition and intrinsic tongue muscle maturation phenotypes in the Ts65Dn mouse model of Down syndrome

Tiffany J Glass et al. Front Neurol. .

Abstract

Introduction: Down syndrome (DS) is associated with difficulties with feeding during infancy and childhood. Weaning, or transitioning from nursing to independent deglutition, requires developmental progression in tongue function. However, little is known about whether postnatal tongue muscle maturation is impacted in DS. This study tested the hypothesis that the Ts65Dn mouse model of DS has developmental delays in deglutition, comprised of differences in eating and drinking behaviors relative to euploid controls, coinciding with atypical measures of intrinsic tongue muscle microanatomy.

Methods: The Ts65Dn mouse model of DS and euploid controls were evaluated at 7 days of age (p7; nursing), p21 (weaning), and p35 (mature deglutition) (n = 13-18 mice per group). Eating behavior, drinking behavior, and body weight changes were quantified in p21 and p35 mice through the use of automated monitoring over 24 h. Intrinsic tongues of mice at all three ages were sectioned and stained to permit quantification of the sizes of the four major intrinsic tongue muscles. Transverse intrinsic tongue muscles were evaluated for myofiber size (average myofiber cross sectional area (CSA) of all fibers, MyHC2a fibers, MyHC 2b fibers, and minimum Feret fiber diameter), and percentage of MyHC isoforms (%MyHC2a + fibers, and %MyHC 2b + fibers) in anterior, middle, and posterior regions.

Results: Ts65Dn showed significant differences from euploid in deglutition measures. Compared to euploid, Ts65Dn also showed differences in intrinsic tongue muscle microanatomy and biology. Specifically, Ts65Dn intrinsic tongues had smaller transverse muscle myofiber size measures than control in the anterior and middle tongue, but not in the posterior tongue.

Conclusion: Differences in intrinsic tongue muscles coincide with feeding phenotypes in the Ts65Dn mouse model of DS.

Keywords: Down syndrome; Ts65Dn; deglutition; feeding; intrinsic tongue; maturation; mouse; weaning.


Conflict of interest statement

The authors declare that the research was conducted in the absence of any commercial or financial relationships that could be construed as a potential conflict of interest.

Figures
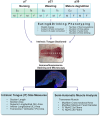
Figure 1
Figure 1
Experiment design. Eu = euploid, Ts = Ts65Dn, p = postnatal day of age, M = male, F = female, MyHC = Myosin Heavy Chain Isoform.
Figure 2
Figure 2
Manual image segmentation for intrinsic tongue muscle measurements. Left panel: Inset magnifications of the superior longitudinal (SL), inferior longitudinal (IL), transverse / verticalis (T/V) muscles show differences of myofiber orientation and staining properties of each muscle. Right panel: Microscopy images of intrinsic muscles were digitally segmented to permit quantification of length and muscle areas.
Figure 3
Figure 3
Quantitative image analysis strategy for transverse muscles from intrinsic tongue tissue sections. (A) Intrinsic tongue sections are imaged in their entirety. For the purposes of analyses, the anterior border of the intrinsic tongue was defined at the tongue tip (1), and the posterior border of the intrinsic tongue (2) was defined as the location where the dorsal epithelium transitioned to smooth mucosa, and/or at the location of the sublingual salivary glands. These landmarks were used to set the region which was manually divided into three image files; anterior, middle, and posterior. (A1) Zoomed image excerpt from the middle region of intrinsic tongue shown in panel A. Asterisks (*) indicate the transverse muscle columns, alternating with verticalis muscle fibers indicated with arrows. (B) Each image file was manually processed to isolate myofibers of the transverse muscles, and to remove areas of mechanical artifacts. (B1) Zoomed image excerpt from the middle region of the intrinsic tongue shown in panel B. (C) The Matlab application SMASH was used to identify myofibers, shown here in arbitrary pseudocolor. (C1) Zoomed excerpt from the middle region of the intrinsic tongue shown in panel C.
Figure 4
Figure 4
Ts65Dn have smaller body sizes than euploid, and weaning in Ts65Dn is associated with rapid weight loss. (A) Ts65Dn are smaller than Euploid, particularly in females at p21 and p35. n = 13/group. (B) Ts65Dn lose body weight at p21 in a 24-h period at weaning, but do not lose body weight when evaluated over a 24-h period at p35. Ts65Dn p21 males and females n = 16/group, Euploid p21 male n = 16/group, females 14/group.Ts65Dn p35 male n = 14/group, females 12/group. Euploid p35 males and females n = 16/group. Each data point indicates one mouse. Bars show the group mean. * = p < 0.05, ** = p < 0.01, *** = p < 0.001.
Figure 5
Figure 5
Ts65Dn show feeding phenotypes at p21 (weaning) and p35 (mature deglutition). (A) Behavior related to eating and drinking was continuously monitored over 24 h and consolidated into eight consecutive 3-h trials for analysis. Data collection began in the dark cycle, transitioned to 12 h of a light cycle, and ended in the dark cycle. Values for males and females are pooled in this figure panel. Lines and error bars indicate the group means and SD. The x-axis is shaded to indicate the dark cycle (black), and trials that spanned the transition from dark to light cycle (gray). (B) Ts65Dn consume less food than euploid controls during a 24-h period at weaning, as well as at p35-36. Mice at p21 consume less food than mice at p35, and female mice consume less food than male mice. (C) Ts65Dn access food significantly more often than euploid. (D) Ts65Dn spend significantly more time eating than euploid controls. Each data point was generated by two mice of the same age, sex, and genotype. Sample sizes: p21: Ts65Dn M = 14, F = 16, p21 Euploid M = 16, F = 16. P35: Ts65Dn M = 14, F = 14, p35 Euploid M = 16, F = 14. * = p < 0.05 ** = p < 0.01, *** = p < 0.001.
Figure 6
Figure 6
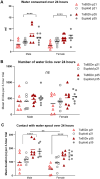
Drinking behavior at p21 (weaning) and p35 (mature deglutition). Each data point was generated by two mice of the same age, sex, and genotype. (A) p21 mice consume less water than p35 mice controls during a 24-h period. (B) There are no significant differences between groups in the number of water licks during drinking over a 24-h period. (C) p21 mice spend less time in contact with the water spout than p35 mice, and female mice spend less time in contact with the water spout than male mice. Bars indicate the group means. Sample sizes: p21: Ts65Dn M = 14, F = 16, p21 Euploid M = 18, F = 18. P35: Ts65Dn M = 18, F = 18, p35 Euploid M = 16, F = 16. ** = p < 0.01, **** = p < 0.0001.
Figure 7
Figure 7
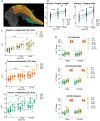
Sizes of Intrinsic Tongue (IT) muscles during postnatal development. (A) superior longitudinal (SL), Inferior longitudinal (IL), Transverse / Verticalis (T/V) muscles, IT length, and total IT area were manually measured in one tissue section from each mouse. Three-color microscopy images stained for MyHC 2a, 2b, and laminin were analyzed in color, but this example is shown in grayscale for clarity to illustrate the locations of the IT muscles. (B) Ts65Dn showed smaller values for IT length and IT area than euploid. (C) SL, T/V, and IL muscles are shown at each age point analyzed. (D) IT muscle sizes are shown normalized to total IT area. Each data point indicates analysis from one tissue section of one mouse. P7 sample sizes: Ts M = 11, Ts F = 12, Eu M = 10, Eu F = 10. P21 sample sizes: Ts M = 10, Ts F = 12, Eu M = 12, Eu F = 11. P35 sample sizes: Ts M = 10, Ts F = 11, Eu M = 12, Eu F = 10. Ts = Ts65Dn, Eu = Euploid, M = male, F = female. Bars show the mean. * = p < 0.05, ** = p < 0.01, *** = p < 0.001.
Figure 8
Figure 8
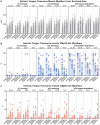
Quantification of myofiber measures in the anterior, middle, and posterior regions of the intrinsic tongue transverse muscle in Ts65Dn and euploid controls. (A) Cross-sectional area (CSA) is significantly different with genotype, age, and anatomical region. (B) The percentage of myofibers that express MyHC 2b are significantly different with age and anatomical region. (C) The percentage of myofibers that express MyHC 2a are significantly different with genotype, age, and anatomical region. Each data point indicates the mean value of myofibers from one tissue section of one mouse. Bars indicate the group mean and SD. Eu = euploid, Ts = Ts65Dn, M = male, F = female. Sample sizes: p7: Ts M = 12, Ts F = 12, Eu M = 12, Eu F = 13. p21: Ts M = 12, Ts F = 12, Eu M = 14, Eu F = 12. p35: Ts M = 13, Ts F = 12, Eu M = 13, Eu F = 11.
Figure 9
Figure 9
Representative images of intrinsic tongues of Ts65Dn and euploid controls. In each panel, one entire tissue section is shown above (scale bar indicates 1 mm), and enlarged excerpts from the locations indicated by white boxes are shown below (scale bar indicates 50 μm). (A) Intrinsic tongue sections from p7 pups reveal predominance of MyHC 2a staining primarily in the posterior regions, and shows smaller myofibers in the anterior regions. (B) Intrinsic tongue sections from p21-22 pups reveal onset of MyHC 2b staining in the anterior tongue at this age, retention of MyHC 2a staining in posterior tongue, and smaller myofibers in the anterior tongue regions. (C) Intrinsic tongue sections from p35-36 mice reveal expansion of MyHC 2b staining to middle and posterior regions, relative loss of MyHC 2a, and smaller myofibers in the anterior tongue regions. For clarity, the intensity of red and blue signal has been doubled relative to green signal in each intrinsic tongue section micrograph in the top panels of A–C.

Similar articles

References

    1. Vorperian HK, Kent RD, Lee Y, Buhr KA. Vowel production in children and adults with Down syndrome: fundamental and formant frequencies of the corner vowels. J Speech Lang Hear Res Apr. (2023) 66:1208–39. doi: 10.1044/2022_JSLHR-22-00510, PMID: - DOI - PMC - PubMed
    1. Wild A, Vorperian HK, Kent RD, Bolt DM, Austin D. Single-word speech intelligibility in children and adults with Down syndrome. Am J Speech Lang Pathol. (2018) 27:222–36. doi: 10.1044/2017_AJSLP-17-0002, PMID: - DOI - PMC - PubMed
    1. Kent RD, Vorperian HK. Speech impairment in Down syndrome: a review. J Speech Lang Hear Res. (2013) 56:178–210. doi: 10.1044/1092-4388(2012/12-0148), PMID: - DOI - PMC - PubMed
    1. Donnelly LF, Shott SR, LaRose CR, Chini BA, Amin RS. Causes of persistent obstructive sleep apnea despite previous tonsillectomy and adenoidectomy in children with Down syndrome as depicted on static and dynamic cine MRI. AJR Am J Roentgenol. (2004) 183:175–81. doi: 10.2214/ajr.183.1.1830175, PMID: - DOI - PubMed
    1. Mizuno K, Ueda A. Development of sucking behavior in infants with Down’s syndrome. Acta Paediatr. (2001) 90:1384–8. doi: 10.1111/j.1651-2227.2001.tb01600.x, PMID: - DOI - PubMed

LinkOut - more resources