. 2024 Dec 18;8(12):3290-3302.
doi: 10.1016/j.joule.2024.09.012.

Assessing inequities in electrification via heat pumps across the US

Affiliations

Assessing inequities in electrification via heat pumps across the US

Morgan R Edwards et al. Joule. .

Abstract

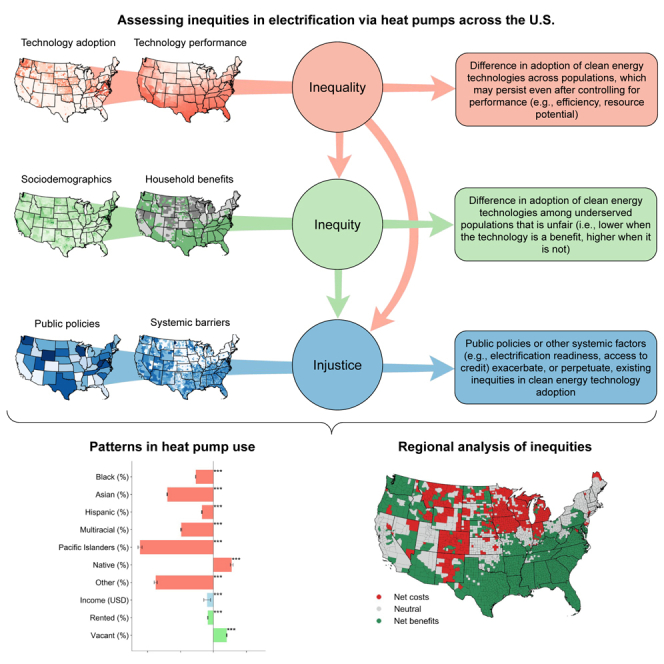
Heat pumps are an energy-efficient and increasingly cost-effective solution for reducing greenhouse gas emissions in the building sector. However, other clean energy technologies, such as rooftop solar, are less likely to be adopted in underserved communities, and thus policies incentivizing their adoption may funnel support to well-resourced communities. Unlike previously studied technologies, the effects of heat pumps on household energy bills may be positive or negative depending on local climate, energy costs, building features, and other factors. Here, we propose a framework for assessing heat pump inequities across the US. We find that households in communities of color and with higher percentages of renters are less likely to use heat pumps across the board. Moreover, communities of color are least likely to use heat pumps in regions where they are most likely to reduce energy bills. Public policies must address these inequities to advance beneficial electrification and energy justice.

Keywords: building electrification; energy justice; heat pumps.


Conflict of interest statement

The authors declare no competing interests.

Figures

None
Graphical abstract
Figure 1
Figure 1
Framework for assessing inequalities, inequities, and injustices in clean energy technologies whose benefits to households may be positive or negative First, we use spatial data on different heating technologies and their performance to assess inequalities. Second, we add in data on sociodemographics and the household benefits to determine if these inequalities are also inequities. Third, this framework is applied to identify injustices where public policies or other systemic barriers exacerbate or perpetuate inequities. We apply this framework to assess inequalities and inequities in heat pump use across the US.
Figure 2
Figure 2
Patterns in heating technology use across the US (A) Percentage of households with a heat pump at the census-tract level from the Zillow Transaction and Assessment Database (ZTRAX) in 2020. (B–D) Household heating technology at the county level from the American Community Survey (ACS) 5-year (2016–2020) data: (B) natural gas, (C) electricity (which includes heat pumps and electric resistance heating), and (D) other fuels. Note that some counties do not report heating technology in ZTRAX, represented by light blue shaded areas. We discuss missing data in the experimental procedures and Note S4; Section B, supplemental information.
Figure 3
Figure 3
Percentage change in odds of heat pump use given a 10% increase in control variables and equity-related variables for the logistic regression (A and B) Percentage change in odds for (A) control variables and (B) equity-related variables. Descriptive statistics for each variable are provided in Table S1; Section B, supplemental information. The pseudo R2 value for the logistic regression is 0.3333. Symbols indicate: ∗∗∗ p < 0.01, ∗∗ p < 0.05, ∗ p < 0.1. Note that the percentage of vacant units is included in (B) to have complete representation of occupancy statuses (i.e., owner-occupied, rented, and vacant, with owner-occupied omitted due to collinearity). Error bars indicate a 95% confidence interval.
Figure 4
Figure 4
Nonlinear relationships between heat pump use, income, and renter status across racial/ethnic groups (A and B) Relationship between (A) median annual household income (B) percentage of houses rented and state-normalized heat pump installations by racial and ethnic majority census tract. Lines show LOESS (locally estimated scatterplot smoothing) curves, and shaded regions show 90% confidence intervals (see experimental procedures for further details).
Figure 5
Figure 5
Inequities in heat pump use across the US (A and B) (A) Counties where heat pump use is a net benefit, neutral, or net cost for households in terms of changes in energy bills and (B) primary heating source. (C–E) Percentage change in odds for logistic regression results for regions where heat pumps are a (C) net benefit, (D) neutral, and (E) net cost. The pseudo R2 values for the logistic regressions are 0.3189, 0.1953, and 0.2642 for the net benefits, neutral, and net costs regions, respectively. Symbols indicate: ∗∗∗ p < 0.01, ∗∗ p < 0.05, ∗ p < 0.1. No symbol indicates p > 0.1. Error bars indicate a 95% confidence interval.

Similar articles

Cited by

References

    1. Klemun M.M., Edwards M.R., Trancik J.E. Research priorities for supporting subnational climate policies. WIREs Clim. Change. 2020;11 doi: 10.1002/wcc.646. - DOI
    1. IPCC Global Warming of 1.5C. An IPCC Special Report on the impacts of global warming of 1.5C above pre-industrial levels and related global greenhouse gas emission pathways. Spec. Rep. Glob. Warm. 15oC. 2018 https://www.ipcc.ch/sr15/
    1. Alvarez R.A., Zavala-Araiza D., Lyon D.R., Allen D.T., Barkley Z.R., Brandt A.R., Davis K.J., Herndon S.C., Jacob D.J., Karion A., et al. Assessment of methane emissions from the U.S. oil and gas supply chain. Science. 2018;361:186–188. doi: 10.1126/science.aar7204. - DOI - PMC - PubMed
    1. Edwards M.R., Giang A., Macey G.P., Magavi Z., Nicholas D., Ackley R., Schulman A. Repair Failures Call for New Policies to Tackle Leaky Natural Gas Distribution Systems. Environ. Sci. Technol. 2021;55:6561–6570. doi: 10.1021/acs.est.0c07531. - DOI - PubMed
    1. Edwards M.R., Trancik J.E. Climate impacts of energy technologies depend on emissions timing. Nat. Clim. Chang. 2014;4:347–352. doi: 10.1038/nclimate2204. - DOI

LinkOut - more resources