

Dynamic survival prediction of end-stage kidney disease using random survival forests for competing risk analysis
- PMID: 39722823
- PMCID: PMC11668785
- DOI: 10.3389/fmed.2024.1428073
Dynamic survival prediction of end-stage kidney disease using random survival forests for competing risk analysis
Abstract
Background and hypothesis: A static predictive model relying solely on baseline clinicopathological data cannot capture the heterogeneity in predictor trajectories observed in the progression of chronic kidney disease (CKD). To address this, we developed and validated a dynamic survival prediction model using longitudinal clinicopathological data to predict end-stage kidney disease (ESKD), with death as a competing risk.
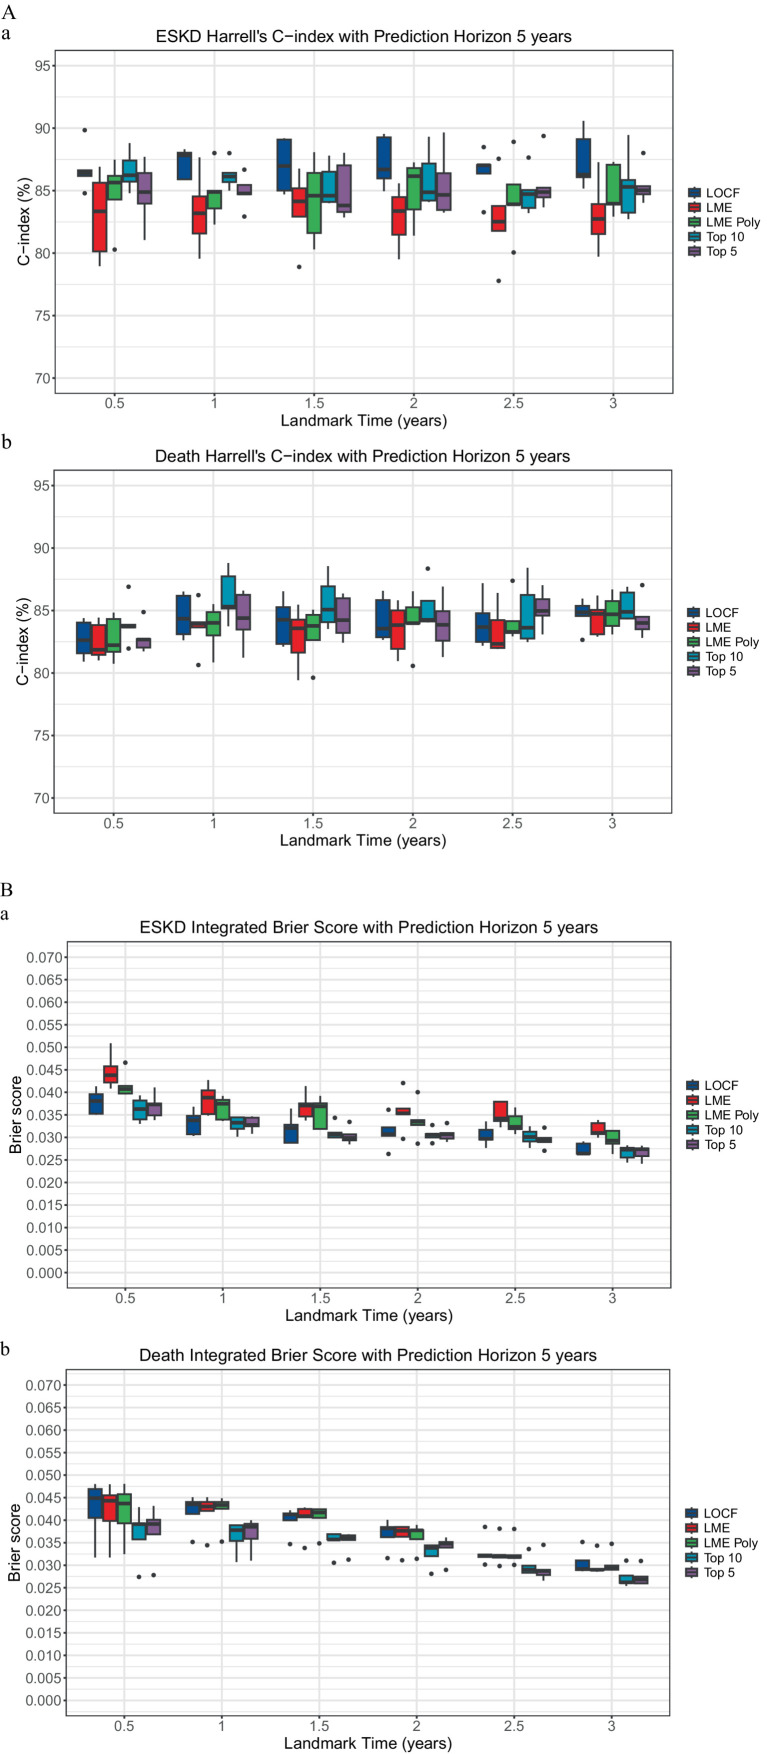
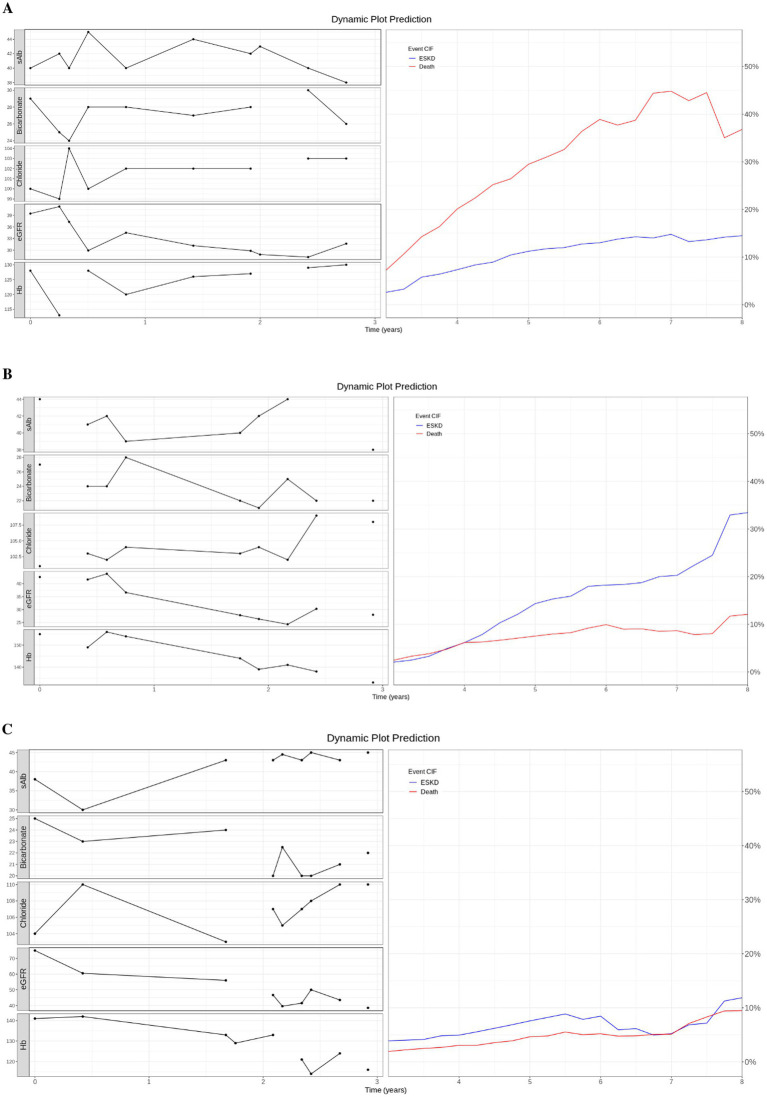
Methods: We trained a sequence of random survival forests using a landmarking approach and optimized the model with a pre-specified prediction horizon of 5 years. The predicted cumulative incidence function (CIF) values were used to generate a personalized dynamic prediction plot.
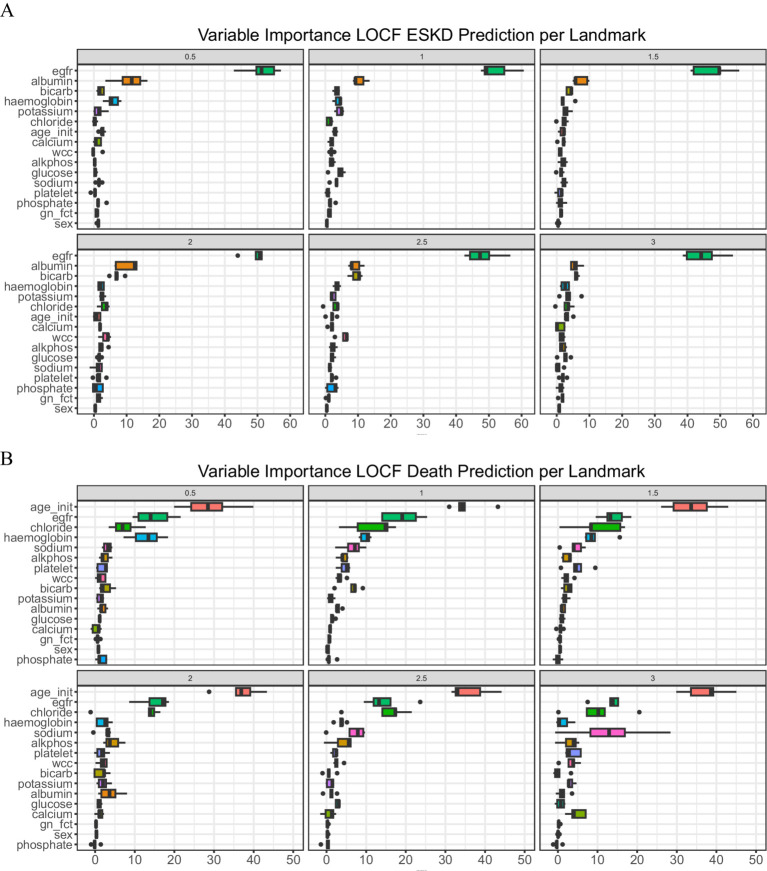
Results: The model was developed using baseline demographics and 13 longitudinal clinicopathological variables from 4,950 patients. Variable importance analysis for ESKD and death informed the creation of a sequence of reduced models that utilized six key variables: age, serum albumin, bicarbonate, chloride, eGFR, and hemoglobin. The models demonstrated robust predictive performance, with a median concordance index of 84.84% for ESKD and 84.1% for death. The median integrated Brier scores were 0.03 for ESKD and 0.038 for death across all landmark times. External validation with 8,729 patients confirmed these results.
Conclusion: We successfully developed and validated a dynamic survival prediction model using common longitudinal clinicopathological data. This model predicts ESKD with death as a competing risk and aims to assist clinicians in dialysis planning for patients with CKD.
Keywords: competing risk; dynamic prediction model; end-stage kidney disease; landmarking; random survival forests.
Copyright © 2024 Christiadi, Chai, Chuah, Loong, Andrews, Chakera, Walters and Jiang.
Conflict of interest statement
The authors declare that the research was conducted in the absence of any commercial or financial relationships that could be construed as a potential conflict of interest.
Figures
References
-
- Wang H, Naghavi M, Allen C, Barber RM, Bhutta ZA, Carter A, et al. . Global, regional, and national life expectancy, all-cause mortality, and cause-specific mortality for 249 causes of death, 1980–2015: a systematic analysis for the global burden of disease study 2015. Lancet. (2016) 388:1459–544. doi: 10.1016/S0140-6736(16)31012-1, PMID: - DOI - PMC - PubMed
LinkOut - more resources
Full Text Sources
Research Materials
Miscellaneous