Clinical Significance of Serum Bile Acid Profiles in Fatty Liver
- PMID: 39722833
- PMCID: PMC11668968
- DOI: 10.2147/DMSO.S494810
Clinical Significance of Serum Bile Acid Profiles in Fatty Liver
Abstract
Objective: This study aims to investigate the alterations in serum bile acid profiles among individuals with fatty liver (including non-alcoholic fatty liver (NAFL) and alcoholic fatty liver (AFL) and evaluate their clinical significance when combined with liver enzyme levels.
Methods: A cohort of 110 individuals with fatty liver (including non-alcoholic fatty liver 58 individuals and alcoholic fatty liver 52 individuals) was selected from the Department of Gastroenterology at Wenzhou People's Hospital between January 2021 and December 2022, while a control group of 66 healthy individuals was recruited from the hospital's health examination center during the same period. Clinical data and blood samples were collected from all participants. Serum bile acid profiles were quantified using ultra-performance liquid chromatography coupled with tandem mass spectrometry (UPLC-MS/MS). Statistical analysis was conducted in conjunction with liver enzyme indicators.
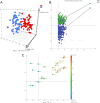
Results: In the NAFL group, GCA, TCA, and TCDCA levels were significantly elevated compared to the control group, with GCA (AUC 0.754, sensitivity 0.707, specificity 0.712), TCA (AUC 0.770, sensitivity 0.724, specificity 0.712), and TCDCA (AUC 0.782, sensitivity 0.810, specificity 0.652) showing strong diagnostic value. In the AFL group, TCDCA, TCA, GCA, TUDCA, and GUDCA were significantly elevated, with AUC values ranging from 0.848 to 0.912. Among these, TUDCA had the highest sensitivity (0.885) and specificity (0.773) for AFL diagnosis. TUDCA (sensitivity 0.615, specificity 0.897) was the key bile acid distinguishing AFL from NAFL, with an optimal cut-off of 36.33 nmol/L. These bile acids show significant diagnostic potential for differentiating NAFL and AFL.
Conclusion: The bile acid profiles in both NAFL and AFL patients show changes, which hold potential clinical significance and may serve as serum biomarkers to differentiate NAFL from AFL.
Keywords: alcoholic fatty liver; bile acid profile; diagnosis; non-alcoholic fatty liver.
© 2024 Sun et al.
Conflict of interest statement
The authors declare that they have no conflict of interests.
Figures


Similar articles
-
[Characteristics and diagnostic value of serum bile acids profile in pregnant women with intrahepatic cholestasis of pregnancy and asymptomatic hypercholanemia of pregnancy].Zhonghua Fu Chan Ke Za Zhi. 2024 Apr 25;59(4):270-278. doi: 10.3760/cma.j.cn112141-20231004-00126. Zhonghua Fu Chan Ke Za Zhi. 2024. PMID: 38644273 Chinese.
-
Serum Bile Acid Profiles Improve Clinical Prediction of Nonalcoholic Fatty Liver in T2DM patients.J Proteome Res. 2021 Aug 6;20(8):3814-3825. doi: 10.1021/acs.jproteome.1c00104. Epub 2021 May 27. J Proteome Res. 2021. PMID: 34043368
-
Targeted Plasma Bile Acid Metabolomic Analysis in Metabolic Dysfunction-Associated Steatohepatitis and Alcoholic Hepatitis.Biomedicines. 2024 Dec 31;13(1):78. doi: 10.3390/biomedicines13010078. Biomedicines. 2024. PMID: 39857662 Free PMC article.
-
miRNAs in patients with non-alcoholic fatty liver disease: A systematic review and meta-analysis.J Hepatol. 2018 Dec;69(6):1335-1348. doi: 10.1016/j.jhep.2018.08.008. Epub 2018 Aug 22. J Hepatol. 2018. PMID: 30142428
-
Total serum bile acids or serum bile acid profile, or both, for the diagnosis of intrahepatic cholestasis of pregnancy.Cochrane Database Syst Rev. 2019 Jul 5;7(7):CD012546. doi: 10.1002/14651858.CD012546.pub2. Cochrane Database Syst Rev. 2019. PMID: 31283001 Free PMC article.
References
-
- National Workshop On Fatty Liver And Alcoholic Liver Disease Chinese Society Of Hepatology, Chinese Medical Association Fatty Liver Expert Committee Chinese Medical Doctor Association. Guidelines for prevention and treatment of non-alcoholic fatty liver disease (2018 Update). Infect Dis Inform. 2018;31(05):393–402.
-
- Hao M, Zhao MT, Tong HJ, et al. Ultra-performance liquid chromatography-quadrupole/time-of-flight mass spectrometry based bile and urine metabonomics study on the ameliorative effects of curcuma wenyujin rhizoma on acute blood stasis in rats. World J Tradit Chin Med. 2022;8:141–152. doi:10.4103/wjtcm.wjtcm_55_21 - DOI
LinkOut - more resources
Full Text Sources

