. 2024 Dec 11:11:1524827.
doi: 10.3389/fmolb.2024.1524827. eCollection 2024.

Integrated multi-omics analysis describes immune profiles in ischemic heart failure and identifies PTN as a novel biomarker

Affiliations

Integrated multi-omics analysis describes immune profiles in ischemic heart failure and identifies PTN as a novel biomarker

Ting Xiong et al. Front Mol Biosci. .

Abstract

Introduction: Heart failure is a leading global cause of mortality, with ischemic heart failure (IHF) being a major contributor. IHF is primarily driven by coronary artery disease, and its underlying mechanisms are not fully understood, particularly the role of immune responses and inflammation in cardiac muscle remodeling. This study aims to elucidate the immune landscape of heart failure using multi-omics data to identify biomarkers for preventing cardiac fibrosis and disease progression.

Methods: We utilized multi-omics data to elucidate the intricate immune landscape of heart failure at various regulatory levels. Given the substantial size of our transcriptomic dataset, we used diverse machine learning techniques to identify key mRNAs. For smaller datasets such as our proteomic dataset, we applied multilevel data cleansing and enhancement using principles from network biology. This comprehensive analysis led to the development of a scalable, integrated -omics analysis pipeline.

Results: Pleiotrophin (PTN) had shown significant upregulation in multiple datasets and the activation of various molecules associated with dysplastic cardiac remodeling. By synthesizing these data with experimental validations, PTN was identified as a potential biomarker.

Discussion: The present study not only provides a comprehensive perspective on immune dynamics in IHF but also offers valuable insights for the identification of biomarkers, discovery of therapeutic targets, and development of drugs.

Keywords: PTN; biomarker; immune response; ischemic heart failure; multi-omics.


Conflict of interest statement

The authors declare that the research was conducted in the absence of any commercial or financial relationships that could be construed as a potential conflict of interest.

Figures

FIGURE 1
FIGURE 1
The overall flowchart. DEMs, Differentially expressed mRNAs; DEPros, Differentially expressed proteins; DEIMs, Differentially expressed immune mRNAs; DEIPros, Differentially expressed immune proteins; LASSO, Least absolute shrinkage and selective operator; RFE, Recursive feature elimination; GLM, Generalized linear model; SVM, Supporting vector machine; GBM, Gradient boost machine; RF, Random forest; NPPA, Natriuretic peptide type A; PTN, Pleiotrophin; LTBP2, Latent transforming growth factor beta binding protein 2; OGN, Osteoglycin.
FIGURE 2
FIGURE 2
Differential expression and enrichment analysis in IHF. (A) Principal component analysis (PCA): Data from merged datasets GSE5406_GSE57338, with batch effects removed, projected onto two dimensions (Dim1 and Dim2). Blue markers represent sample groups from GSE5406, and yellow markers represent sample groups from GSE57338. (B) Differential expression analysis: Display of log2 fold change (|log2FC|) and -Log10 P-values (Padj) for each mRNA comparing IHF to non-failure samples. The threshold of |log2FC| >0.5 and Padj <0.01 were used to obtain DEMs. Gray markers indicate normally expressed mRNAs, blue markers indicate downregulated mRNAs, and yellow markers indicate upregulated mRNAs. Several key gene names were marked, including SERPINA3, PLA2G2A, PTN, OGN, LTBP2 and NPPA. (C) Pathway enrichment analysis: Bar plot representing enriched pathways among DEMs. Red, green, and purple markers highlight annotations from biological process (BP), cellular component (CC), and molecular function (MF) in GO, respectively. Blue markers indicate annotations from KEGG analysis. (D) Intersection analysis: Visualization of the overlap between DEMs and immune-related genes. IHF, ischemic heart failure; DEMs, Differentially expressed mRNAs; GO, Gene ontology; KEGG, Kyoto encyclopedia of genes and genomes.
FIGURE 3
FIGURE 3
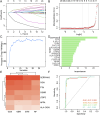
Feature selection of the candidate DEIMs. (A) Variation coefficient for each variable during the LASSO regression. (B) Cross-validation for penalty parameter selection. (C) Accuracy variation with the count of total variables during RFE. (D) Importance of each optimal variable screened using RFE. (E) Prediction performance and AUC value of each intersected candidate DEIM using four algorithms, including GLM, SVM, GBM, and RF. (F) ROC of the candidate DEIM set, with each color representing GLM, SVM, GBM, and RF, respectively. DEIMs, Differentially expressed immune mRNAs; LASSO, Least absolute shrinkage and selective operator; RFE, Recursive feature elimination; GLM, Generalized linear model; SVM, Supporting vector machine; GBM, Gradient boost machine; RF, Random forest; ROC, Receiver operating characteristic; AUC, Area under the curve.
FIGURE 4
FIGURE 4
External validation of candidate DEIMs. (A–F) The expression levels of the seven candidate mRNAs (NPPA, LTBP2, OSMR, OGN, HLA-DQA1, PTN and SERPINA3) were assessed in six datasets (GSE5406_GSE57338, GSE48166, GSE1145, GSE46224, GSE116250, and GSE79962). The term “GSE5406_GSE57338”refers to the combined data from GSE5406 and GSE57338. IHF refers to patients with ischemic heart failure, whereas control refers to samples from healthy individuals.
FIGURE 5
FIGURE 5
The single-cell dataset analysis of four key DEIMs was conducted in IHF and non-failure controls. (A) The UMAP plot indicates the separation of 4,933 cells into nine distinct subtypes. (B) Each cell population was accompanied by a corresponding sample statement. (C–F) Violin plots effectively demonstrated the cell-specific expression patterns of the four key DEIMs (OGN, LTBP2, PTN and NPPA). DEIMs, Differentially expressed immune mRNAs.
FIGURE 6
FIGURE 6
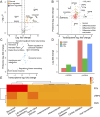
Molecular expression and functional enrichment of hub DEIMs at the transcriptomic and proteomic levels. (A) The volcano plot of protein distribution by comparing IHF samples with non-failure samples, based on the log2 fold change and the negative log10 P-values of each protein. The grey icon represents the normal protein, the blue icon represents the downregulated protein, and the yellow icon indicates the upregulated protein. (B) The common differentially expressed molecules at the transcriptomic and proteomic levels. (C) Common enriched pathway at the transcriptomic and proteomic levels. (D) The log2 fold change of the hub molecules at the mRNA and protein levels. (E) The disease-specific score of the hub immune molecule is indicated by color, which represents the DisGeNET ranking for each molecule.
FIGURE 7
FIGURE 7
The expression of PTN was upregulated in IHF. (A) The Masson’s staining of myocardial collagen fibers was performed in IHF and control samples. The corresponding graphs present the analysis of the percentage of myocardial collagen fiber area. (B) IHC staining and (C) Western blotting indicate an increased expression of PTN in IHF samples compared to controls. Densitometric analysis and quantification of integrated optical density (IOD) were presented in the corresponding graphs. Scale bar: 100 μm. The Western blotting presented in this figure has undergone brightness adjustments to the background for improved clarity, without altering the relative intensities of the bands. P- values were calculated using Mann–Whitney U test and Student’s t-test. *p < 0.05, 0.05 < **p < 0.001, ***p < 0.001. IHF, Ischemic heart failure; IHC, Immunohistochemistry.

Similar articles

Cited by

References

    1. Bader G. D., Hogue C. W. (2003). An automated method for finding molecular complexes in large protein interaction networks. BMC Bioinforma. 4, 2. 10.1186/1471-2105-4-2 - DOI - PMC - PubMed
    1. Barallobre-Barreiro J., Radovits T., Fava M., Mayr U., Lin W. Y., Ermolaeva E., et al. (2021). Extracellular matrix in heart failure: role of ADAMTS5 in proteoglycan remodeling. Circulation 144, 2021–2034. 10.1161/CIRCULATIONAHA.121.055732 - DOI - PMC - PubMed
    1. Barrett T., Wilhite S. E., Ledoux P., Evangelista C., Kim I. F., Tomashevsky M., et al. (2013). NCBI GEO: archive for functional genomics data sets--update. Nucleic acids Res. 41, D991–D995. 10.1093/nar/gks1193 - DOI - PMC - PubMed
    1. Basak T., Varshney S., Akhtar S., Sengupta S. (2015). Understanding different facets of cardiovascular diseases based on model systems to human studies: a proteomic and metabolomic perspective. J. proteomics 127, 50–60. 10.1016/j.jprot.2015.04.027 - DOI - PubMed
    1. Bindea G., Mlecnik B., Hackl H., Charoentong P., Tosolini M., Kirilovsky A., et al. (2009). ClueGO: a cytoscape plug-in to decipher functionally grouped gene ontology and pathway annotation networks. Bioinforma. Oxf. Engl. 25, 1091–1093. 10.1093/bioinformatics/btp101 - DOI - PMC - PubMed

LinkOut - more resources