. 2024 Dec 11:12:1502535.
doi: 10.3389/fbioe.2024.1502535. eCollection 2024.

Influence of acupuncture intensity on analgesic effects in AA rat models

Affiliations

Influence of acupuncture intensity on analgesic effects in AA rat models

Yi-Xuan Wang et al. Front Bioeng Biotechnol. .

Abstract

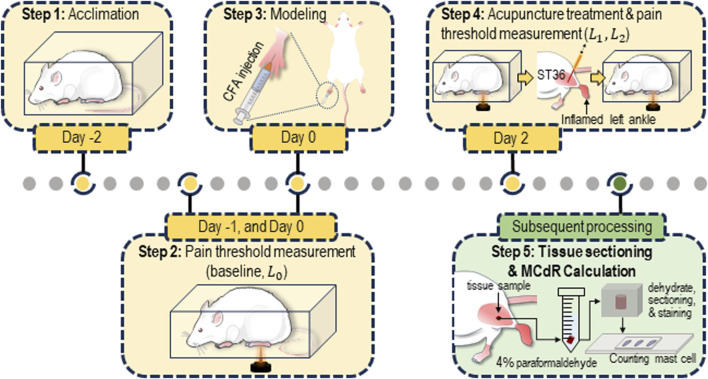
Objective: To investigate the influence of acupuncture lifting-thrusting frequency and amplitude on the analgesic effects, and its correlation with mast cell degranulation.

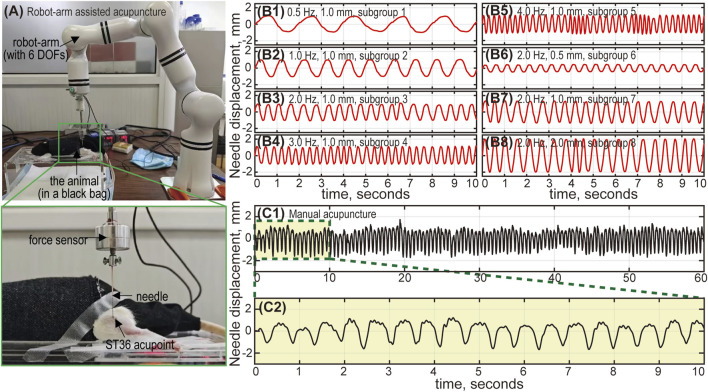
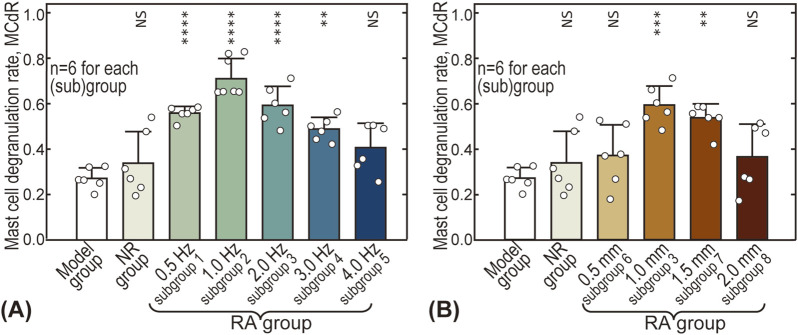
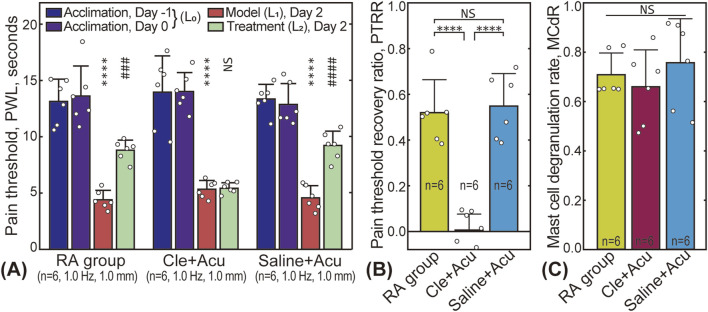
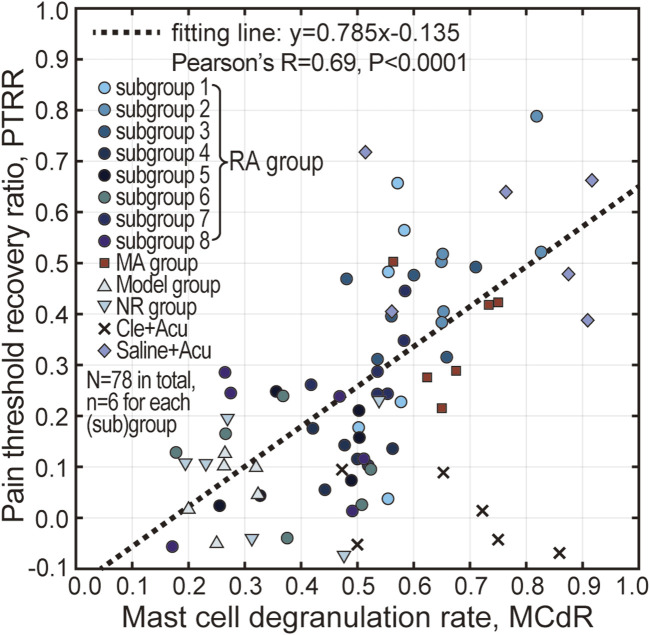
Methods: Acute adjuvant arthritis (AA) rat models were employed. Robot-arm aided lifting-thrusting acupuncture therapy was conducted with various frequencies (ranging from 0.5 to 4 Hz) and amplitudes (ranging from 0.5 to 2.0 mm). The rats' pain thresholds were measured multiple times before and after the therapy, and the analgesic effects were evaluated using the pain threshold recovery rate (PTRR), a normalized index. The mast cell degranulation rate (MCdR) at the acupoint was calculated, and a correlation analysis between PTRR and MCdR was performed.

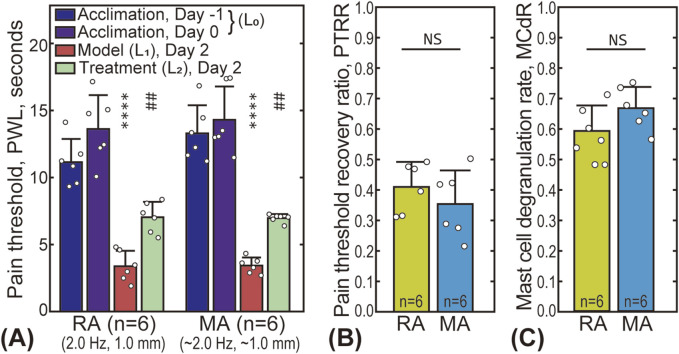
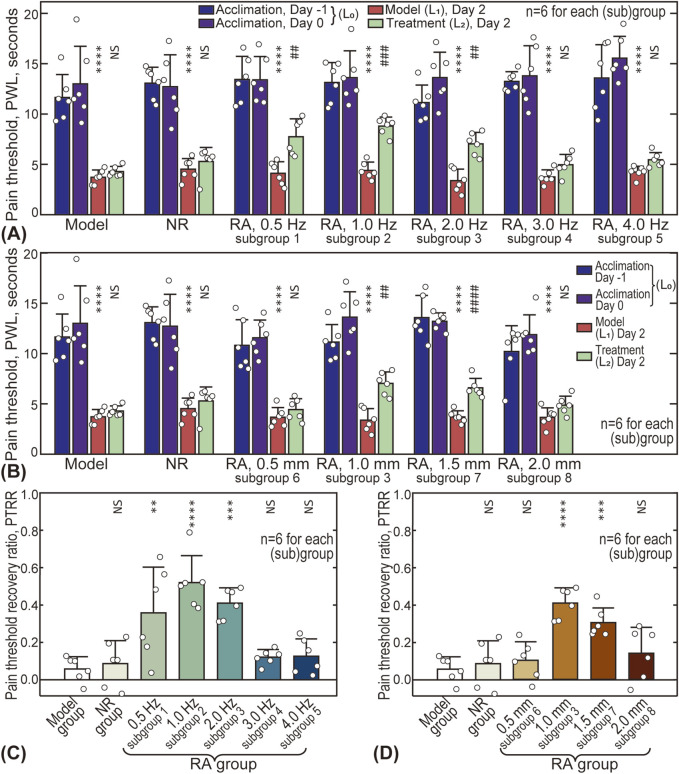
Results: Acupuncture therapy partially restored the pain threshold affected by arthritis. The analgesic effects were influenced by stimulus frequency and amplitude, with best outcomes occurring at an intermediate optimal frequency of 1.0 Hz and amplitude of 1.0-1.5 mm. Similarly, the MCdR peaked at the optimal frequency and amplitude.

Conclusion: Our animal experiment suggests that optimal analgesic effects can be achieved with stimulation at an optimal intensity. This intensity-effect correlation appears to originate from mast cell activation rates under different mechanical stimulus.

Keywords: acupuncture intensity; adjuvant arthritis; analgesia; mast cell; robot arm.


Conflict of interest statement

The authors declare that the research was conducted in the absence of any commercial or financial relationships that could be construed as a potential conflict of interest.

Figures

FIGURE 1
FIGURE 1
Protocol for the animal experiment. The rats were acclimated for 3 days (from Day −2 to Day 0) prior to the establishment of the acute adjuvant arthritis (AA) model. Acupuncture was performed on Day 2. Pain threshold measurements were conducted on Day −1, Day 0 (before modeling), Day 2 (before and after the acupuncture treatment). After the measurement, tissue samples from the ST36 acupoint were collected and sectioned for estimation of the mast cell degranulation rate (MCdR).
FIGURE 2
FIGURE 2
The robot-arm assisted acupuncture system. (A) The animal is placed in a black bag to relieve stress. The needle is connected to a 6-DOF (degrees of freedom) robot arm, and inserted into the ST36 acupoint (left foot) of the animal. The robot-arm moves up and down, mimicking the lifting-thrusting acupuncture technique, with frequency and amplitude controlled by an in-house Python program. A force sensor between the needle and the robot-arm monitors the applied force. Needle movement during robot-arm assisted and manual acupuncture: Subfigures (B1-B8) show the needle displacement corresponding to subgroups 1 to 8. The actual needle movement under robot-arm control generally aligns with our designed parameters (frequency and amplitude). Errors are relatively larger with high frequency and large amplitude combinations (subgroup 4, 5 and 8), but remain within 5%. Subfigure (C1) shows the needle movement for manual acupuncture, lasting 60 s. Subfigure (C2) provides an enlarged view of the displacement curve (10 s). The amplitude is approximately 1 mm, and the frequency is around 2 Hz.
FIGURE 3
FIGURE 3
Comparison between robot-arm assisted acupuncture (RA group, subgroup 3) and manual acupuncture (MA group). (A) The pain thresholds of the animals in the RA and MA groups at four time points. The star “*” markers indicate the statistical difference between the pain threshold baseline and that after model establishment ( L0 and L1 ), **** P<0.0001 . The sharp “#” markers indicate statistical difference between pain threshold before ( L1 ) and after ( L2 ) the treatment, ## P<0.01 . (B, C) present the statistical results of the PTRR and MCdR, respectively. “NS” indicates no significant difference ( P>0.05 ) between the two groups.
FIGURE 4
FIGURE 4
Influence of acupuncture intensity on analgesic effects. (A) Influence of acupuncture frequency on pain thresholds of animals; (B) Influence of acupuncture amplitude; (C) Influence of frequency on pain threshold recovery ratio (PTRR); (D) Influence of amplitude on PTRR. In subplot A and B, differences between L1 and L0 , and L2 and L1 were analyzed. In subplot (C, D), the PTRR values of other groups were pairwise compared with the Model group. NS: statistically not significant, P>0.05 ; * or #: P<0.05 ; ** or ##: P<0.01 ; *** or ###: P<0.001 ; **** or ####: P<0.0001 .
FIGURE 5
FIGURE 5
Influence of acupuncture intensity on mast cell degranulation rate (MCdR). (A) Influence of acupuncture frequency; (B) Influence of acupuncture amplitude. The MCdR values of other groups were pairwise compared with the Model group. NS: statistically not significant, P>0.05 ; *: P<0.05 ; **: P<0.01 ; ***: P<0.001 ; ****: P<0.0001 .
FIGURE 6
FIGURE 6
Influence of clemastine fumarate injection. (A) Pain threshold results; (B) PTRR results for the RA (subgroup 2), Cle + Acu, and Saline + Acu groups; (C) Corresponding MCdR results. NS: statistically not significant, P>0.05 ; * or #: P<0.05 ; ** or ##: P<0.01 ; *** or ###: P<0.001 ; **** or ####: P<0.0001 .
FIGURE 7
FIGURE 7
Correlation analysis between PTRR and MCdR. Pearson’s correlation analysis was conducted, indicating a strong positive correlation between PTRR and MCdR, except for the Cle + Acu group. The dotted line represents the linear fit of the data points.

Similar articles

Cited by

References

    1. Armour M., Dahlen H. G., Zhu X., Farquhar C., Smith C. A. (2017). The role of treatment timing and mode of stimulation in the treatment of primary dysmenorrhea with acupuncture: an exploratory randomised controlled trial. PLoS One 12 (7), e0180177. 10.1371/journal.pone.0180177 - DOI - PMC - PubMed
    1. Bae S. J., Ji J. Y., Oh J. Y., Won J., Ryu Y. H., Lee H., et al. (2021). The role of skin mast cells in acupuncture induced analgesia in animals: a preclinical systematic review and meta-analysis. J. Pain 22 (12), 1560–1577. 10.1016/j.jpain.2021.06.006 - DOI - PubMed
    1. Brzezińska-Błaszczyk E. (2011). Mast cells as a source and target for histamine in Biomedical aspects of histamine: current perspectives. Editors Khardori N., Ali Khan R., Tripathi T. (Springer; ), 247–284.
    1. Dimitrov N., Atanasova D., Tomov N., Sivrev D., Lazarov N. (2017). Acupuncture causes serotonin release by mast cells. Romanian J. Morphol. Embryology 58 (3), 961–968. - PubMed
    1. Ding N., Jiang J., Qin P., Wang Q., Hu J., Li Z. (2018). Mast cells are important regulator of acupoint sensitization via the secretion of tryptase, 5-hydroxytryptamine, and histamine. Plos One 13 (3), e0194022. 10.1371/journal.pone.0194022 - DOI - PMC - PubMed

LinkOut - more resources