

Dynamic changes of gut microbiota between the first and second trimester for women with gestational diabetes mellitus and their correlations with BMI: a nested cohort study in China
- PMID: 39723141
- PMCID: PMC11669307
- DOI: 10.3389/fmicb.2024.1467414
Dynamic changes of gut microbiota between the first and second trimester for women with gestational diabetes mellitus and their correlations with BMI: a nested cohort study in China
Abstract
Introduction: Gut microbiota (GM) has been implicated in gestational diabetes mellitus (GDM), yet longitudinal changes across trimesters remain insufficiently explored.
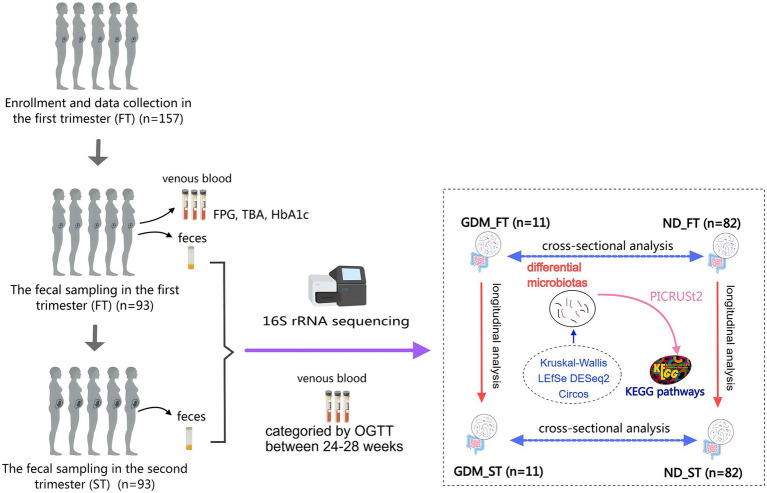
Methods: This nested cohort study aimed to investigate GM alterations before 24 weeks of gestation and their association with GDM. Ninety-three Chinese participants provided fecal samples during the first and second trimesters. Based on oral glucose tolerance tests, 11 participants were classified as GDM, and 82 as non-diabetic (ND). Using 16S rRNA sequencing, we analyzed both cross-sectional and longitudinal differences in GM structure between those two groups.
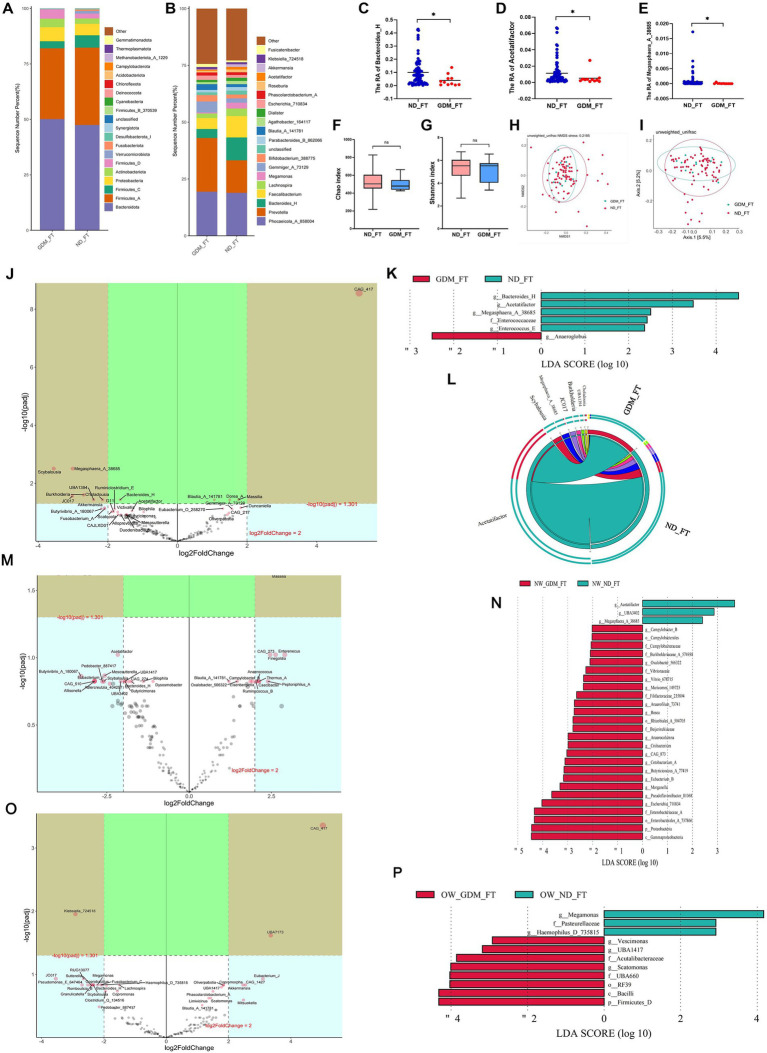
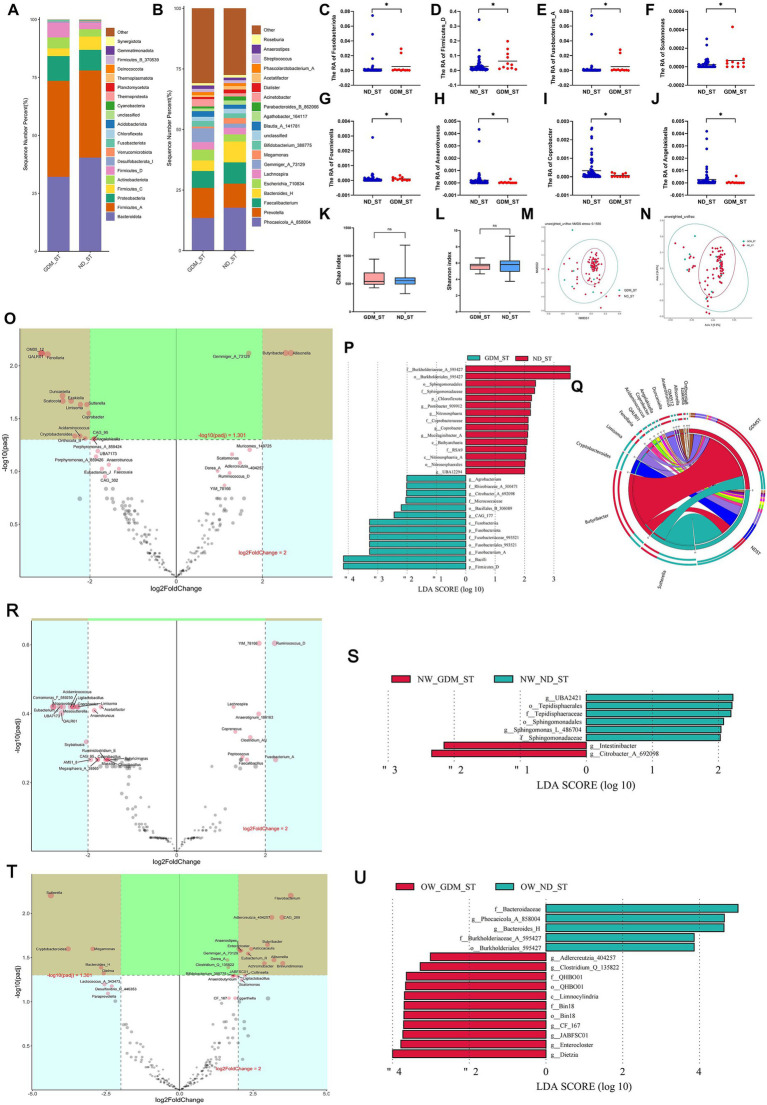
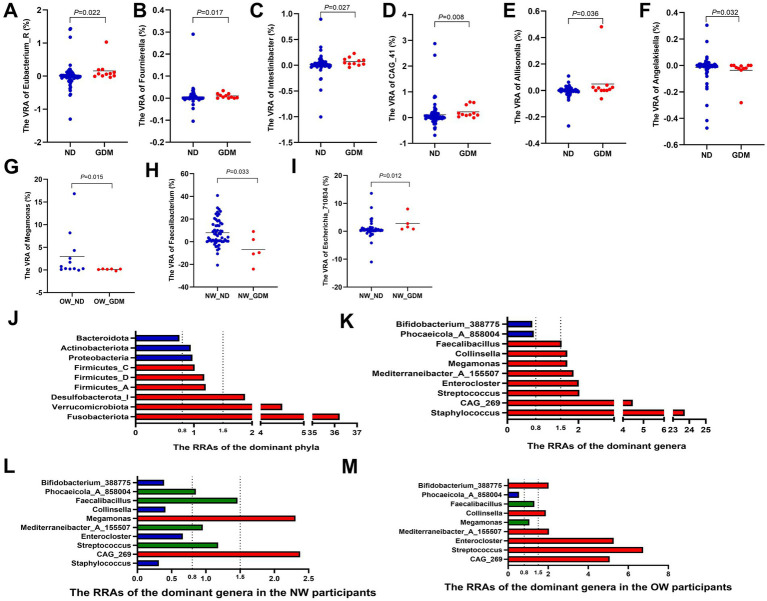
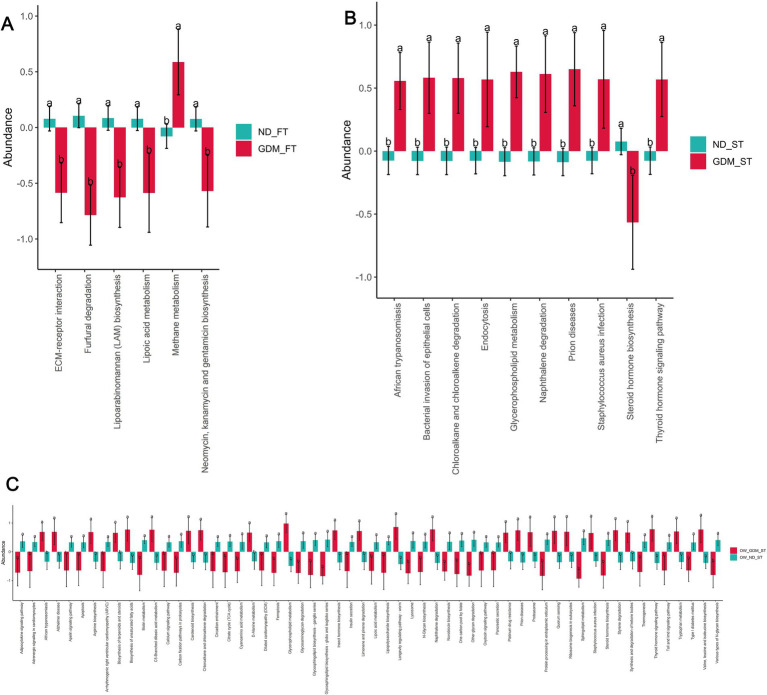
Results: In the first trimester, GDM group exhibited lower levels of Bacteroides_H and Acetatifactor compared to ND group (p < 0.05). In the second trimester, GDM individuals showed increased abundance of Fusobacteriota and Firmicutes_D, and genera including Fusobacterium_A and Fournierella, while Anaerotruncus and others decreased (P<0.05). Inflammation-associated genera like Gemmiger_A_73129 and Enterocloster increased, while Megamonas decreased in overweight or obese GDM women, which was not identified in normal-weight women. The ratios of relative abundance of genera Streptococcus, Enterocloster, and Collinsella exceeded 1.5 in the GDM group, particularly in overweight or obese individuals. Inflammatory pathways related to African trypanosomiasis and Staphylococcus aureus infection were predicted to be up-regulated in overweight or obese GDM individuals but not in normal-weight GDM women.
Discussion: This study suggests that GM of women with GDM undergoes significant alterations between the first and second trimesters, potentially linked to inflammation, with more pronounced changes observed in overweight or obese individuals.
Keywords: body mass index; gestational diabetes mellitus; gut microbiota; inflammation; obesity.
Copyright © 2024 Zhong, Yang, Liu, Dai, Li, Yang, Yang, Wang, Wang, Xu and Deng.
Conflict of interest statement
GL was employed by CheerLand Biological Technology Co., Ltd. The remaining authors declare that the research was conducted in the absence of any commercial or financial relationships that could be construed as a potential conflict of interest.
Figures
Similar articles
-
Gut microbiota in pregnant Malaysian women: a comparison between trimesters, body mass index and gestational diabetes status.BMC Pregnancy Childbirth. 2022 Feb 24;22(1):152. doi: 10.1186/s12884-022-04472-x. BMC Pregnancy Childbirth. 2022. PMID: 35209853 Free PMC article.
-
Specific gut bacterial and fungal microbiota pattern in the first half of pregnancy is linked to the development of gestational diabetes mellitus in the cohort including obese women.Front Endocrinol (Lausanne). 2022 Sep 5;13:970825. doi: 10.3389/fendo.2022.970825. eCollection 2022. Front Endocrinol (Lausanne). 2022. PMID: 36133313 Free PMC article.
-
Composition of the intestinal microbiota and its variations between the second and third trimesters in women with gestational diabetes mellitus and without gestational diabetes mellitus.Front Endocrinol (Lausanne). 2023 Jul 14;14:1126572. doi: 10.3389/fendo.2023.1126572. eCollection 2023. Front Endocrinol (Lausanne). 2023. PMID: 37522117 Free PMC article.
-
Characteristics of the gut microbiome in women with gestational diabetes mellitus: A systematic review.PLoS One. 2022 Jan 13;17(1):e0262618. doi: 10.1371/journal.pone.0262618. eCollection 2022. PLoS One. 2022. PMID: 35025980 Free PMC article.
-
Hepatokine levels during the first or early second trimester of pregnancy and the subsequent risk of gestational diabetes mellitus: a systematic review and meta-analysis.Biomarkers. 2021 Sep;26(6):517-531. doi: 10.1080/1354750X.2021.1928754. Epub 2021 Jun 14. Biomarkers. 2021. PMID: 34082623
Cited by
-
Changes of intestinal microbiome and its relationship with painful diabetic neuropathy in rats.BMC Microbiol. 2025 May 8;25(1):281. doi: 10.1186/s12866-025-04015-2. BMC Microbiol. 2025. PMID: 40335921 Free PMC article.
References
-
- Balleza-Alejandri L. R., Peña-Durán E., Beltrán-Ramírez A., Reynoso-Roa A. S., Sánchez-Abundis L. D., García-Galindo J. J., et al. . (2024). Decoding the gut microbiota–gestational diabetes link: insights from the last seven years. Microorganisms 12:1070. doi: 10.3390/microorganisms12061070, PMID: - DOI - PMC - PubMed
LinkOut - more resources
Full Text Sources