. 2024 Dec 19:19:13593-13613.
doi: 10.2147/IJN.S493185. eCollection 2024.

FA-PEG Modified ZIF(Mn) Nanoparticles Loaded with Baicalin for Imaging-Guided Treatment of Melanoma in Mice

Affiliations

FA-PEG Modified ZIF(Mn) Nanoparticles Loaded with Baicalin for Imaging-Guided Treatment of Melanoma in Mice

Dong Zhang et al. Int J Nanomedicine. .

Abstract

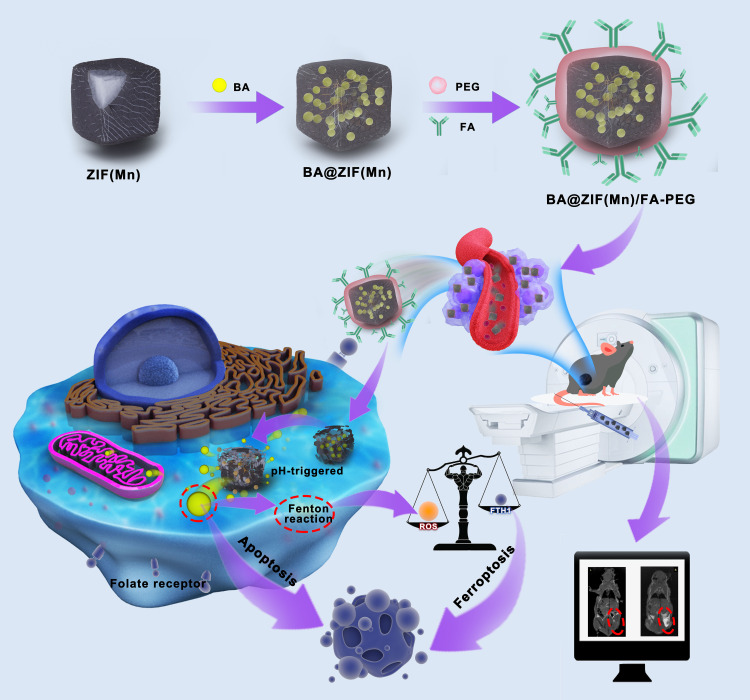
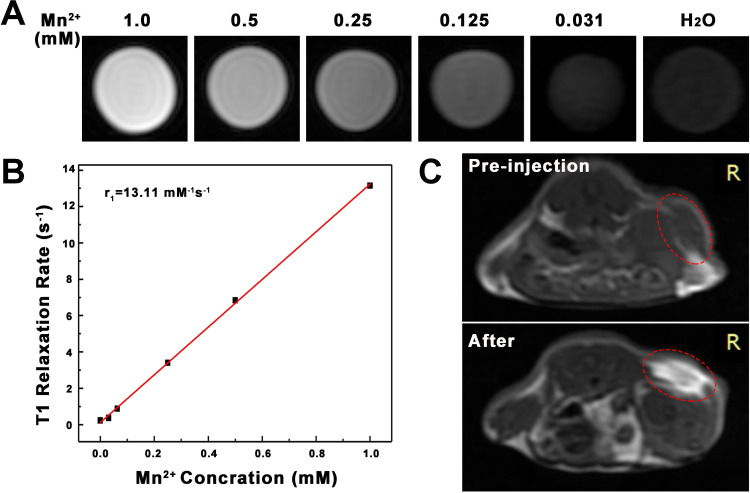
Background: Melanoma is an aggressive skin tumor with limited therapeutic options due to rapid proliferation, early metastasis, and poor prognosis. Baicalin (BA), a natural flavonoid, shows promise in inducing ferroptosis and apoptosis but faces challenges of poor solubility and bioavailability. To address these issues, we developed a multifunctional drug delivery system: manganese-doped ZIF-8 nanoparticles (ZIF(Mn)) loaded with BA and modified with folic acid (FA) and polyethylene glycol (PEG). FA targets melanoma cells by exploiting folate receptor overexpression, while PEG enhances biocompatibility and systemic circulation. Manganese enables magnetic resonance (MR) imaging for real-time, non-invasive therapy monitoring.

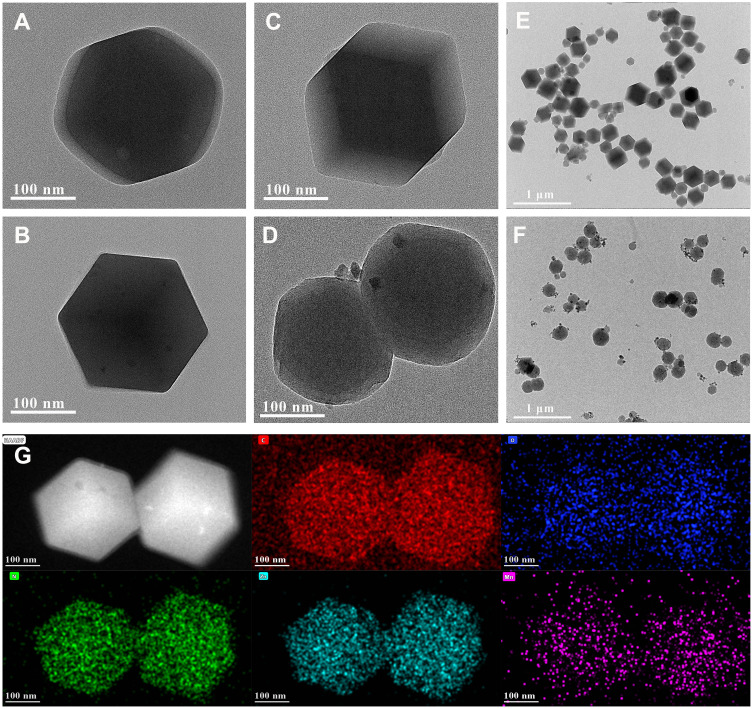
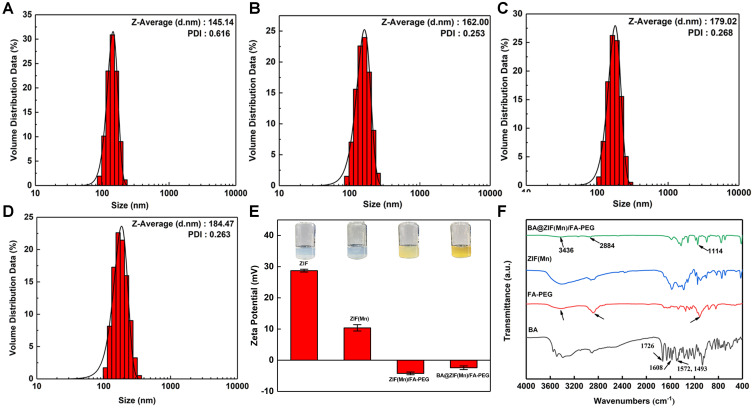
Methods: BA-loaded ZIF(Mn)/FA-PEG nanoparticles were synthesized via a one-pot method, enabling drug encapsulation, Mn²+ incorporation, and surface modification. The nanoparticles were comprehensively characterized (particle size, Zeta potential, FTIR, and XRD). Cytotoxicity and cellular uptake were evaluated in B16-F10 melanoma cells, and in vivo experiments in C57BL/6J mice investigated MR imaging capability, antitumor efficacy, and biosafety.

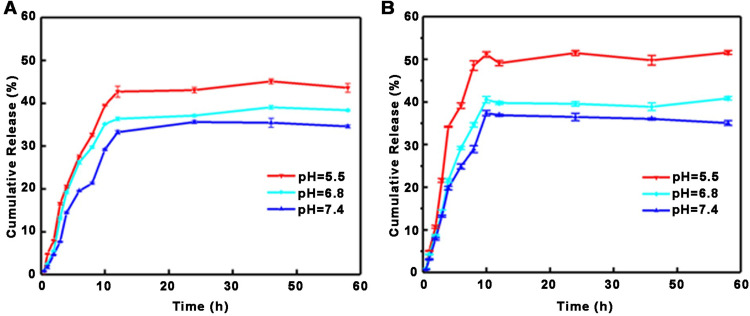
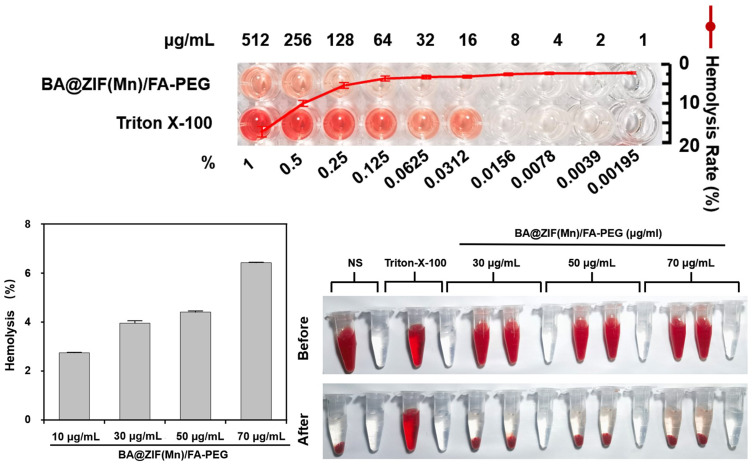
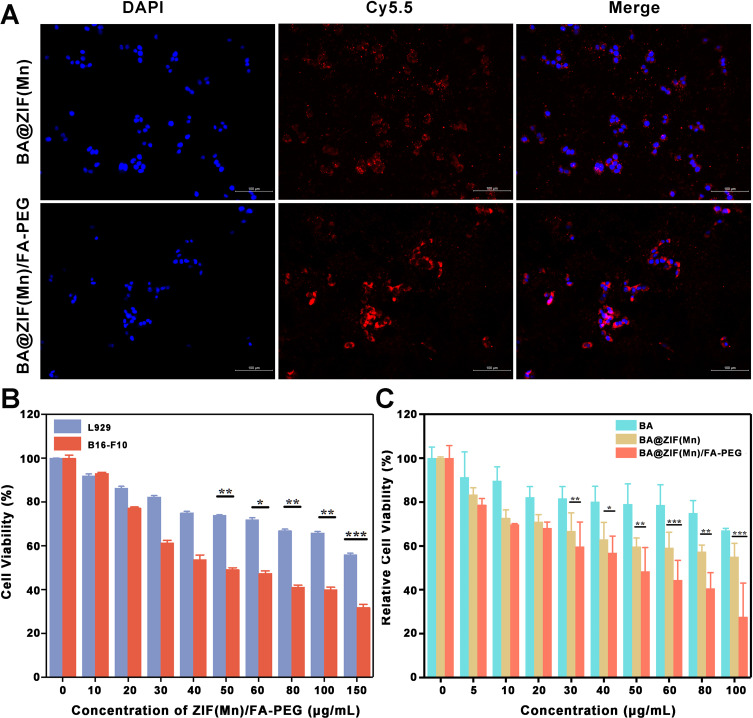
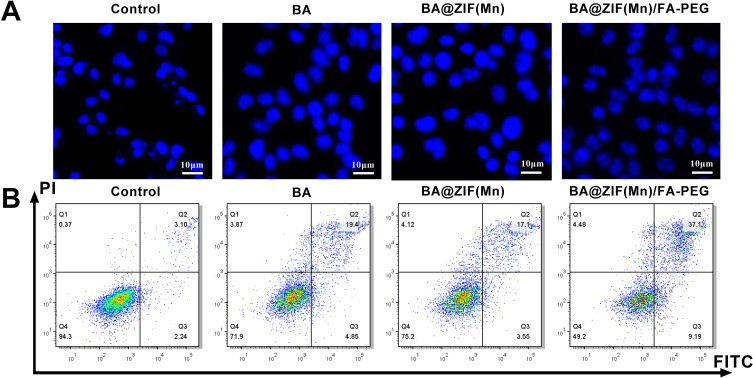
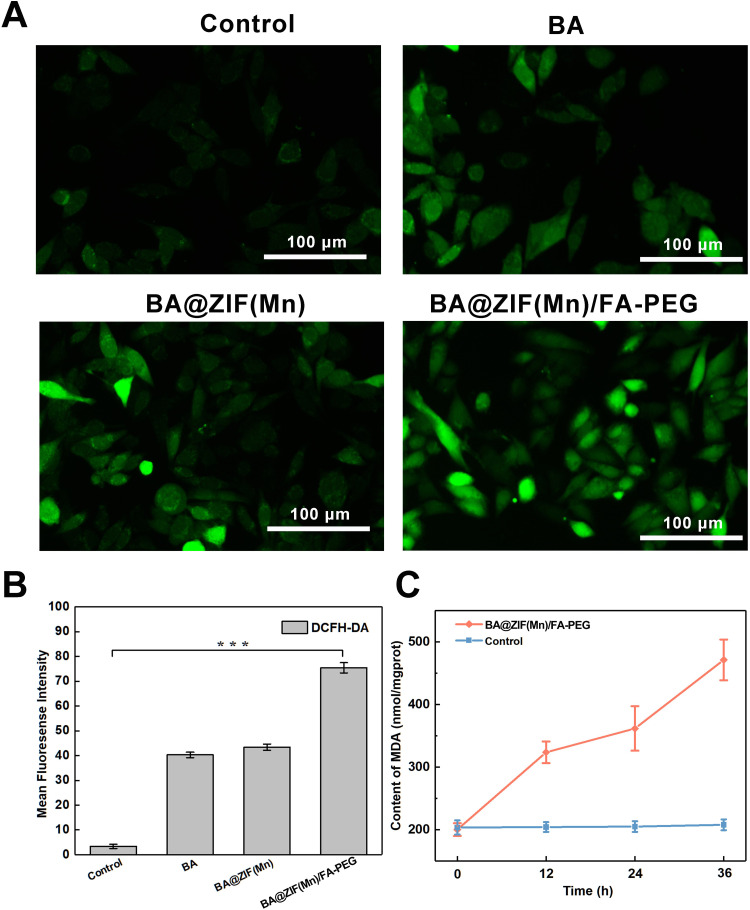
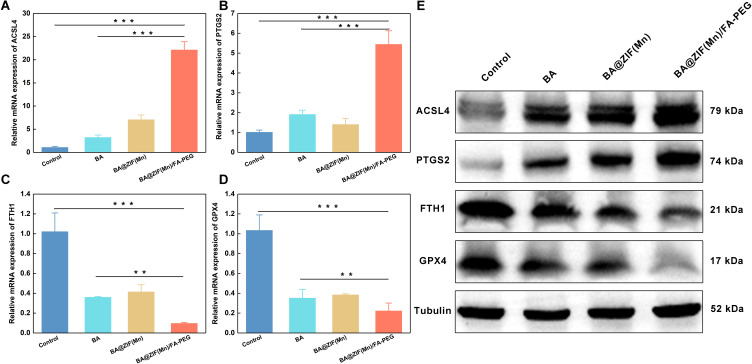
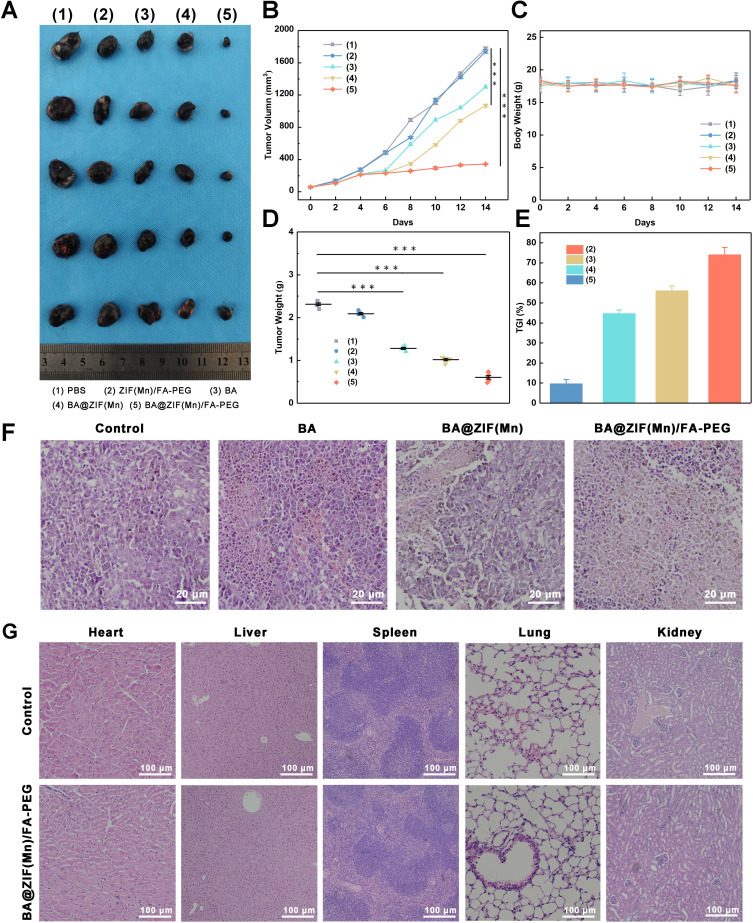
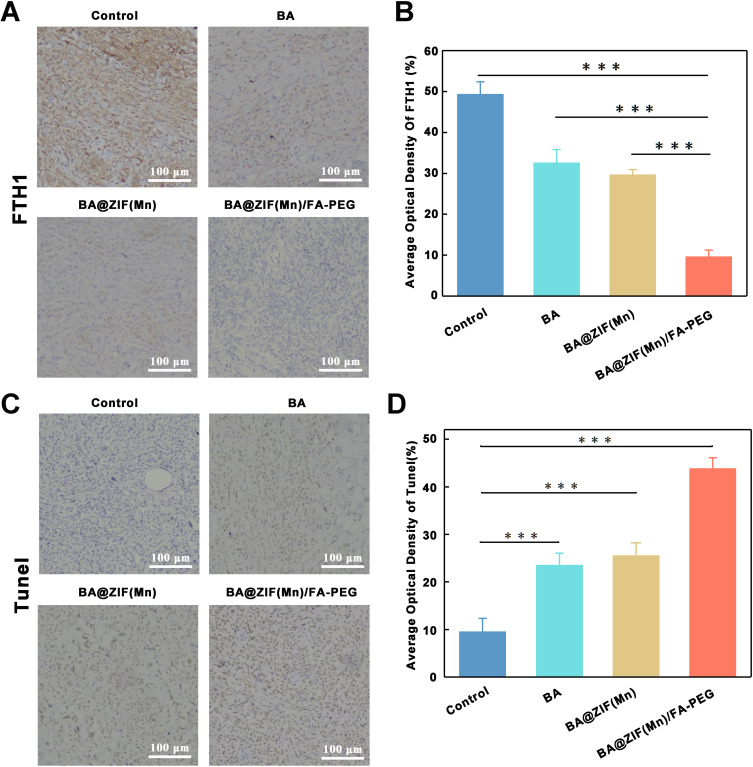
Results: BA@ZIF(Mn)/FA-PEG nanoparticles demonstrated excellent stability, a BA loading capacity of 33.50 ± 0.04%, and pH-responsive release, with accelerated drug release under acidic tumor conditions. Mn²+ provided strong T1-weighted MR imaging contrast. Cellular and animal studies showed enhanced uptake, reduced premature drug release, and improved compatibility. Mechanistically, the nanoparticles induced significant ferroptosis and apoptosis in melanoma cells, leading to potent antitumor effects.

Conclusion: The BA@ZIF(Mn)/FA-PEG nanoplatform effectively integrates targeted delivery, imaging guidance, and dual ferroptosis-apoptosis induction, offering a promising strategy for improving melanoma treatment outcomes.

Keywords: Baicalin; ferroptosis; folic acid targeted; magnetic resonance imaging; melanoma; metal−organic frameworks.


Conflict of interest statement

The authors have declared that no competing interest exists.

Figures

Figure 1
Figure 1
Schematic illustration of the preparation of BA@ZIF(Mn)/FA-PEG NPs and their use in imaging-guided, targeted induction of apoptosis and ferroptosis.
Figure 2
Figure 2
TEM images of (A) ZIF, (B) ZIF(Mn), (C) BA@ZIF(Mn), and (D) BA@ZIF(Mn)/FA-PEG, with scale bars of 100 nm; additional TEM images of (E) BA@ZIF(Mn) and (F) BA@ZIF(Mn)/FA-PEG, with scale bars of 1 μm. (G) Elemental distribution in ZIF(Mn) characterized by EDS-elemental mapping, showing homogeneous distribution of the desired elements: C (red), O (blue), N (green), Zn (cyan), and Mn (fuchsia). Scale bar =100 nm.
Figure 3
Figure 3
(A-D) Size distributions of ZIF-8 NPs, ZIF(Mn) NPs, ZIF(Mn)/FA-PEG NPs, and BA@ZIF(Mn)/FA-PEG NPs, as determined by DLS measurements. (E) Zeta potential measurements for ZIF NPs, ZIF(Mn) NPs, ZIF(Mn)/FA-PEG NPs, and BA@ZIF(Mn)/FA-PEG NPs. (F) FTIR spectra of BA, FA-PEG, ZIF(Mn), and BA@ZIF(Mn)/FA-PEG. Data are presented as mean±SD, n = 3.
Figure 4
Figure 4
Drug release kinetics from BA@ZIF(Mn) (A) and BA@ZIF(Mn)/FA-PEG (B) in PBS buffer solutions at pH 5.5, 6.8, and 7.4. Data are presented as mean±SD, n = 3.
Figure 5
Figure 5
Hemolysis assay of BA@ZIF(Mn)/FA-PEG NPs in vitro. Relative viabilities of B16-F10 cells after incubation with various concentrations of blank ZIF(Mn)/FA-PEG NPs for 24 hours. Results are presented as mean±SD, n = 3.
Figure 6
Figure 6
(A) Cellular uptake of Cy5.5/BA@ZIF(Mn) and Cy5.5/BA@ZIF(Mn)/FA-PEG in B16-F10 cells; scale bars are 100 μm. (B) Relative viabilities of B16-F10 cells and L929 cells after being incubated with various concentrations of ZIF(Mn)/FA-PEG NPs for 24 hours. (C) Relative B16-F10 cell viability after incubation with different samples containing equivalent amounts of BA for 12 hours. Data are mean ± SD (n = 3; *p < 0.05; **p < 0.01; ***p < 0.001).
Figure 7
Figure 7
(A) Apoptosis in B16-F10 cells treated with PBS, BA, BA@ZIF(Mn) NPs, and BA@ZIF(Mn)/FA-PEG NPs, observed using an inverted fluorescence microscope with Hoechst 33258 staining; scale bars are 10 μm. (B) Apoptosis rates of B16-F10 cells determined by flow cytometry after treatment with PBS, BA, BA@ZIF(Mn), and BA@ZIF(Mn)/FA-PEG.
Figure 8
Figure 8
Intracellular ROS content in B16-F10 cells after treatment with PBS, BA, BA@ZIF(Mn), and BA@ZIF(Mn)/FA-PEG. (A) DCFH-DA fluorescence imaging showing ROS levels in treated B16-F10 cells; scale bars are 100 μm. (B) Quantification of DCFH-DA fluorescence from (AC) Intracellular lipid peroxidation levels measured as relative malondialdehyde (MDA) content at 0,12,24 and 36 hours post-treatment with PBS, BA, BA@ZIF(Mn), and BA@ZIF(Mn)/FA-PEG. Data are mean ± SD (n = 3; ***p < 0.001).
Figure 9
Figure 9
mRNA expression levels of (A) ACSL4, (B) PTGS2, (C) FTH1, and (D) GPX4 in B16-F10 cells following treatment with PBS, BA, BA@ZIF(Mn), and BA@ZIF(Mn)/FA-PEG. Gene expression was assessed by quantitative RT-PCR, and results are presented as relative mRNA expression compared to the control group. (E) Western blot analysis of protein expression levels for ACSL4, PTGS2, FTH1, and GPX4 in B16-F10 cells treated with the same conditions. Tubulin was used as a loading control. Data are mean ± SD (n = 3; **p < 0.01; ***p < 0.001).
Figure 10
Figure 10
MR Imaging. (A) T1-weighted MR images of BA@ZIF(Mn)/FA-PEG NPs at varying Mn²+ concentrations. (B) T1 relaxation rates of aqueous solutions containing BA@ZIF(Mn)/FA-PEG NPs at different Mn²+ concentrations. (C) In vivo T1-weighted MR images of a mouse before injection (top) and 6 hours post intravenous injection (bottom) of BA@ZIF(Mn)/FA-PEG NPs.
Figure 11
Figure 11
In Vivo Characterization. (A) Photographs of tumor samples from each treatment group. Mice were injected via the tail vein with: (1) PBS; (2) ZIF(Mn)/FA-PEG NPs; (3) BA; (4) BA@ZIF(Mn) NPs; or (5) BA@ZIF(Mn)/FA-PEG NPs. Each group comprised five mice. (B) Analysis of tumor volume for each group. Photographs of (C) body and (D) excised tumors weight of tumor-bearing mice following different treatments over 14 days. (E) Tumor growth inhibition (TGI) rates for each group after treatment. (F) H&E-stained images of tumor sections from different treatment groups after 14 days. Scale bar = 20 μm. (G) H&E-stained images of heart, liver, spleen, lung, and kidney tissues collected from mice after 14 days of treatment. Scale bar = 100 μm. Data are mean ± SD (n = 3; ***p < 0.001).
Figure 12
Figure 12
BA-Induced Ferroptosis in a Melanoma Xenograft Model. (A) Immunohistochemical FTH1 staining analysis of tumors from mice bearing B16-F10 melanoma treated with PBS, BA, BA@ZIF(Mn), and BA@ZIF(Mn)/FA-PEG. (B) Quantification of FTH1 immunohistochemical staining. (C) Tunel staining analysis of tumors from mice treated with PBS, BA, BA@ZIF(Mn), and BA@ZIF(Mn)/FA-PEG. (D) Quantification of Tunel staining. Scale bar = 100 μm. Data are mean ± SD (n = 3; ***p < 0.001).

Similar articles

Cited by

References

    1. Geller AC, Clapp RW, Sober AJ, et al. Melanoma epidemic: an analysis of six decades of data from the Connecticut Tumor Registry. J Clin Oncol. 2013;31:4172–4178. doi:10.1200/JCO.2012.47.3728 - DOI - PMC - PubMed
    1. Ho H, Aruri J, Kapadia R, Mehr H, White MA, Ganesan AK. RhoJ regulates melanoma chemoresistance by suppressing pathways that sense DNA damage. Cancer Res. 2012;72:5516–5528. doi:10.1158/0008-5472.CAN-12-0775 - DOI - PMC - PubMed
    1. Trager MH, Queen D, Samie FH, Carvajal RD, Bickers DR, Geskin LJ. Advances in Prevention and Surveillance of Cutaneous Malignancies. Am J Med. 2020;133:417–423. doi:10.1016/j.amjmed.2019.10.008 - DOI - PMC - PubMed
    1. Ma W, Zhan R, Sui C, et al. Clinical Retrospective Analysis of 243 Patients with Rhinofacial Ulcers. Clin Cosmet Invest Dermatol. 2022;15:1475–1483. doi:10.2147/CCID.S371029 - DOI - PMC - PubMed
    1. Zhang D, Zhang W, Wu X, et al. Dual Modal Imaging-Guided Drug Delivery System for Combined Chemo-Photothermal Melanoma Therapy. Int J Nanomed. 2021;16:3457–3472. doi:10.2147/IJN.S306269 - DOI - PMC - PubMed

MeSH terms