

Biomarkers of success of anti-PD-(L)1 immunotherapy for non-small cell lung cancer derived from RNA- and whole-exome sequencing: results of a prospective observational study on a cohort of 85 patients
- PMID: 39723204
- PMCID: PMC11669362
- DOI: 10.3389/fimmu.2024.1493877
Biomarkers of success of anti-PD-(L)1 immunotherapy for non-small cell lung cancer derived from RNA- and whole-exome sequencing: results of a prospective observational study on a cohort of 85 patients
Abstract
Background: Immune checkpoint inhibitors (ICIs) treatment have shown high efficacy for about 15 cancer types. However, this therapy is only effective in 20-30% of cancer patients. Thus, the precise biomarkers of ICI response are an urgent need.
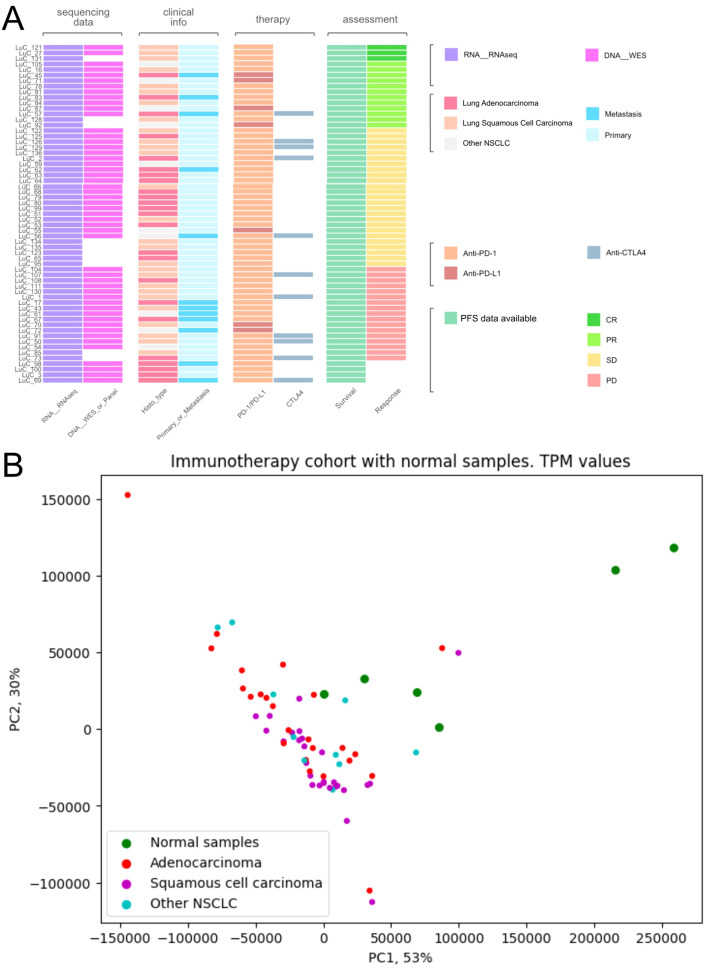
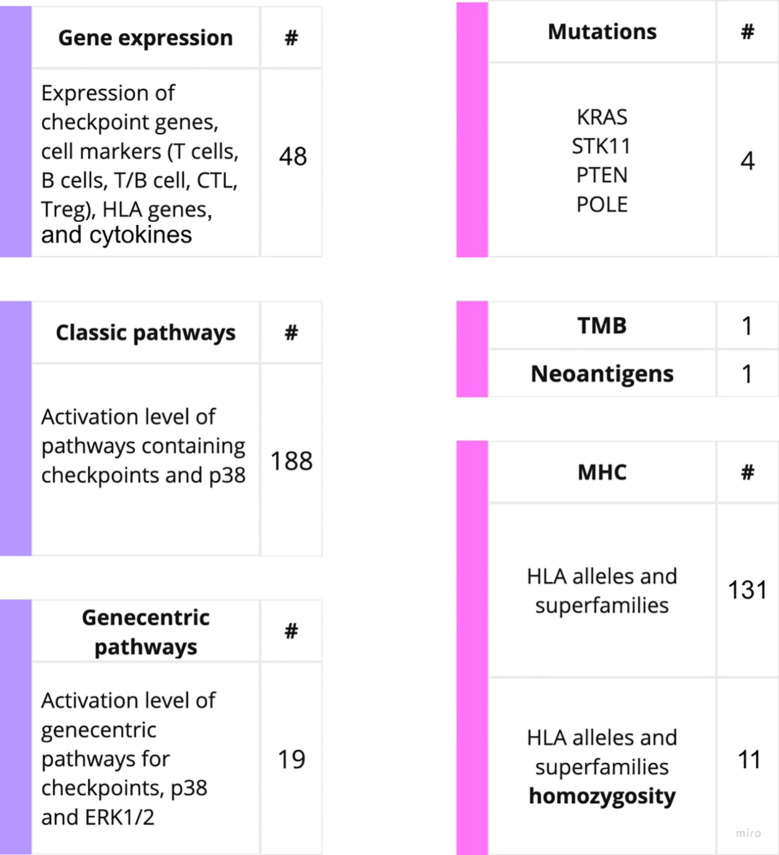
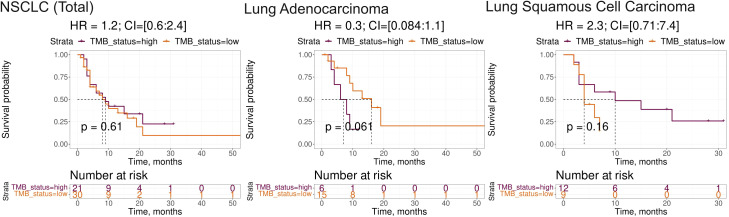
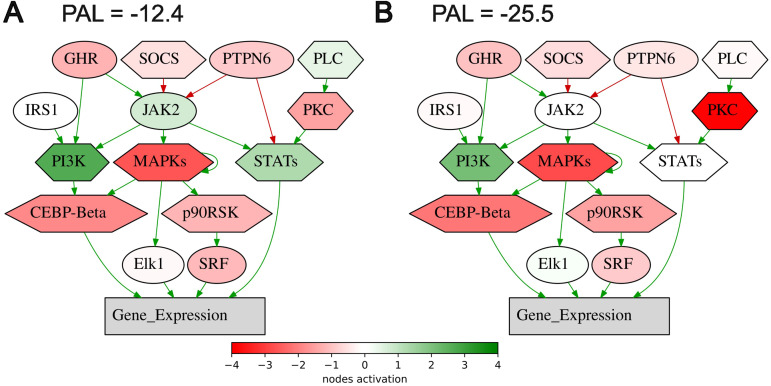
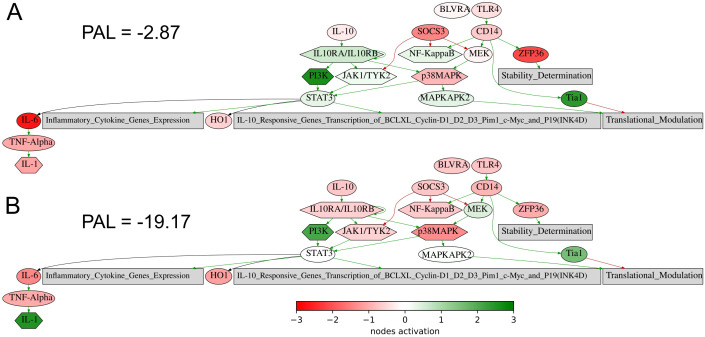
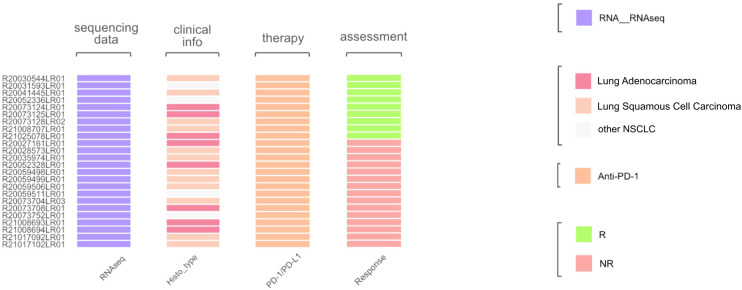
Methods: We conducted a prospective observational study of the prognostic potential ofseveral existing and putative biomarkers of response to immunotherapy in acohort of 85 patients with lung cancer (LC) receiving PD-1 or PD-L1 targeted ICIs. Tumor biosamples were obtained prior to ICI treatment and profiled by whole exome and RNA sequencing. The entire 403 putative biomarkers were screened, including tumor mutation burden (TMB) and number of cancer neoantigens, 131 specific HLA alleles, homozygous state of 11 HLA alleles and their superfamilies; four gene mutation biomarkers, expression of 45 immune checkpoint genes and closely related genes, and three previously published diagnostic gene signatures; for the first time, activation levels of 188 molecular pathways containing immune checkpoint genes and activation levels of 19 pathways algorithmically generated using a human interactome model centered around immune checkpoint genes. Treatment outcomes and/or progression-free survival (PFS) times were available for 61 of 85 patients with LC, including 24 patients with adenocarcinoma and 27 patients with squamous cell LC, whose samples were further analyzed. For the rest 24 patients, both treatment outcomes and PFS data could not be collected. Of these, 54 patients were treated with PD1-specific and 7 patients with PD-L1-specific ICIs. We evaluated the potential of biomarkers based on PFS and RECIST treatment response data.
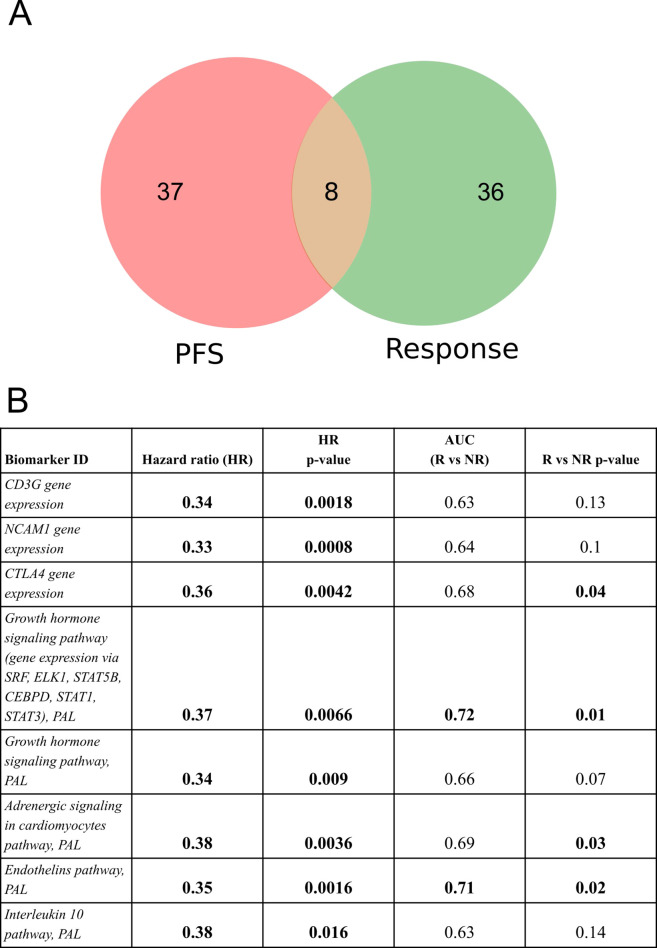
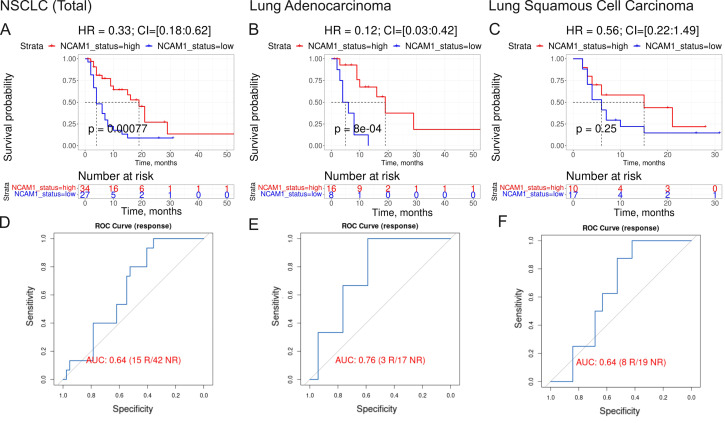
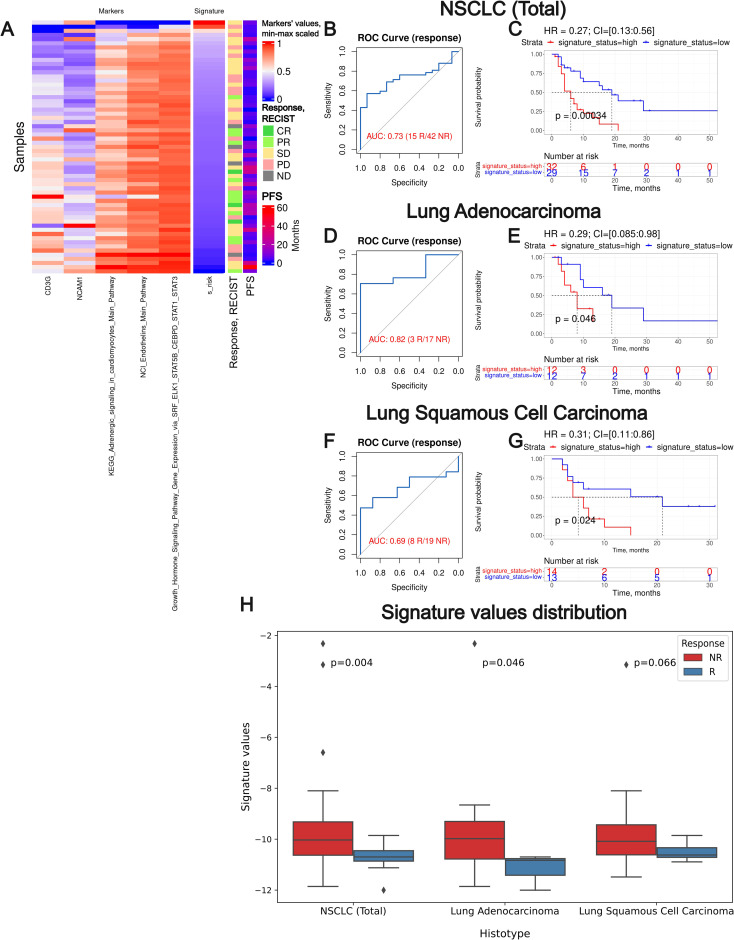
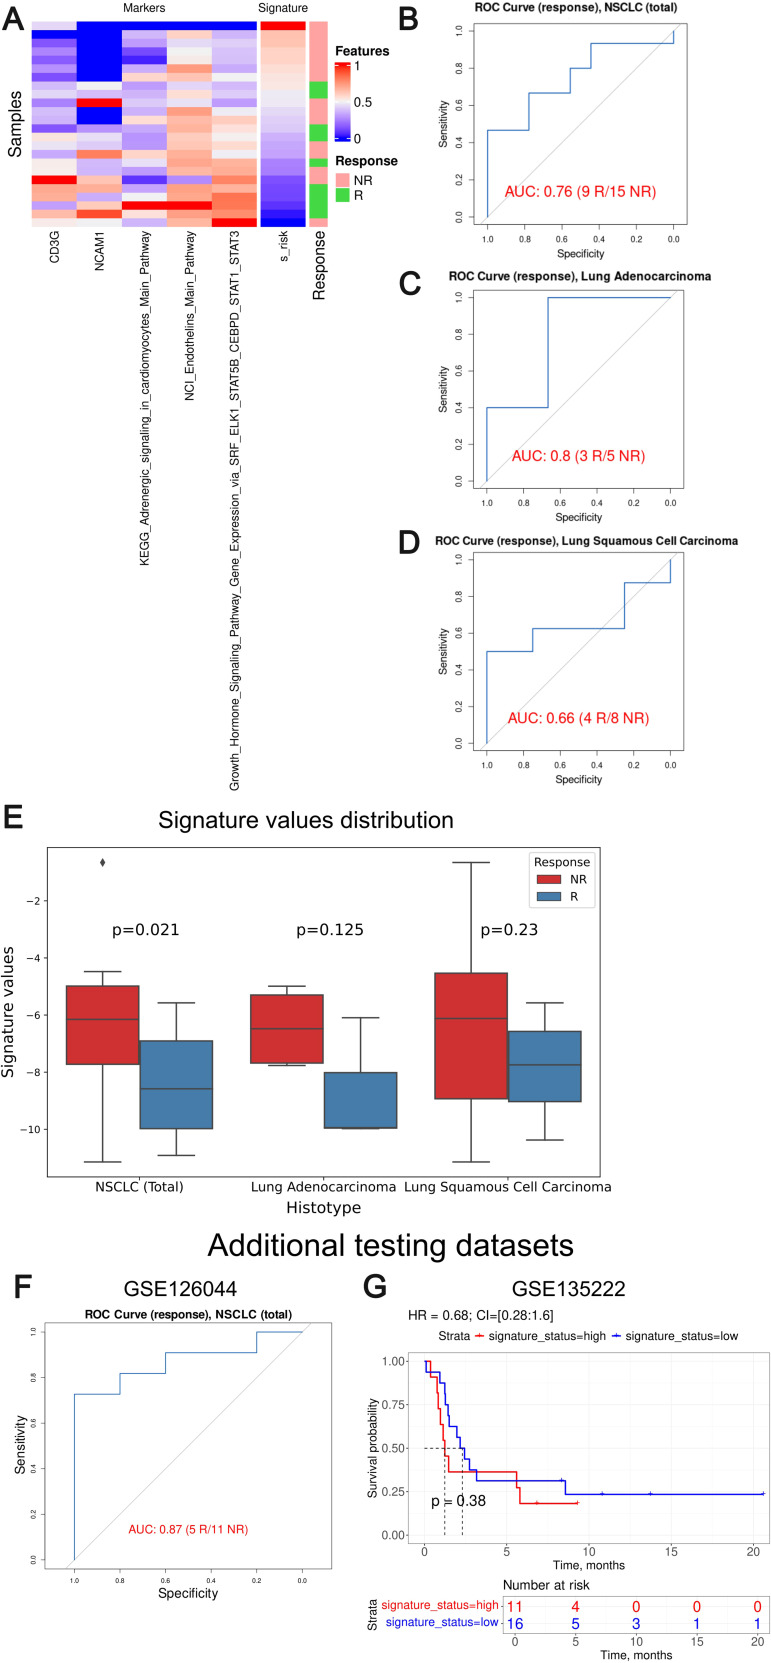
Results: In our sample, 45 biomarkers were statistically significantly associated with PFS and 44 with response to treatment, of which eight were shared. Five of these (CD3G and NCAM1 gene expression levels, and levels of activation of Adrenergic signaling in cardiomyocytes, Growth hormone signaling, and Endothelin molecular pathways) were used in our signature that showed an AUC of 0.73 and HR of 0.27 (p=0.00034) on the experimental dataset. This signature was also reliable (AUC 0.76, 0.87) for the independent publicly available LC datasets GSE207422, GSE126044 annotated with ICI response data and demonstrated same survival trends on independent dataset GSE135222 annotated with PFS data. In both experimental and one independent datasets annotated with samples' histotypes, the signature worked better for lung adenocarcinoma than for squamous cell LC.
Conclusion: The high reliability of our signature to predict response and PFS after ICI treatment was demonstrated using experimental and 3 independent datasets. Additionally, annotated molecular profiles obtained in this study were made publicly accessible.
Keywords: RNA sequencing; gene expression biomarker; immune checkpoint therapy; ipilimumab; nivolumab; non-small cell lung cancer; pembrolizumab; personalized medicine.
Copyright © 2024 Poddubskaya, Suntsova, Lyadova, Luppov, Guryanova, Lyadov, Garazha, Sorokin, Semenova, Shatalov, Biakhova, Simonov, Moisseev and Buzdin.
Conflict of interest statement
Authors AG and MS were employed by the company Oncobox Ltd. The remaining authors declare that the research was conducted in the absence of any commercial or financial relationships that could be construed as a potential conflict of interest.
Figures
Similar articles
-
Integration of comprehensive genomic profiling, tumor mutational burden, and PD-L1 expression to identify novel biomarkers of immunotherapy in non-small cell lung cancer.Cancer Med. 2021 Apr;10(7):2216-2231. doi: 10.1002/cam4.3649. Epub 2021 Mar 2. Cancer Med. 2021. PMID: 33655698 Free PMC article.
-
Robust Prediction of Immune Checkpoint Inhibition Therapy for Non-Small Cell Lung Cancer.Front Immunol. 2021 Apr 13;12:646874. doi: 10.3389/fimmu.2021.646874. eCollection 2021. Front Immunol. 2021. PMID: 33927719 Free PMC article.
-
Association of Survival and Immune-Related Biomarkers With Immunotherapy in Patients With Non-Small Cell Lung Cancer: A Meta-analysis and Individual Patient-Level Analysis.JAMA Netw Open. 2019 Jul 3;2(7):e196879. doi: 10.1001/jamanetworkopen.2019.6879. JAMA Netw Open. 2019. PMID: 31290993 Free PMC article.
-
Single or combined immune checkpoint inhibitors compared to first-line platinum-based chemotherapy with or without bevacizumab for people with advanced non-small cell lung cancer.Cochrane Database Syst Rev. 2020 Dec 14;12(12):CD013257. doi: 10.1002/14651858.CD013257.pub2. Cochrane Database Syst Rev. 2020. Update in: Cochrane Database Syst Rev. 2021 Apr 30;4:CD013257. doi: 10.1002/14651858.CD013257.pub3. PMID: 33316104 Free PMC article. Updated.
-
Single or combined immune checkpoint inhibitors compared to first-line platinum-based chemotherapy with or without bevacizumab for people with advanced non-small cell lung cancer.Cochrane Database Syst Rev. 2021 Apr 30;4(4):CD013257. doi: 10.1002/14651858.CD013257.pub3. Cochrane Database Syst Rev. 2021. PMID: 33930176 Free PMC article.
Cited by
-
The Role of Axl Inhibition and Immune Checkpoint Blockade in Non-small Cell Lung Cancer: Current Understanding and Treatment Strategies.Cancer Diagn Progn. 2025 Jun 30;5(4):417-428. doi: 10.21873/cdp.10455. eCollection 2025 Jul-Aug. Cancer Diagn Progn. 2025. PMID: 40600224 Free PMC article. Review.
References
-
- Gascón M, Isla D, Cruellas M, Gálvez EM, Lastra R, Ocáriz M, et al. . Intratumoral versus circulating lymphoid cells as predictive biomarkers in lung cancer patients treated with immune checkpoint inhibitors: is the easiest path the best one? Cells. (2020) 9:1525. doi: 10.3390/cells9061525 - DOI - PMC - PubMed
Publication types
MeSH terms
Substances
LinkOut - more resources
Full Text Sources
Medical
Molecular Biology Databases
Research Materials
Miscellaneous