. 2024 Dec 11:15:1419420.
doi: 10.3389/fimmu.2024.1419420. eCollection 2024.

Migrasome regulator TSPAN4 shapes the suppressive tumor immune microenvironment in pan-cancer

Affiliations

Migrasome regulator TSPAN4 shapes the suppressive tumor immune microenvironment in pan-cancer

Lin-Jian Wang et al. Front Immunol. .

Abstract

Background: Migrasomes are newly identified organelles on the retracting fibers of migrating cells, involved in releasing signaling molecules, expelling damaged mitochondria, and facilitating intercellular communication through phagocytosis. TSPAN4, a key regulator of migrasome formation, is a valuable marker for visualizing these organelles. However, its role in cancer remains unclear.

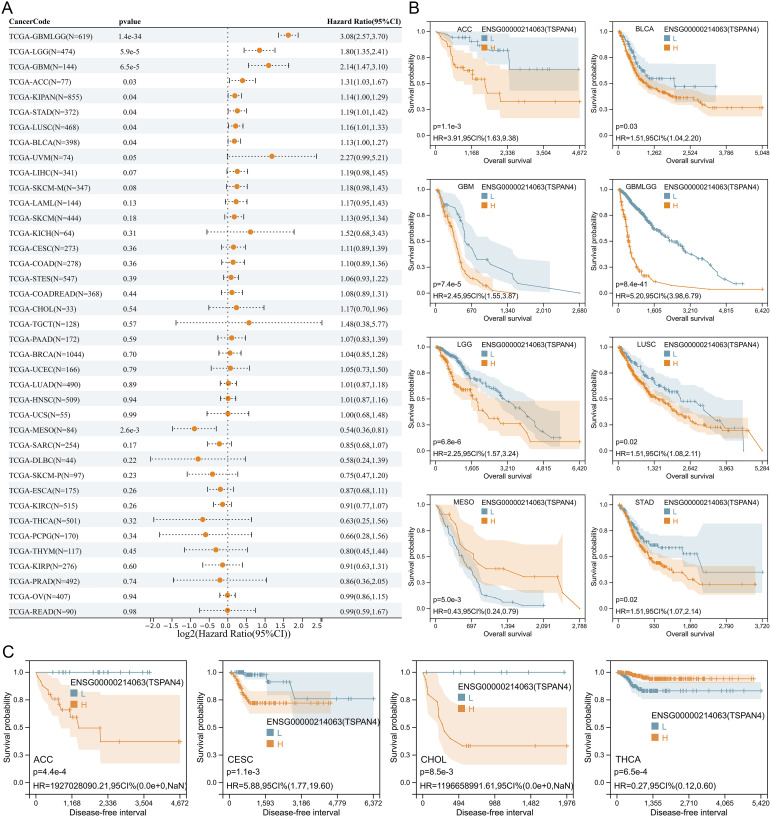
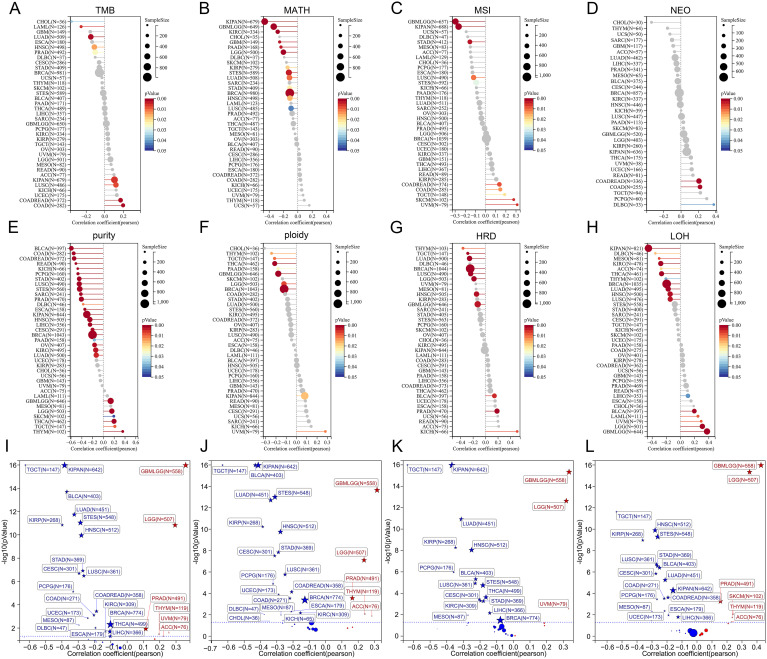
Methods: We analyzed TSPAN4 expression and its prognostic significance across multiple cancers using TCGA Pan-Cancer (PANCAN), and TCGA TARGET GTEx datasets. The relationship between TSPAN4 and tumor heterogeneity, stemness, and the immunosuppressive tumor microenvironment was explored through RNA-seq and scRNA-seq data. In addition, we examined TSPAN4's role in glioma, focusing on migrasome formation, cell proliferation, and macrophage polarization.

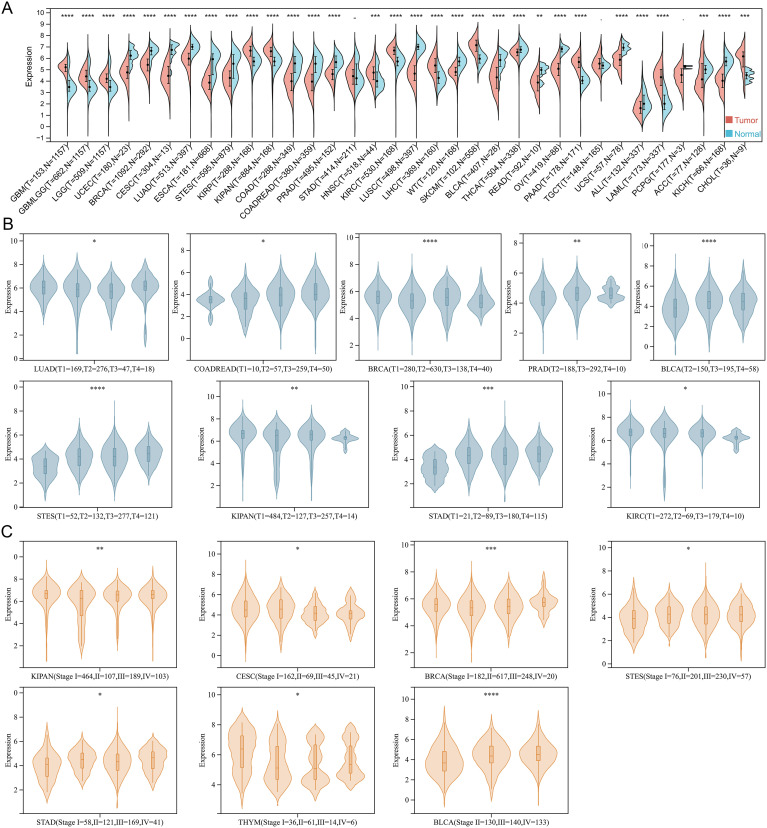
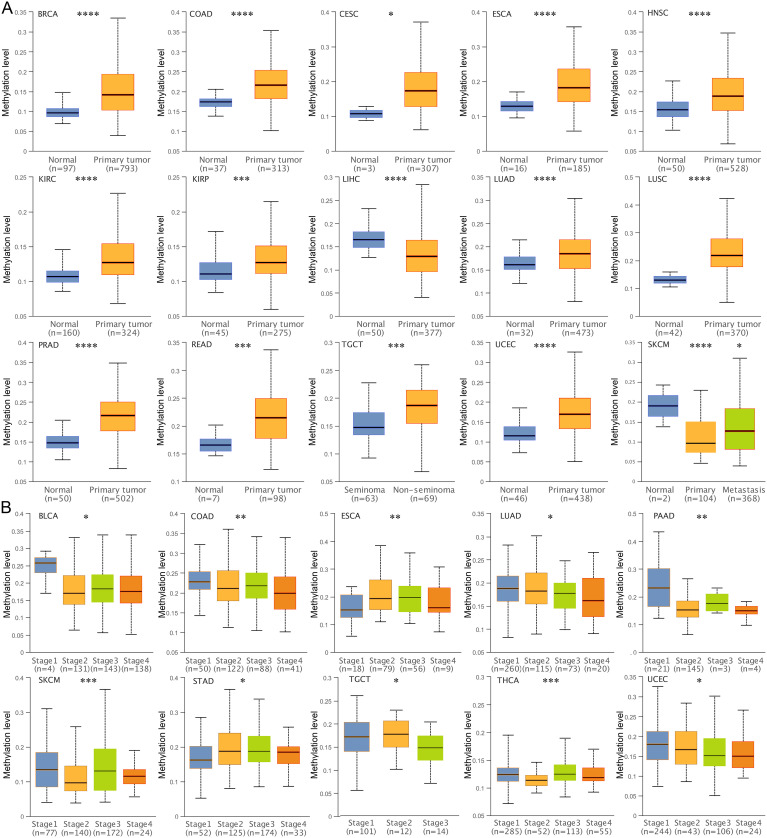
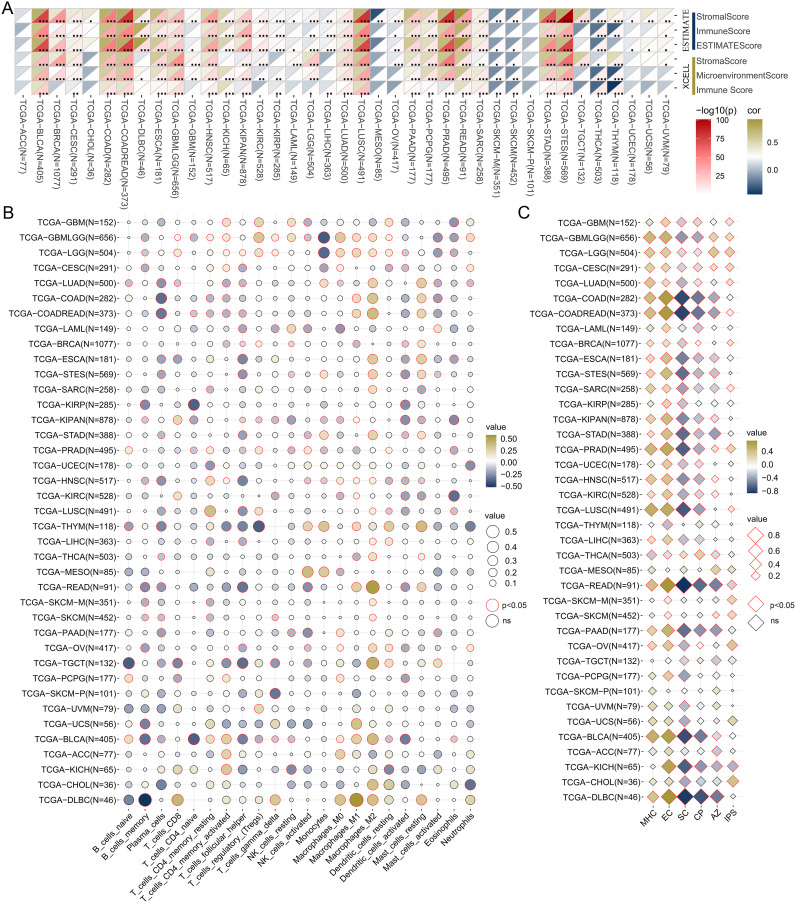
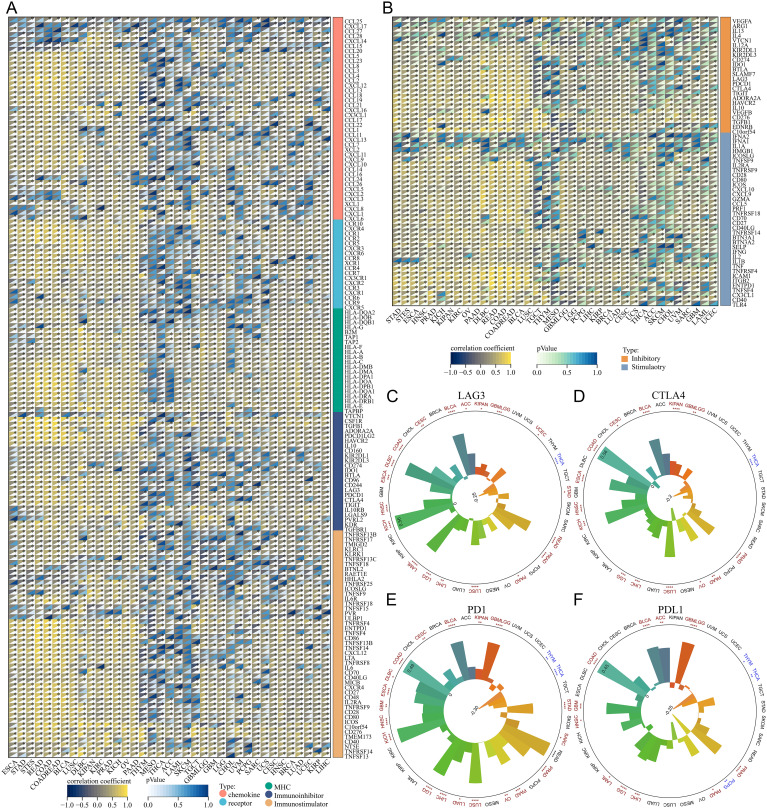
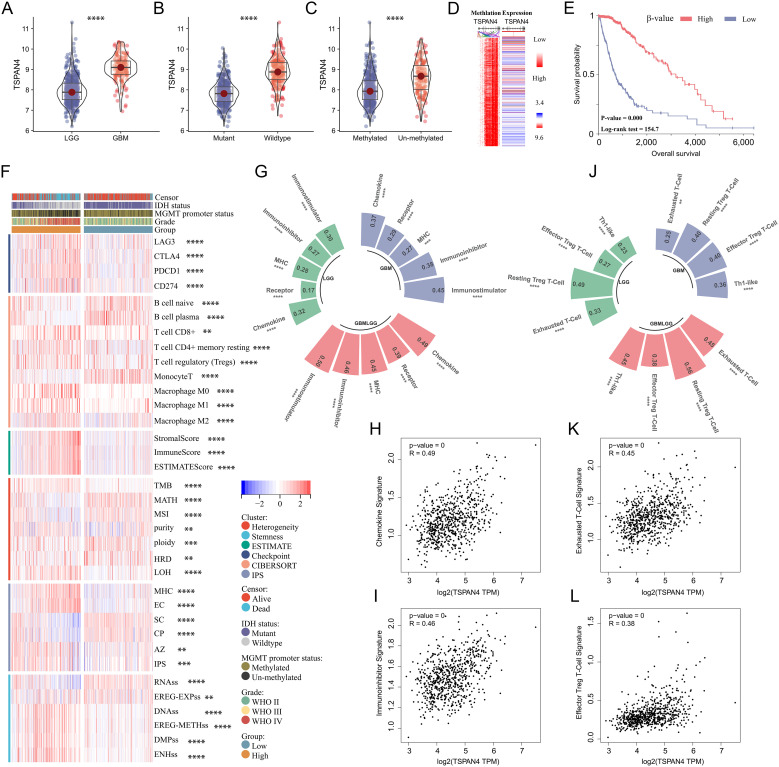
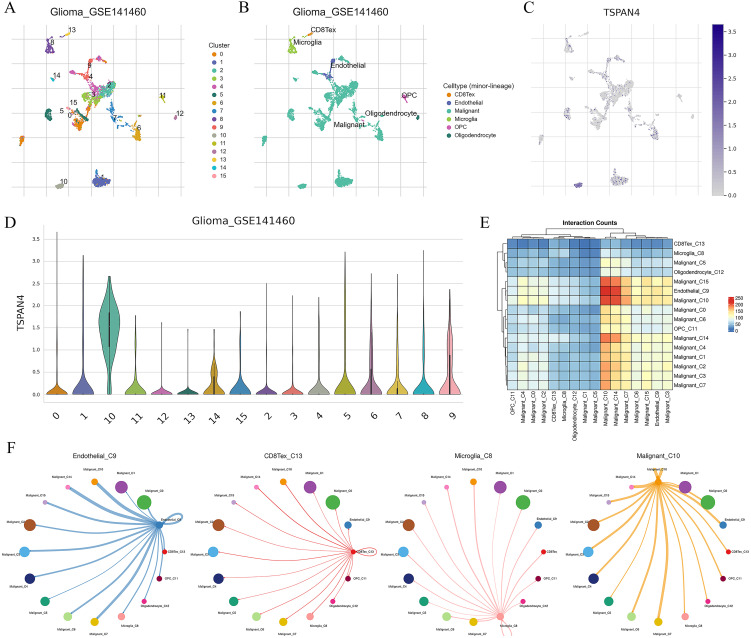
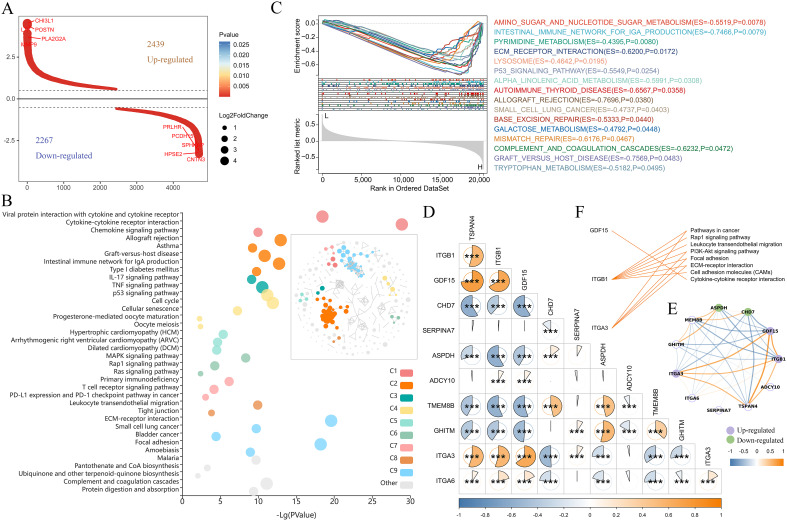
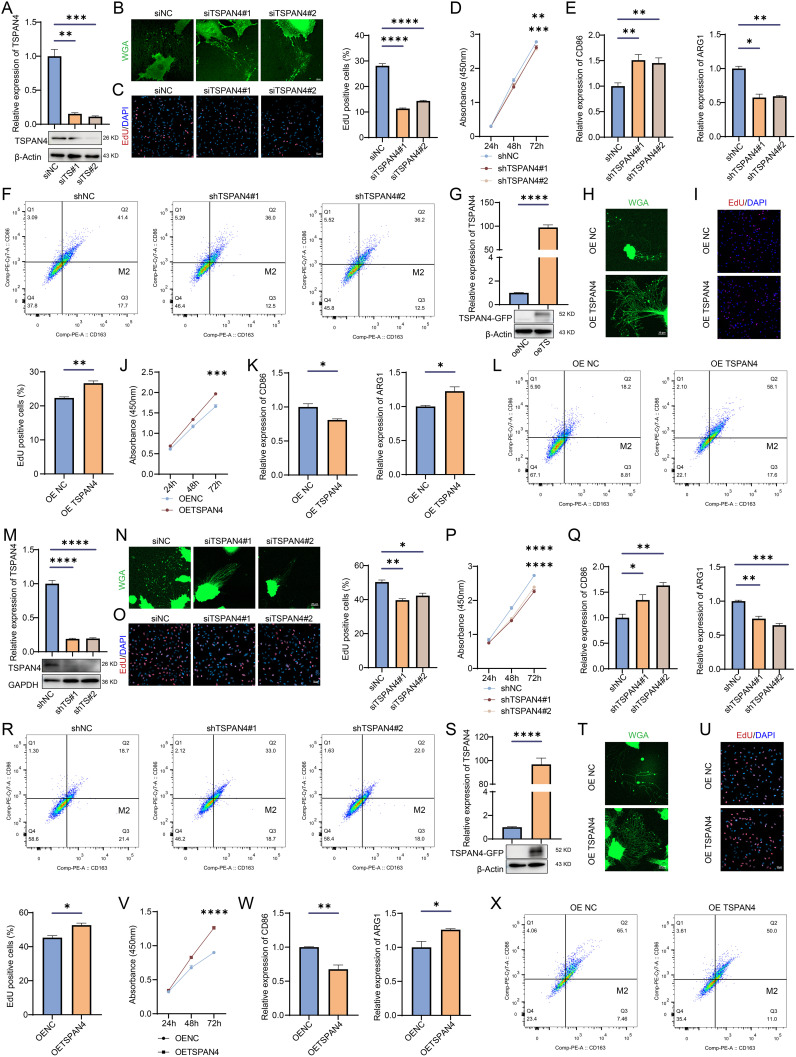
Results: Our analysis reveals that TSPAN4 is aberrantly expressed in various tumors, likely linked to its methylation status. It correlates with tumor heterogeneity, stemness, and a suppressive immune microenvironment. In glioma, TSPAN4 enhances cell proliferation and promotes macrophage polarization toward the immunosuppressive M2 phenotype.

Conclusions: TSPAN4, as a migrasome regulator, plays a crucial role in shaping the immunosuppressive tumor microenvironment in pan-cancer.

Keywords: TSPAN4; glioma; pan-cancer; prognosis; tumor immune microenvironment.


Conflict of interest statement

The authors declare that the research was conducted in the absence of any commercial or financial relationships that could be construed as a potential conflict of interest.

Figures

Figure 1
Figure 1
The expression of TSPAN4 in pan-cancer. (A) Split violin diagram showing TSPAN4 expression between normal and tumor samples in the TCGA TARGET GTEx dataset. (B) Violin plot showing TSPAN4 expression between different T staging subgroups. (C) Violin plot showing TSPAN4 expression between different stages. *P< 0.05; **P< 0.01; ***P< 0.001, ****P< 0.0001.
Figure 2
Figure 2
Analysis of DNA methylation level of TSPAN4 promoter in pan-cancer. (A) Box-whisker plot showing the DNA methylation level (average beta value) of TSPAN4 promoter in pan-cancer dataset. (B) Box-whisker plot showing the DNA methylation level (average beta value) between different stages in pan-cancer dataset. *P< 0.05; **P< 0.01; ***P< 0.001, ****P< 0.0001.
Figure 3
Figure 3
Prognostic analysis of TSPAN4 in pan-cancer dataset. (A) Cox regression analysis of TSPAN4 in pan-cancer dataset. (B) Kaplan-Meier curve describing the overall survival of the TSPAN4 high-expression group and low-expression group in pan-cancer. (C) Kaplan-Meier curve describing the Disease-free survival of the TSPAN4 high-expression group and low-expression group in pan-cancer.
Figure 4
Figure 4
Analysis of the relationship between TSPAN4 and tumor heterogeneity and stemness. (A) The relationship between TSAPN4 and TMB, (B) MATH, (C) MSI, (D) NEO, (E) purity, (F) ploidy, (G) HRD, (H) LOF in the pan-cancer dataset. (I) The relationship between TSAPN4 and DNAss, (J) EREG-METHs, (K) DMPss, and (L) ENHs in the pan-cancer dataset.
Figure 5
Figure 5
Analysis of the relationship between TSPAN4 and tumor microenvironment in pan-cancer dataset. (A) The relationship between TSPAN4 and microenvironment scores calculated by ESTIMATE and XCELL algorithm. (B) The relationship between TSPAN4 and 22 infiltrating immune cells calculated by CIBERSORT algorithm. (C) The relationship between TSPAN4 and Immunophenoscore calculated by IPS algorithm. *, P< 0.05; **, P< 0.01; ***, P< 0.001.
Figure 6
Figure 6
Analysis of the relationship between TSPAN4 and tumor immune characteristics in the pan-cancer dataset. (A, B) Correlation between TSPAN4 and immunomodulators in the pan-cancer dataset. (C) Correlation between TSPAN4 and four immune checkpoints LAG3, (D) CTLA4, (E) PD1 and (F) PDL1 in pan-cancer dataset. *P< 0.05; **P< 0.01; ***P< 0.001, ****P< 0.0001.
Figure 7
Figure 7
Comprehensive analysis of TSPAN4 in glioma. (A-C) Violin plots displaying TSPAN4 expression level in subgroups with different clinical characteristics in TCGA GBMLGG cohort. (D) Heatmap displaying the relationship in TSPAN4 expression and methylation levels. (E) Kaplan-Meier curve describing the overall survival of TSPAN4 high-methylation group and low-methylation group in TCGA GBMLGG cohort. (F) Heatmap displaying the differences in heterogeneity, stemness and immune status between TSPAN4 high-expression and low-expression groups. (G-I) Correlation between TSPAN4 and immunoregulatory signatures in glioma. (J-L) Correlation between TSPAN4 and immunocyte signatures in glioma. **P< 0.01; ***P< 0.001, ****P< 0.0001.
Figure 8
Figure 8
Analysis of TSPAN4 in the GBM single-cell RNA-seq dataset: (A) UMAP analysis of all cells in GSE141460. (B) UMAP plot displaying cell type annotation. (C) Expression of TSPAN4 across cell lineages depicted in UMAP plots. (D) Expression of TSPAN4 across cell lineages illustrated in violin plots. (E) Heatmap demonstrating ligand-receptor interactions among cell clusters. (F) Circos plot illustrating ligand-receptor interactions between malignant cluster 10 and other cell types.
Figure 9
Figure 9
Pathway analysis regulated by TSPAN4 in gliomas. (A) Screening of differentially expressed genes between TSPAN4 high- and low-expression groups. (B) KEGG pathway analysis of up-regulated genes, C1-C9 represents different clusters of signaling pathways. (C) GSEA of TSPAN4 in TCGA cohort. (D, E) Correlation analysis between TSAPN4 and its interacting partners obtained from the STRING database. (F) Line link showing the KEGG pathways involved by the up-regulated partners. *P< 0.05, ***P< 0.001.
Figure 10
Figure 10
Effect of TSPAN4 on glioma cells. (A) Confirmation of TSPAN4 knockdown efficiency in U87 MG cells (B) Representative images of migrasomes in TSPAN4 knockdown and control U87 MG cells. (C) EdU assay and (D) CCK8 assay for assessing the proliferative capacity of TSPAN4 knockdown and control U87 MG cells. (E) qRT-PCR and (F) flow cytometry analyses to evaluate M1/M2 macrophage polarization. (G) Validation of TSPAN4 overexpression in U87 MG cells. (H) Representative images of migrasomes in TSPAN4 overexpression and control U87 MG cells. (I) EdU assay and (J) CCK8 assay to evaluate cell proliferation ability of TSPAN4 overexpression and control U87 MG cells. (K) qRT-PCR and (L) flow cytometry analyses of M1/M2 macrophage polarization. (M) Verification of TSPAN4 knockdown efficiency in LN229 glioma cells (N) Representative images of migrasomes in TSPAN4 knockdown and control LN229 glioma cells. (O) EdU assay and (P) CCK8 assay to evaluate cell proliferation ability of TSPAN4 knockdown and control LN229 glioma cells. (Q) qRT-PCR and (R) flow cytometry analyses of M1/M2 macrophage polarization. (S) Validation of TSPAN4 overexpression in LN229 glioma cells. (T) Representative images of migrasomes in TSPAN4 overexpression and control LN229 glioma cells. (U) EdU assay and (V) CCK8 assay to evaluate cell proliferation ability of TSPAN4 overexpression and control LN229 glioma cells. (W) qRT-PCR and (X) flow cytometry analyses of M1/M2 macrophage polarization. *P< 0.05; **P< 0.01; ***P< 0.001, ****P< 0.0001.

Similar articles

Cited by

References

    1. Ma L, Li Y, Peng J, Wu D, Zhao X, Cui Y, et al. . Discovery of the migrasome, an organelle mediating release of cytoplasmic contents during cell migration. Cell Res. (2015) 25:24–38. doi: 10.1038/cr.2014.135 - DOI - PMC - PubMed
    1. Zhu M, Zou Q, Huang R, Li Y, Xing X, Fang J, et al. . Lateral transfer of mRNA and protein by migrasomes modifies the recipient cells. Cell Res. (2021) 31:237–40. doi: 10.1038/s41422-020-00415-3 - DOI - PMC - PubMed
    1. Zhang C, Li T, Yin S, Gao M, He H, Li Y, et al. . Monocytes deposit migrasomes to promote embryonic angiogenesis. Nat Cell Biol. (2022) 24:1726–38. doi: 10.1038/s41556-022-01026-3 - DOI - PubMed
    1. Jiang D, Jiang Z, Lu D, Wang X, Liang H, Zhang J, et al. . Migrasomes provide regional cues for organ morphogenesis during zebrafish gastrulation. Nat Cell Biol. (2019) 21:966–77. doi: 10.1038/s41556-019-0358-6 - DOI - PubMed
    1. Jankovičová J, Sečová P, Michalková K, Antalíková J. Tetraspanins, more than markers of extracellular vesicles in reproduction. Int J Mol Sci. (2020) 21:7568. doi: 10.3390/ijms21207568 - DOI - PMC - PubMed

LinkOut - more resources