

Metabolism and immune responses of striped hamsters to ectoparasite challenges: insights from transcriptomic analysis
- PMID: 39723213
- PMCID: PMC11669363
- DOI: 10.3389/fimmu.2024.1516382
Metabolism and immune responses of striped hamsters to ectoparasite challenges: insights from transcriptomic analysis
Abstract
Introduction: The striped hamster, often parasitized by ectoparasites in nature, is an ideal model for studying host-ectoparasite molecular interactions. Investigating the response to ectoparasites under laboratory conditions helps elucidate the mechanism of host adaptations to ectoparasite pressure.
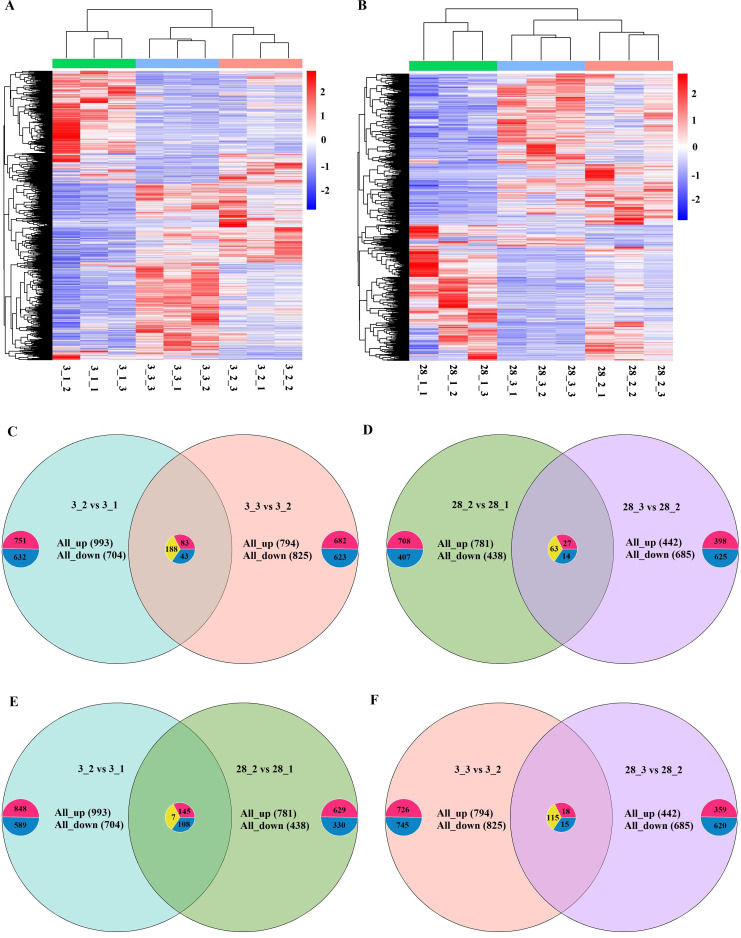
Methods: Using transcriptome sequencing, we analyzed gene expression in striped hamsters after short-term (3 days) and long-term (28 days) flea (Xenopsylla cheopis) parasitism. Differentially expressed genes (DEGs) were identified and subjected to Gene Ontology (GO) and Kyoto Encyclopedia of Genes and Genomes (KEGG) enrichment analyses. Hub genes were pinpointed using protein-protein interaction (PPI) network analysis and the MCODE in Cytoscape. Gene Set Enrichment Analysis (GSEA) was used to further clarify the functional pathways of these hub genes. Validation of DEGs was performed via RT-qPCR. Additionally, the concentrations of reactive oxygen species (ROS), superoxide dismutase (SOD), glutathione peroxidase (GSH-Px) and catalase (CAT) were determined using specific enzyme-linked immunosorbent assay (ELISA) detection kits for hamsters.
Results: GO analysis revealed that during early parasitism, hosts primarily responded to the ectoparasites by adjusting the expression of genes related to metabolic functions. As parasitism persisted, the immune response became prominent, activating various immune pathways against ectoparasites. KEGG analysis confirmed the ongoing roles of metabolism and immunity. Notably, the chemical carcinogenesis - reactive oxygen species pathway was upregulated during flea parasitism, with downregulation of hub genes ATP5MC1 and ATP5MC2, highlighting the importance of mitochondrial function in oxidative stress. ELISA findings revealed that on day 3, flea parasitism groups showed elevated ROS expression and reduced SOD and CAT levels compared to the control group. By day 28, only SOD expression showed a significant decrease in both parasitism groups.
Conclusion: This study uncovered the dynamic changes in metabolism and immune responses of striped hamsters parasitized by Xenopsylla cheopis. Hosts adjust their physiological and immune states to optimize survival strategies during different ectoparasite stages, enhancing our understanding of host-ectoparasite interactions. This also paves the way for further research into how hosts regulate complex biological processes in response to ectoparasite challenges.
Keywords: ectoparasites parasitism; immunity; metabolism; striped hamsters; transcriptome analysis.
Copyright © 2024 Lun, Wang, Zhao, Yue, Meng, Liu, Song, Liang and Lu.
Conflict of interest statement
The authors declare that the research was conducted in the absence of any commercial or financial relationships that could be construed as a potential conflict of interest.
Figures


Similar articles
-
Transcriptome analysis of Kunming mice responses to the bite of Xenopsylla cheopis.Parasit Vectors. 2024 Jun 7;17(1):250. doi: 10.1186/s13071-024-06331-4. Parasit Vectors. 2024. PMID: 38849919 Free PMC article.
-
Norway rat (Rattus norvegicus) ectoparasites in livestock production systems from central Argentina: Influencing factors on parasitism.Acta Trop. 2020 Mar;203:105299. doi: 10.1016/j.actatropica.2019.105299. Epub 2019 Dec 12. Acta Trop. 2020. PMID: 31837978
-
Transcriptome analysis of regenerated dermis stimulated by mechanical stretch.Gene. 2025 Apr 5;943:149267. doi: 10.1016/j.gene.2025.149267. Epub 2025 Jan 20. Gene. 2025. PMID: 39842648
-
Bioinformatics analyses of gene expression profile identify key genes and functional pathways involved in cutaneous lupus erythematosus.Clin Rheumatol. 2022 Feb;41(2):437-452. doi: 10.1007/s10067-021-05913-2. Epub 2021 Sep 23. Clin Rheumatol. 2022. PMID: 34553293
-
Ecological immunology of bird-ectoparasite systems.Trends Parasitol. 2010 Nov;26(11):530-9. doi: 10.1016/j.pt.2010.06.005. Epub 2010 Jul 3. Trends Parasitol. 2010. PMID: 20599426 Review.
References
MeSH terms
Substances
LinkOut - more resources
Full Text Sources
Research Materials
Miscellaneous