. 2024 Dec 11:15:1490878.
doi: 10.3389/fphar.2024.1490878. eCollection 2024.

Paromomycin targets HDAC1-mediated SUMOylation and IGF1R translocation in glioblastoma

Affiliations

Paromomycin targets HDAC1-mediated SUMOylation and IGF1R translocation in glioblastoma

Zhong Min et al. Front Pharmacol. .

Abstract

Objective: This study investigates the effects of Paromomycin on SUMOylation-related pathways in glioblastoma (GBM), specifically targeting HDAC1 inhibition.

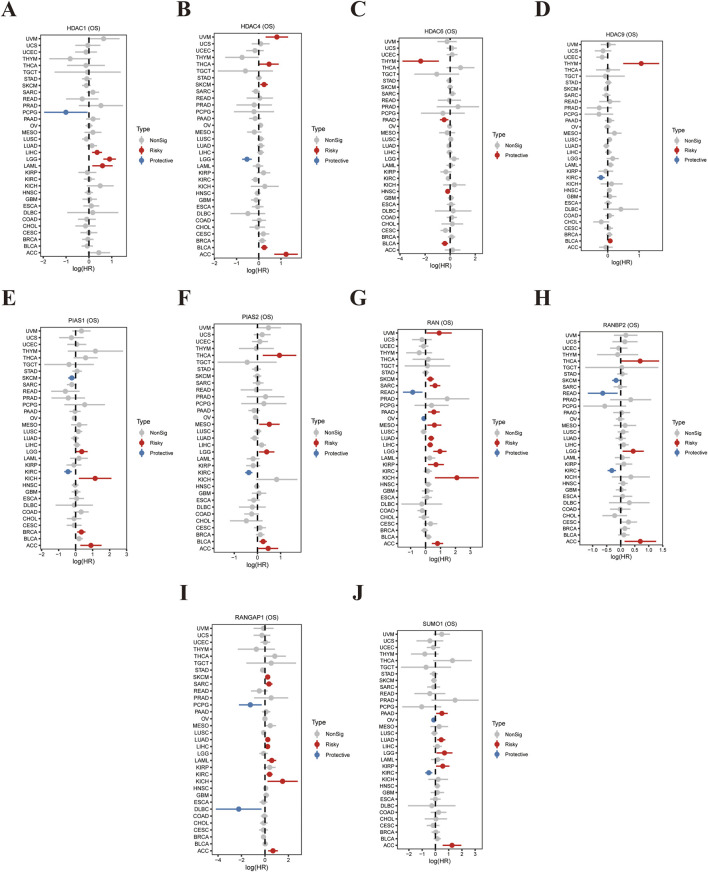
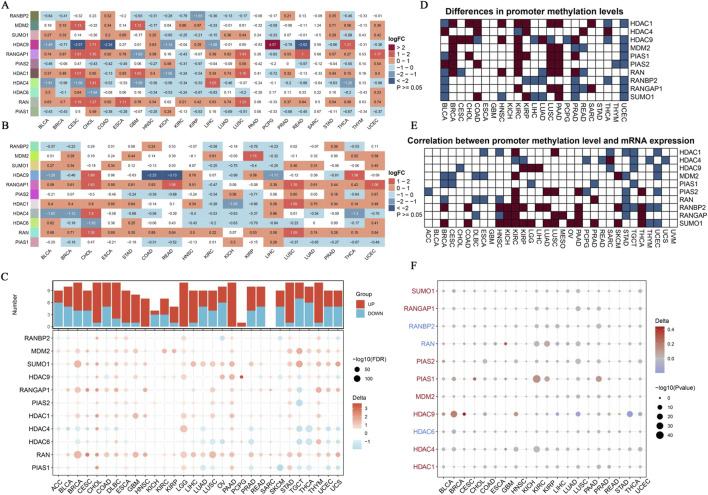
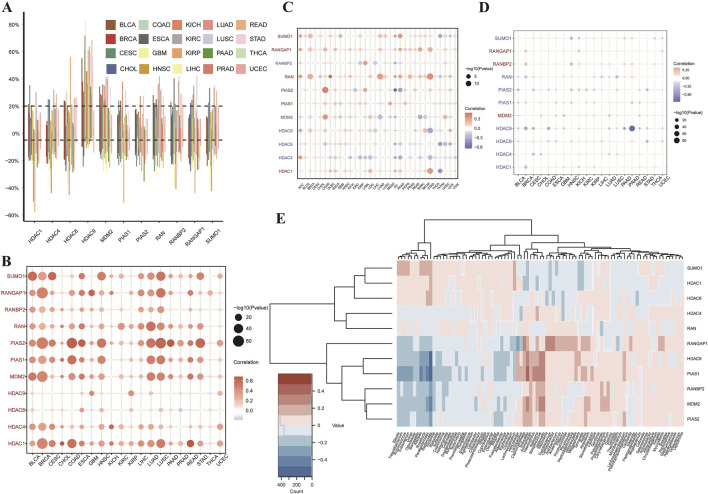
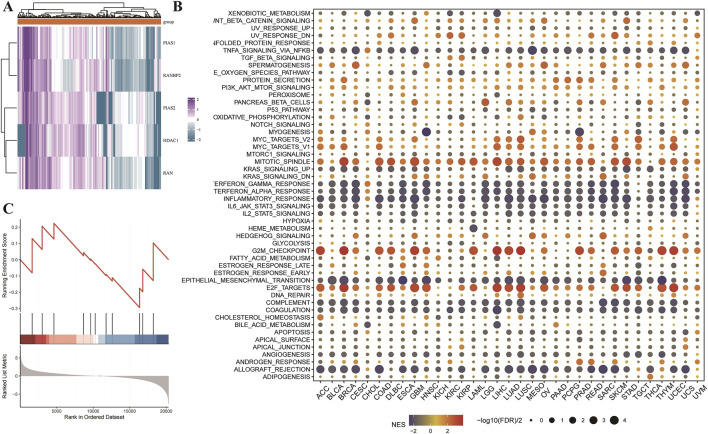
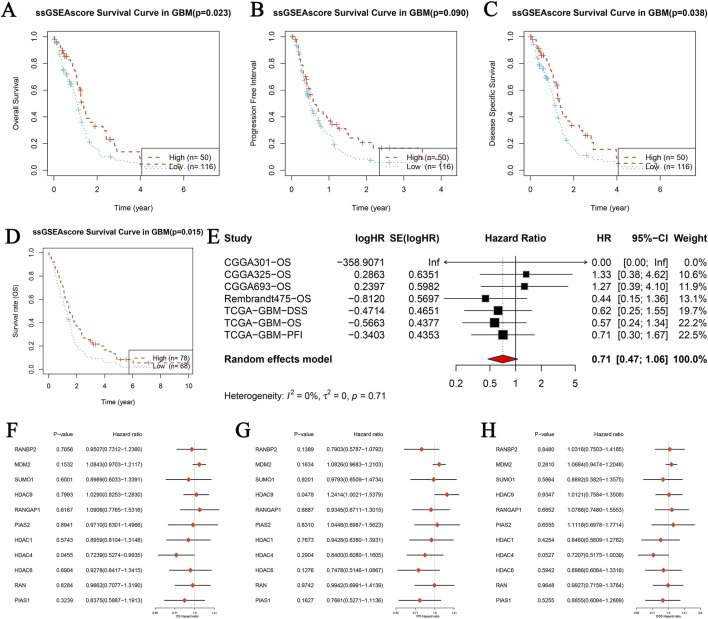
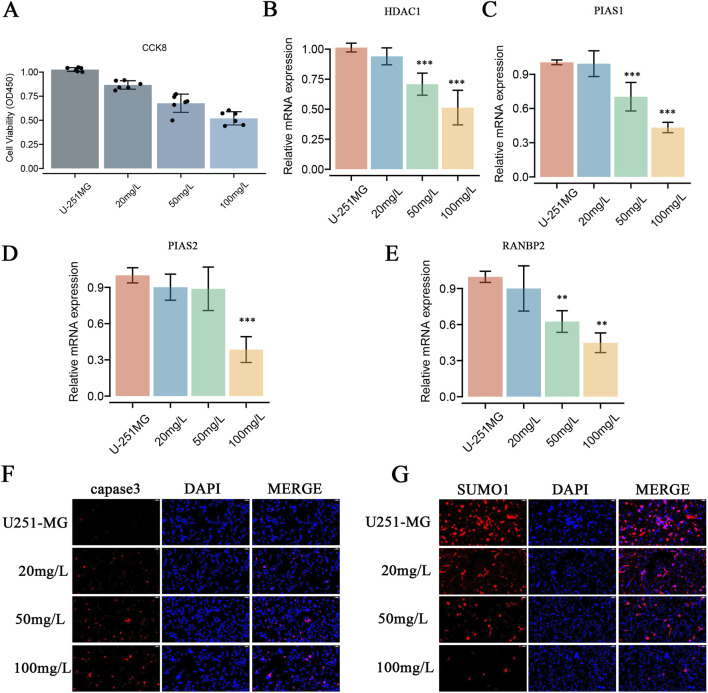
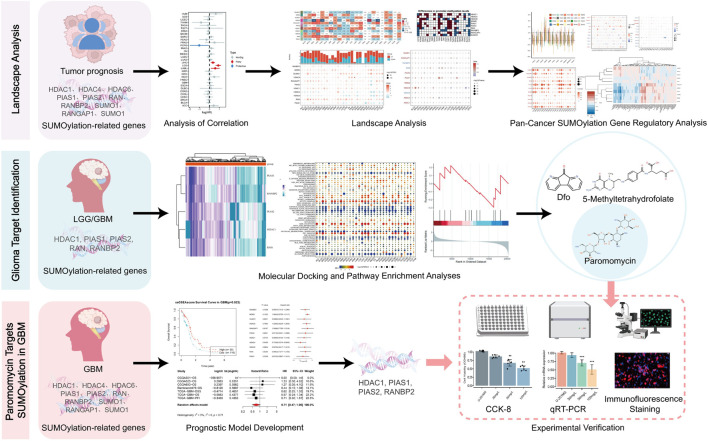
Methods: Using TCGA and GTEx datasets, we identified SUMOylation-related genes associated with GBM prognosis. Molecular docking analysis suggested Paromomycin as a potential HDAC1 inhibitor. In vitro assays on U-251MG GBM cells were performed to assess Paromomycin's effects on cell viability, SUMOylation gene expression, and IGF1R translocation using CCK8 assays, qRT-PCR, and immunofluorescence.

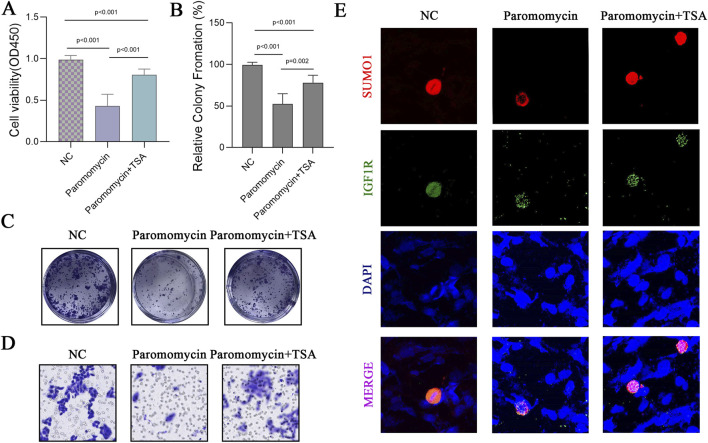
Results: Paromomycin treatment led to a dose-dependent reduction in GBM cell viability, colony formation, and migration. It modulated SUMO1 expression and decreased IGF1R nuclear translocation, an effect reversible by the HDAC1 inhibitor Trochostatin A (TSA), suggesting Paromomycin's involvement in SUMO1-regulated pathways.

Conclusion: This study highlights Paromomycin's potential as a therapeutic agent for GBM by targeting HDAC1-mediated SUMOylation pathways and influencing IGF1R translocation, warranting further investigation for its clinical application.

Keywords: HDAC1; IGF1R; Paromomycin; SUMOylation; drug screening; glioblastoma multiforme.


Conflict of interest statement

The authors declare that the research was conducted in the absence of any commercial or financial relationships that could be construed as a potential conflict of interest.

Figures

FIGURE 1
FIGURE 1
Correlation Between SUMOylation-Related Gene Expression and Tumor Prognosis. (A) The forest plot presents hazard ratios (HR) and 95% confidence intervals (CI) for HDAC1 expression and its association with overall survival (OS) across various cancer types. Each line represents a specific cancer, with red indicating a negative (risk) factor and blue indicating a positive (protective) factor. (B) Similar analysis for HDAC4, displaying its relevance to OS across multiple cancers, where HR and CI indicate the impact of HDAC4 expression on patient outcomes. (C) Depicts the influence of HDAC6 expression on OS, with corresponding HR and CI values highlighting its role in cancer prognosis. (D) A validation analysis utilizing an independent dataset to confirm or compare the effects of HDAC6 expression on OS. (E) Shows the relationship between PIAS1 expression and OS across various malignancies, demonstrating its potential role in cancer progression. (F) Displays the impact of PIAS2 expression on OS, with HR and CI values reflecting its prognostic significance in different cancers. (G) This forest plot illustrates the association between RAN expression and OS across all analyses. (H) Shows the influence of RANBP2 expression on OS, with HR and CI values indicating its predictive power for tumor outcomes. (I) Analyzes the relationship between RANGAP1 expression and OS, highlighting its potential role in enhancing survival benefits in cancer patients. (J) Presents HR and CI values for SUMO1 expression, showcasing its correlation with patient prognosis and impact on OS across various cancer types.
FIGURE 2
FIGURE 2
Expression Landscape of SUMOylation-Related Genes in Pan-Cancer. (A) Using unpaired methods, we analyzed differential gene expression driven by SUMOylation across various pan-cancer samples. Each row represents a unique SUMOylation-related gene, while each column corresponds to a specific cancer type. (B) This panel displays the correlation between SUMOylation-related gene expression in paired cancer samples. The heatmap, consistent with (A), uses log2FC values to depict the contrast in gene expression between tumor and normal tissues within the same patients. (C) We explored differential expression of SUMOylation-associated genes across several datasets from TCGA-GTEx. The dot plot shows log2FC values, with dot size corresponding to the -log10 of corrected p-values. Downregulation is shown by blue dots, while upregulation is represented by red dots. (D) Analysis of promoter methylation in SUMOylation-related genes. The heatmap shows differences in promoter methylation levels between tumor and normal tissues, with a gradient from white to dark blue signifying increasing methylation levels. (E) This panel examines the correlation between promoter methylation levels and expression of SUMOylation-related genes. The heatmap displays Pearson correlation coefficients, where dark blue represents strong negative correlations, and dark red represents strong positive correlations. (F) Delta values showing the differences in promoter methylation levels of SUMOylation-related genes between tumor and normal tissues in pan-cancer. The bubble plot depicts delta values, with bubble size corresponding to the negative log10 of p-values, and color indicating the direction of change (red for increased methylation, blue for reduced methylation).
FIGURE 3
FIGURE 3
Analysis of SUMOylation-Related Genes in Pan-Cancer: Copy Number Variation, Methylation, and Tumor Mutation Burden. (A) The bar plot shows the rates of copy number variation (CNV) in SUMOylation-related genes across 20 different types of cancer. Each bar represents a cancer type, with colors as per the legend. Data points show variation rates, with the vertical axis displaying the percentage of samples with CNV, and the horizontal axis listing the cancer types. (B) Correlation of Copy Number Variation (CNV) and Gene Expression. This bubble plot illustrates the correlation between CNV and expression levels of SUMOylation-related genes across cancer types. Bubble color denotes the direction and magnitude of the correlation coefficient—red for positive correlations and blue for negative—with bubble size reflecting correlation strength. (C) Relationship between Tumor Mutation Burden (TMB) and Gene Expression. This bubble plot presents the association between TMB and expression of SUMOylation-related genes across various cancers. Bubble size indicates correlation significance, with color intensity showing relationship strength, similar to (B). (D) Relationship between Promoter Methylation and Gene Expression. This bubble plot illustrates the correlation between promoter methylation and expression levels of SUMOylation-related genes across multiple cancers. Bubble size signifies correlation significance, while color indicates the direction of the relationship. (E) Gene Expression in Different Tumor Microenvironments. The heatmap presents expression levels of SUMOylation-related genes across various tumor microenvironments. Each row represents a gene, and each column a specific tumor type. The color gradient indicates expression levels, with pink for lower expression and blue for higher expression.
FIGURE 4
FIGURE 4
Utilizing molecular docking and pathway enrichment analyses to study Low-Grade Glioma (LGG) and GBM. (A) Heatmap for core protein drug sensitivity screening and molecular docking. This heatmap depicts the relationship between important proteins (HDAC1, PIAS1, PIAS2, RAN, and RANBP2) and the prognosis of low-grade glioma (LGG) patients, as determined by a pan-cancer investigation. These proteins have been identified as important predictors of poor prognosis in LGG. A simulated molecular docking research was performed to discover possible therapeutic medicines that target these proteins. These major proteins’ three-dimensional structures were acquired from the PDB database, and 321 small molecule ligands were identified from the NCBI PubChem database. These ligands were then molecular docked with the target proteins to determine their binding affinities, which were calculated using LibDockScore. The data show that Dfo, Paromomycin, and 5-Methyltetrahydrofolate have strong binding affinities to HDAC1, PIAS1, PIAS2, RAN, and RANBP2, implying that they might be used as therapeutic candidates to target ubiquitin-like modification pathways in LGG. (B) Pan-cancer. GSEA enrichment analysis: The dot plot depicts the enrichment analysis of gene sets connected to distinct signaling pathways across cancer types using the GSEA approach. The normalized enrichment score (NES) is shown by color gradients, with red indicating a positive NES (enriched in the cancer group) and blue indicating a negative NES (enriched in the control group). The dots’ sizes show the enrichment’s significance level (-log10(FDR q-value)) for each gene set. Significant processes that have been enhanced include xenobiotic metabolism, epithelial-mesenchymal transition, and fatty acid metabolism. (C) GSEA enrichment analysis of the sumoylation-related gene sets in GBM: The figure depicts the enrichment analysis of sumoylation-related gene sets in GBM versus normal tissues, which was performed using the clusterProfiler software. The enrichment score curve shows the ranking of genes according on their expression levels in the GBM and control groups. The bar plot under the curve shows the position of genes in the ranked list, demonstrating the degree of enrichment for sumoylation-related activities in GBM.
FIGURE 5
FIGURE 5
Prognostic analysis of genes related to SUMOylation in glioblastoma (GBM) using single-sample gene set enrichment analysis (ssGSEA). (A–D) Kaplan-Meier survival analysis was performed for three distinct survival outcomes in GBM: Overall Survival (OS) (A), Progression-Free Interval (PFI) (B), and Disease-Specific Survival (DSS) (C). The study contrasts high and low ssGSEA scores for SUMOylation-related gene expression, with p-values indicating statistical significance. The datasets utilized include publicly accessible GBM patient data. (E) Meta-analysis of univariate Cox proportional hazards regression across several datasets for overall survival (OS) in GBM. The analysis incorporates papers from CGGA301, CGGA325, CGGA693, Rembrandt, and TCGA. The forest plot displays logHR, SE (logHR), Hazard Ratio (HR), 95% Confidence Interval (CI), and weight for each research. The random-effects model calculates the combined hazard ratio using heterogeneity statistics. (F–H) Forest plots of the hazard ratios for individual SUMOylation-related genes across various GBM datasets for OS (F), PFI (G), and DSS (H). Each figure displays the p-value, hazard ratio, and confidence intervals for the genes studied, providing information on their prognostic relevance.
FIGURE 6
FIGURE 6
Effects of Paromomycin on Cell Viability, Gene Expression, Apoptosis, SUMOylation, and Colony Formation in U-251MG Glioblastoma Cells. (A) Cell viability was assessed using the CCK8 assay. U-251MG cells were treated with varying concentrations of Paromomycin (20 mg/L, 50 mg/L, 100 mg/L), and the optical density (OD450) was measured. The results show a dose-dependent decrease in cell viability, indicating that Paromomycin effectively reduces the proliferation of U-251MG cells. (B–E) qRT-PCR analysis of relative mRNA expression levels of HDAC1, PIAS1, PIAS2, and RANBP2 after treatment with Paromomycin at different concentrations. The data show a significant downregulation of these genes in a dose-dependent manner, with the highest inhibition observed at 100 mg/L. Statistical significance was indicated as follows: **p < 0.01, ***p < 0.001 compared to the untreated control group. (F) Immunofluorescence staining for caspase-3 (red), a key marker of apoptosis, in U-251MG cells treated with increasing concentrations of Paromomycin. The results showed increased caspase-3 expression, indicating that apoptosis was induced by Paromomycin in U-251MG cells. (G) Immunofluorescence staining was performed to assess the levels of the SUMOylation protein (SUMO1, shown in red). Nuclei are stained with DAPI (blue). The results indicate that Paromomycin actively inhibits protein SUMOylation, as evidenced by a significant reduction in SUMO1 expression across various drug concentrations.
FIGURE 7
FIGURE 7
Effects of Paromomycin on Cell Viability, Colony Formation, Migration, and SUMOylation in U-251MG Glioblastoma Cells. (A) U-251MG glioblastoma cells were treated with Paromomycin and Paromomycin + TSA, and cell viability was assessed using the CCK8 assay. Optical density (OD450) values indicate a significant reduction in cell viability in the Paromomycin-treated group compared to the NC (negative control), with further reduction observed when combined with TSA. Statistical significance levels are indicated (*p < 0.001). (B) Quantitative analysis of colony formation assay, presented as relative colony formation percentages. Paromomycin treatment alone and in combination with TSA significantly decreased colony formation compared to the NC group. Statistical significance levels are indicated (*p < 0.001, **p = 0.002). (C) Representative images from the colony formation assay in U-251MG cells. Paromomycin treatment reduced both colony number and size, with an enhanced effect in combination with TSA. (D) Representative images from the transwell migration assay for U-251MG cells under the NC, Paromomycin, and Paromomycin + TSA conditions. (E) Immunofluorescence staining in U-251MG cells to assess the effect of Paromomycin on SUMO1 and IGF1R nuclear translocation. Red indicates SUMO1 staining, green indicates IGF1R, and blue represents DAPI-stained nuclei. The images suggest that Paromomycin reduces IGF1R nuclear translocation, possibly associated with SUMO1 modification.
FIGURE 8
FIGURE 8
Integrated bioinformatics and experimental analysis of Paromomycin targeting HDAC1 in GBM.

Similar articles

References

    1. Abuaisheh A., Aboud O. (2023). Biogenic amines in gliomas: a comprehensive literature review. Front. Biosci. Landmark Ed. 28, 141. 10.31083/j.fbl2807141 - DOI - PubMed
    1. Ahmed M. G., Shaheen N., Shaheen A., Meshref M., Nashwan A. J., Nassar N. A., et al. (2024). Outcomes of endovascular treatment alone or with intravenous alteplase in acute ischemic stroke Patients: a retrospective cohort study. Brain Hemorrhages 5, 21–28. 10.1016/j.hest.2023.09.003 - DOI
    1. Aldoghachi A. F., Aldoghachi A. F., Breyne K., Ling K.-H., Cheah P.-S. (2022). Recent advances in the therapeutic strategies of glioblastoma multiforme. Neuroscience 491, 240–270. 10.1016/j.neuroscience.2022.03.030 - DOI - PubMed
    1. Aly A., Singh P., Korytowsky B., Ling Y.-L., Kale H. P., Dastani H. B., et al. (2019). Survival, costs, and health care resource use by line of therapy in US Medicare patients with newly diagnosed glioblastoma: a retrospective observational study. Neuro-Oncology Pract. 7, 164–175. 10.1093/nop/npz042 - DOI - PMC - PubMed
    1. Asano Y. (2018). How to eliminate uncertainty in clinical medicine – clues from creation of mathematical models followed by scientific data mining. EBioMedicine 34, 12–13. 10.1016/j.ebiom.2018.07.001 - DOI - PMC - PubMed

LinkOut - more resources