. 2024 Dec 5:11:1478827.
doi: 10.3389/fcvm.2024.1478827. eCollection 2024.

Screening and regulatory mechanism exploration of M1 macrophage polarization and efferocytosis-related biomarkers in coronary heart disease

Affiliations

Screening and regulatory mechanism exploration of M1 macrophage polarization and efferocytosis-related biomarkers in coronary heart disease

Hong Gao et al. Front Cardiovasc Med. .

Abstract

Background: Macrophage polarization and efferocytosis have been implicated in CHD. However, the underlying mechanisms remain elusive. This study aimed to identify CHD-associated biomarkers using transcriptomic data.

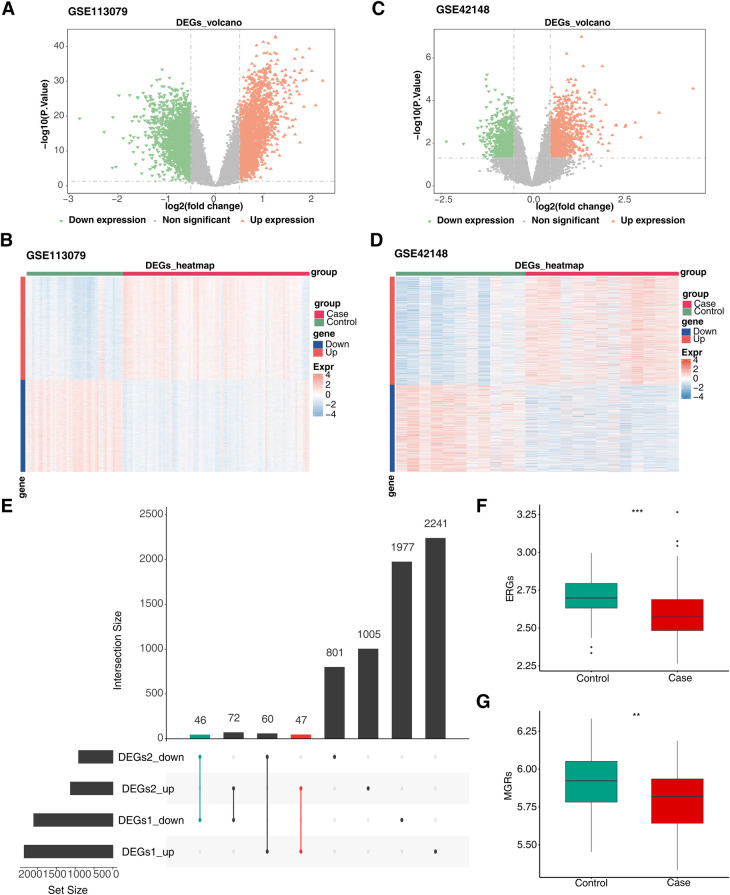
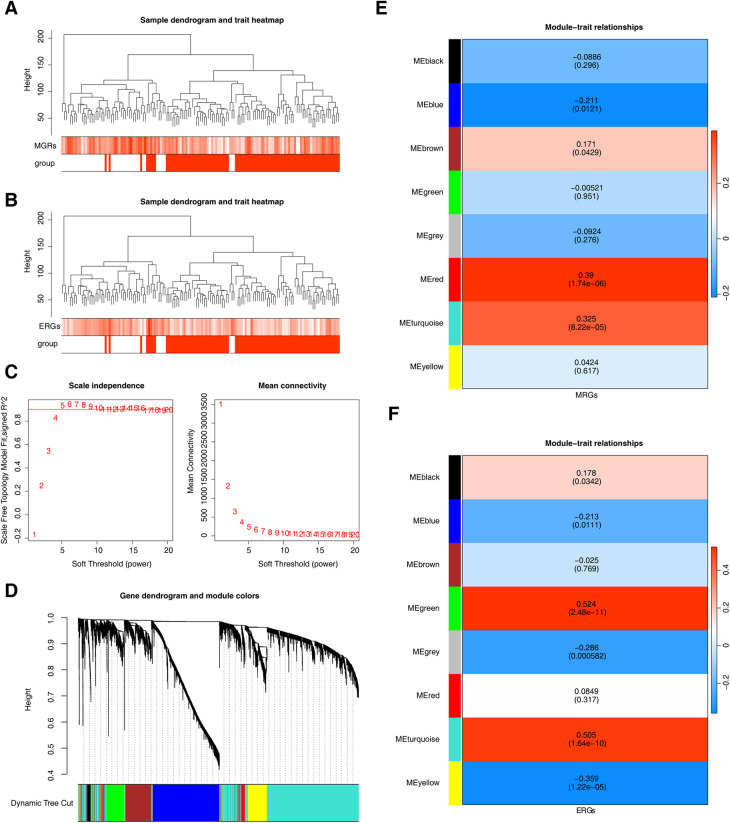
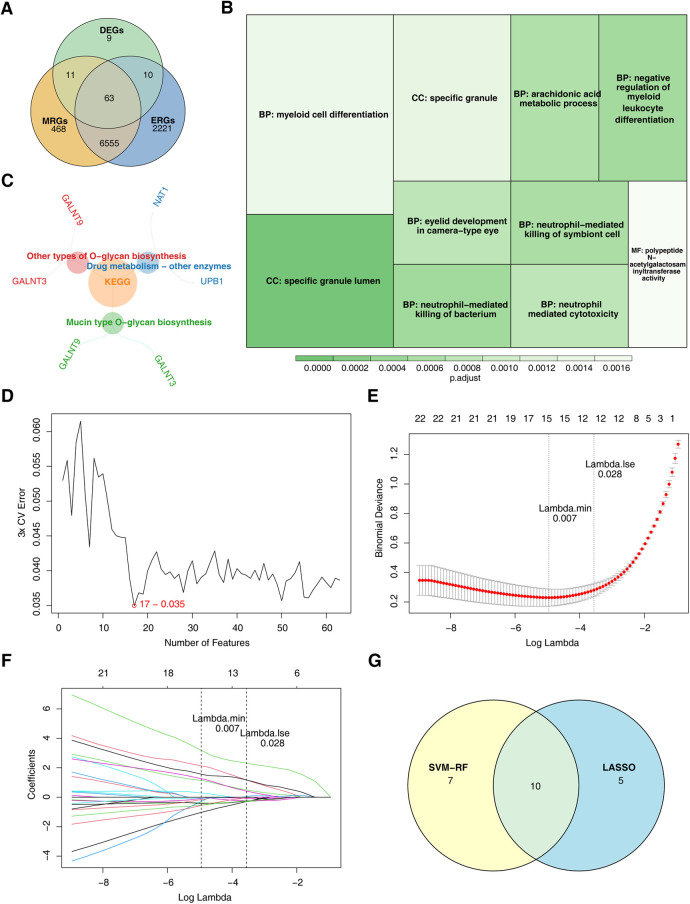
Methods: This study examined 74 efferocytosis-related genes (ERGs) and 17 M1 macrophage polarization-related genes (MRGs) across two CHD-relevant datasets, GSE113079 and GSE42148. Differential expression analysis was performed separately on each dataset to identify differentially expressed genes (DEGs1 and DEGs2). The intersection of upregulated and downregulated genes from both sets was then used to define the final DEGs. Subsequently, MRG and ERG scores were calculated within the GSE113079 dataset, followed by weighted gene co-expression network analysis (WGCNA) to identify key module genes. The overlap between these module genes and the DEGs yielded candidate biomarkers, which were further evaluated through machine learning, receiver operating characteristic (ROC) curve analysis, and expression profiling. These biomarkers were subsequently leveraged to explore immune infiltration patterns and to construct a molecular regulatory network. To further validate their expression, quantitative reverse transcriptase PCR (qRT-PCR) was performed on clinical CHD samples, confirming the relevance and expression patterns of these biomarkers in the disease.

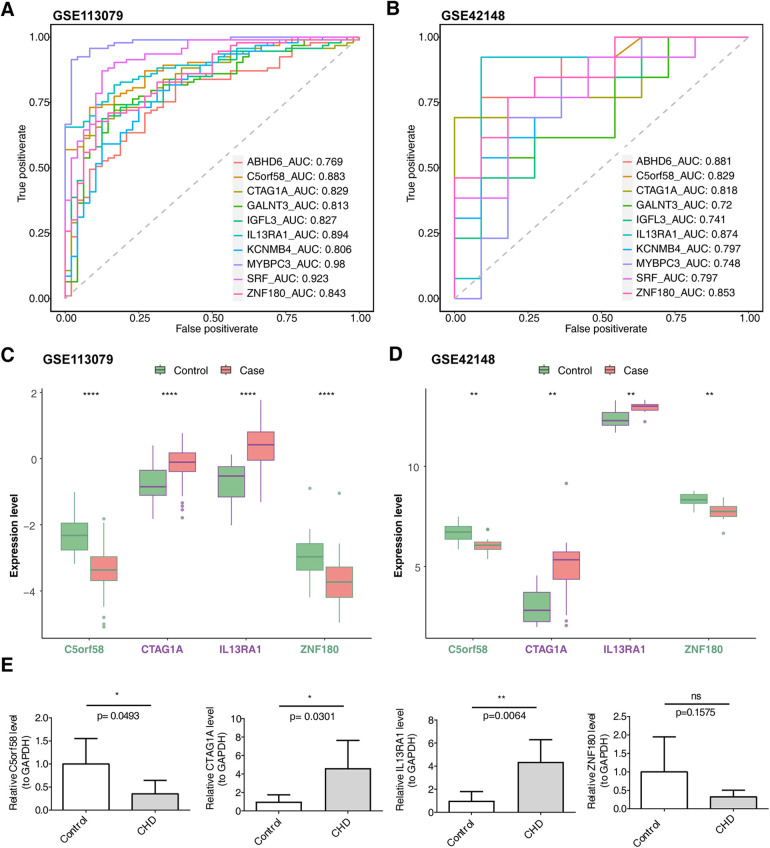
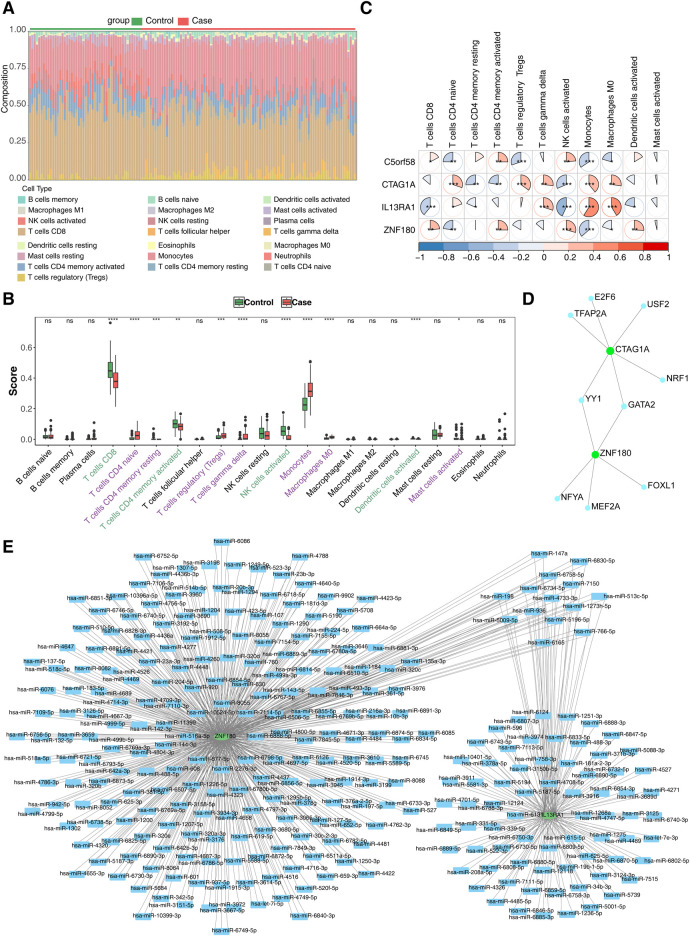
Results: A total of 93 DEGs were identified by intersecting the upregulated and downregulated genes from DEGs1 and DEGs2. WGCNA of the MRG and ERG scores identified 15,936 key module genes in the GSE113079 dataset. Machine learning and ROC analysis highlighted four biomarkers: C5orf58, CTAG1A, ZNF180, and IL13RA1. Among these, C5orf58, and ZNF180 were downregulated in CHD cases, while CTAG1A and IL13RA1 was upregulated. qRT-PCR results validated these findings for C5orf58, CTAG1A, ZNF180, and IL13RA1 showed inconsistent expression trends. Immune infiltration analysis indicated IL13RA1 all had a positive correlation with M0 macrophage, while had a negative correlation with. NK cells activated. The molecular regulatory network displayed that GATA2 and YY1 could regulate CTAG1A and ZNF180.

Conclusions: These results suggest that C5orf58, CTAG1A, ZNF180, and IL13RA1 serve as biomarkers linking M1 macrophage polarization and efferocytosis to CHD, providing valuable insights for CHD diagnosis and therapeutic strategies.

Keywords: C5orf58; CTAG1A; coronary heart disease; efferocytosis; macrophage polarization.


Conflict of interest statement

The authors declare that the research was conducted in the absence of any commercial or financial relationships that could be construed as a potential conflict of interest.

Figures

Figure 1
Figure 1
Screen for differentially expressed genes related to efferocytosis and M1 macrophage polarization in CHD. (A) Volcano plot of DEGs1. (B) Heatmap of DEGs1. (C) Volcano plot of DEGs2. (D) Heatmap of DEGs2. (E) Venn diagram of intersecting DEGs. The left - hand bar chart shows the number of genes in each subset; the upper bar chart shows the number of genes in each intersection; green represents the number of commonly down - regulated genes; red represents the number of commonly up - regulated genes. (F) Differences in ERGs scores between groups. (G) Differences in MRGs scores between groups. (A,C) Each point in the graph represents a gene. Orange represents significantly up - regulated genes, green represents significantly down - regulated genes, and gray represents non - significant genes. (B,D) Green represents the Control samples, and red represents the Case samples; in the graph, red indicates highly - expressed genes, and blue indicates low - expressed genes.
Figure 2
Figure 2
Genes related to M1 macrophage scores and efferocytosis in CHD. (A) Clustering of M1 macrophage samples. (B) Clustering of efferocytosis samples. (A,B) Branches represent samples, and the vertical axis represents the height of hierarchical clustering. The darker the color above, the higher the score, and the red group below represents disease samples. (C) Scale-free fit index and mean connectivity analysis for various soft-thresholding powers. The horizontal axis represents the power value of the weight parameter. In the left figure, the vertical axis is the scale - free fit index, that is, signed R2. The higher the square of the correlation coefficient is, the closer the network is to the scale - free distribution. In the right figure, the vertical axis represents the average value of all gene adjacency functions in the corresponding gene module. (D) Dendrogram of co-expression module clustering. Different colors represent distinct co-expression modules. (E,F) Heatmap of the correlation between modules and scored traits. It contains a group of highly related genes, and each color indicates a specific gene module.Select modules with an absolute value of correlation greater than 0.3 and P less than 0.05. Therefore, select the red, turquoise, and green, turquoise, yellow modules as key modules respectively.
Figure 3
Figure 3
ZNF180, CTAG1A, IL13RA1, and C5orf58 identified as biomarkers related to efferocytosis and M1 macrophage polarization. (A) Candidate gene identification. (B) GO enrichment results for candidate genes. The size of the square represents the number of enriched genes; the color represents significance. (C) KEGG enrichment results for candidate genes. (D) SVM-RFE analysis. The abscissa represents the number of genes, and the ordinate represents the error rate (E,F) LASSO regression analysis graph. (E) The graph of the penalty term parameter. The position of the left - hand dotted line is the position where the cross - validation error is the smallest. Determine log(Lambda) according to this position (lambda.min), and the number of feature genes is shown above. Find the optimal log(Lambda) value, and find the corresponding genes and their coefficients in the right figure; (F) After different variables are penalized by λ, the changes in their coefficients. (G) Genes identified by both machine learning algorithms.
Figure 4
Figure 4
Biomarker expression levels and diagnostic performance evaluation. (A) ROC curves for biomarkers in the GSE113079 dataset. (B) ROC curves for biomarkers in the GSE42148 dataset. (A,B) The abscissa is the false positive rate. The smaller X is, the higher the accuracy rate. The ordinate is the true positive rate. The larger Y is, the higher the accuracy rate. By evaluating the true positives and false positives of different thresholds, a curve can be constructed. This curve extends from the lower left to the upper right and bends towards the upper left. A classifier with no discriminative power between positive and negative classes will form a diagonal line, with the two ends being (0, 0) and (1, 1) respectively. (C) Intergenomic expression status in the GSE113079 dataset. (D) Intergenomic expression status in the GSE42148 dataset. (C,D) The abscissa represents genes, and the ordinate represents the expression level; the box color indicates sample grouping; the abscissa color indicates gene grouping (purple represents up - regulation, green represents down - regulation, and black represents non - significant), and the top shows significance, *, p < 0.05; **, p < 0.01; ***, p < 0.001. (E) Differential expression of biomarkers in patients with CHD and controls based on qRT-PCR. The sample size was 5.
Figure 5
Figure 5
Immune infiltration analysis and molecular regulation analysis. (A) Stacked diagram of immune cell infiltration. (B) Box plot of immune cell infiltration situation. The abscissa represents 22 kinds of immune cells (purple indicates significantly up - regulated immune cells, and green indicates significantly down - regulated immune cells), and the ordinate represents the scores of immune cells in the samples. ns, not significant; *, P < 0.05; **, P < 0.01; ***, P < 0.001. (C) Heat map of biomarkers and differential immune cell correlation. Red indicates a positive correlation, blue indicates a negative correlation; significance: *, P < 0.05; **, P < 0.01; ***, P < 0.001 (D) TF-biomarkers regulatory network;Key genes are shown in green and transcription factors in blue. (E) Construction of miRNA-biomarkers network. The mRNA is shown in green, and the predicted miRNA is shown in blue.

Similar articles

References

    1. Wirtz PH, von Känel R. Psychological stress, inflammation, and coronary heart disease. Curr Cardiol Rep. (2017) 19(11):111. 10.1007/s11886-017-0919-x - DOI - PubMed
    1. Di Angelantonio E, Thompson A, Wensley F, Danesh J. Coronary heart disease. IARC Sci Publ. (2011) (163):363–86. - PubMed
    1. Du J, Wu W, Zhu B, Tao W, Liu L, Cheng X, et al. Recent advances in regulating lipid metabolism to prevent coronary heart disease. Chem Phys Lipids. (2023) 255:105325. 10.1016/j.chemphyslip.2023.105325 - DOI - PubMed
    1. Shaya GE, Leucker TM, Jones SR, Martin SS, Toth PP. Coronary heart disease risk: low-density lipoprotein and beyond. Trends Cardiovasc Med. (2022) 32(4):181–94. 10.1016/j.tcm.2021.04.002 - DOI - PubMed
    1. Alpert JS. New coronary heart disease risk factors. Am J Med. (2023) 136(4):331–2. 10.1016/j.amjmed.2022.08.002 - DOI - PubMed

LinkOut - more resources