. 2025 Feb;16(1):e13682.
doi: 10.1002/jcsm.13682.

Intrinsic Muscle Stem Cell Dysfunction Contributes to Impaired Regeneration in the mdx Mouse

Affiliations

Intrinsic Muscle Stem Cell Dysfunction Contributes to Impaired Regeneration in the mdx Mouse

Marie E Esper et al. J Cachexia Sarcopenia Muscle. 2025 Feb.

Abstract

Background: Duchenne muscular dystrophy (DMD) is a devastating disease characterized by progressive muscle wasting that leads to diminished lifespan. In addition to the inherent weakness of dystrophin-deficient muscle, the dysfunction of resident muscle stem cells (MuSC) significantly contributes to disease progression.

Methods: Using the mdx mouse model of DMD, we performed an in-depth characterization of disease progression and MuSC function in dystrophin-deficient skeletal muscle using immunohistology, isometric force measurements, transcriptomic analysis and transplantation assays. We examined the architectural and functional changes in mdx skeletal muscle from 13 and 52 weeks of age and following acute cardiotoxin (CTX) injury. We also studied MuSC dynamics and function under homeostatic conditions, during regeneration post-acute injury, and following engraftment using a combination of histological and transcriptomic analyses.

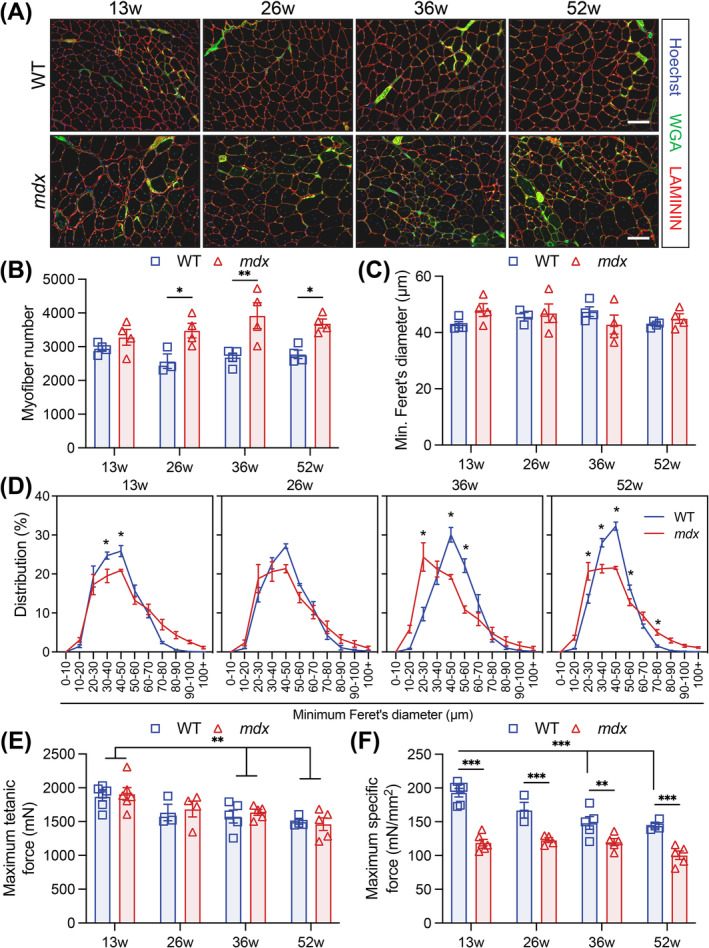
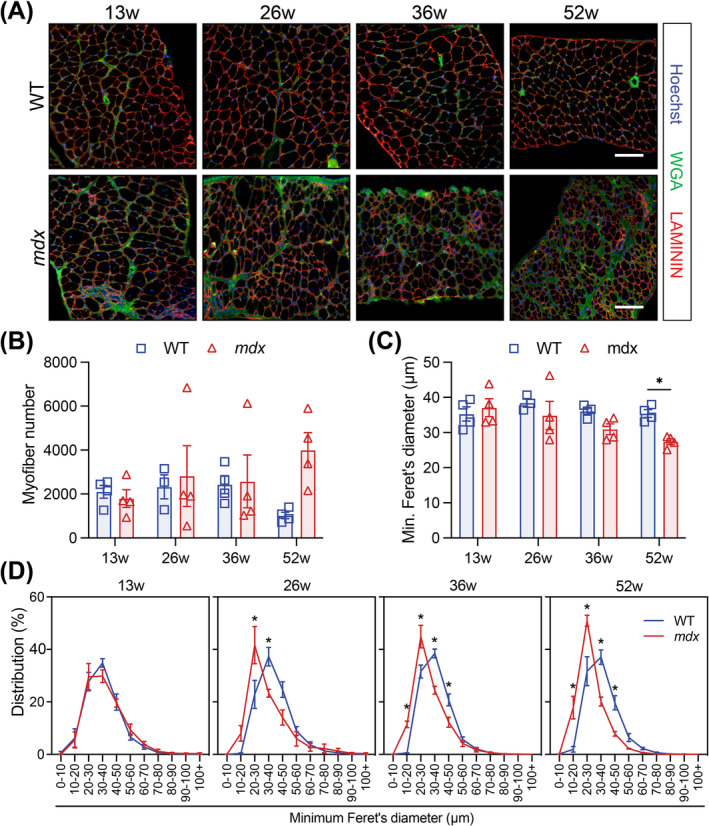
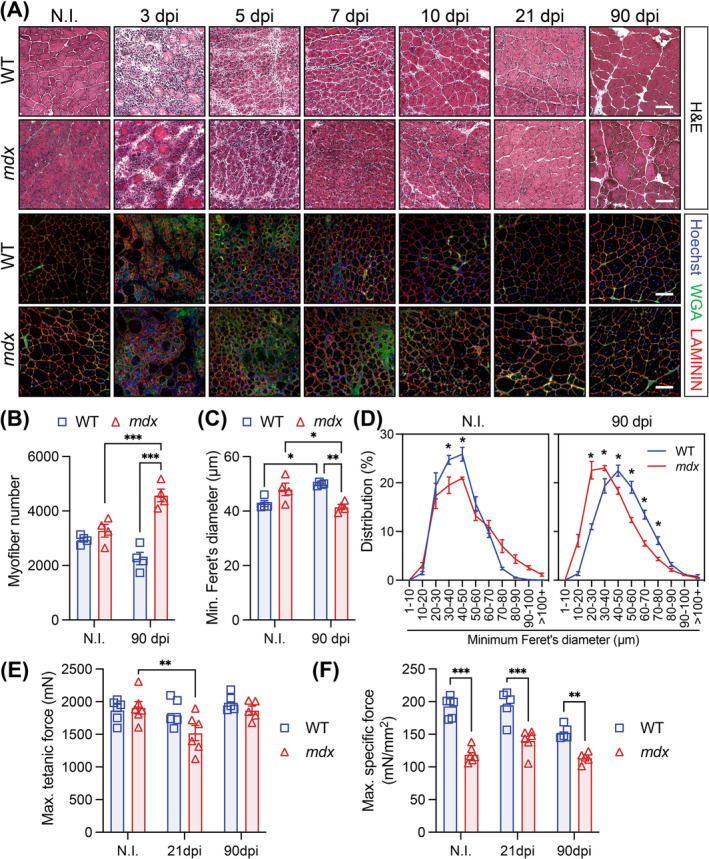
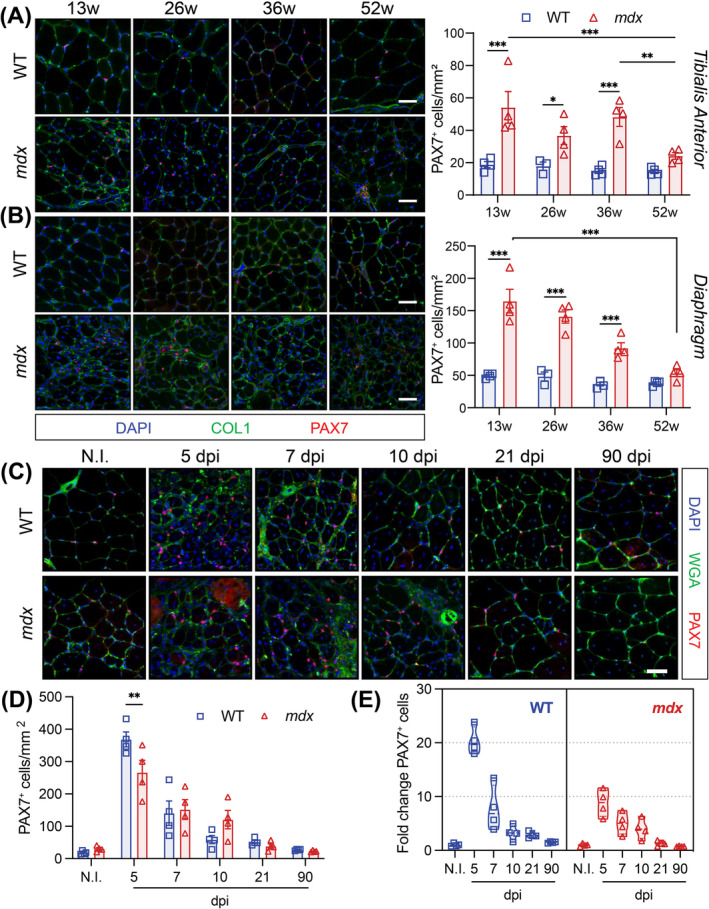
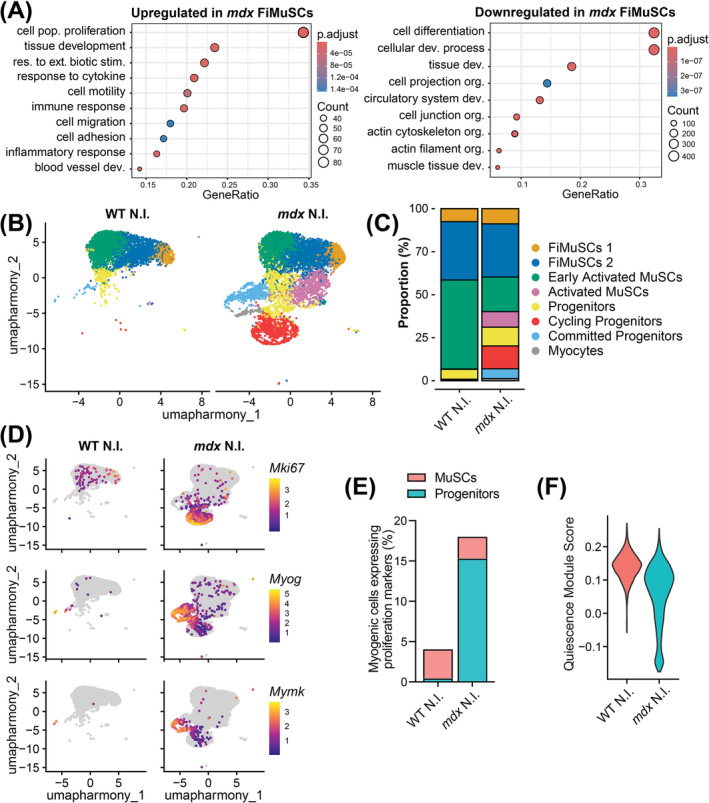
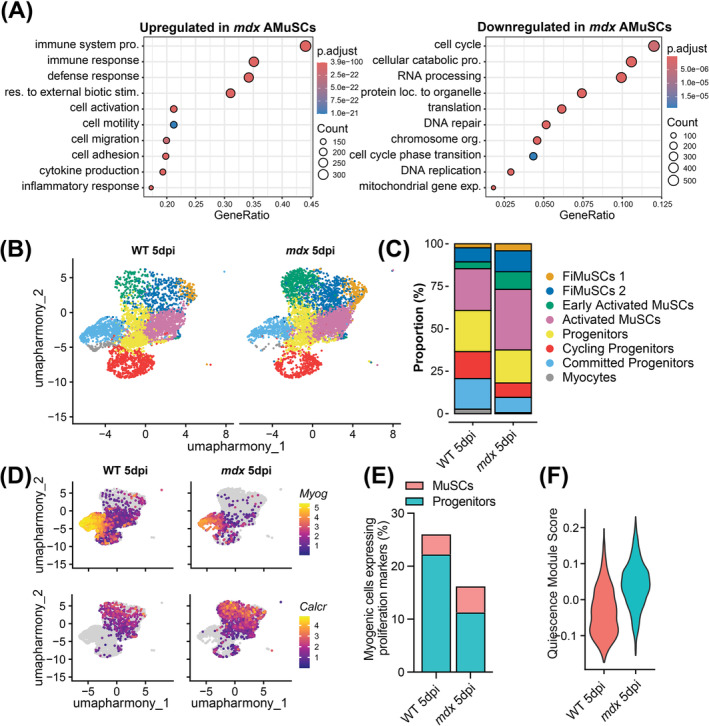
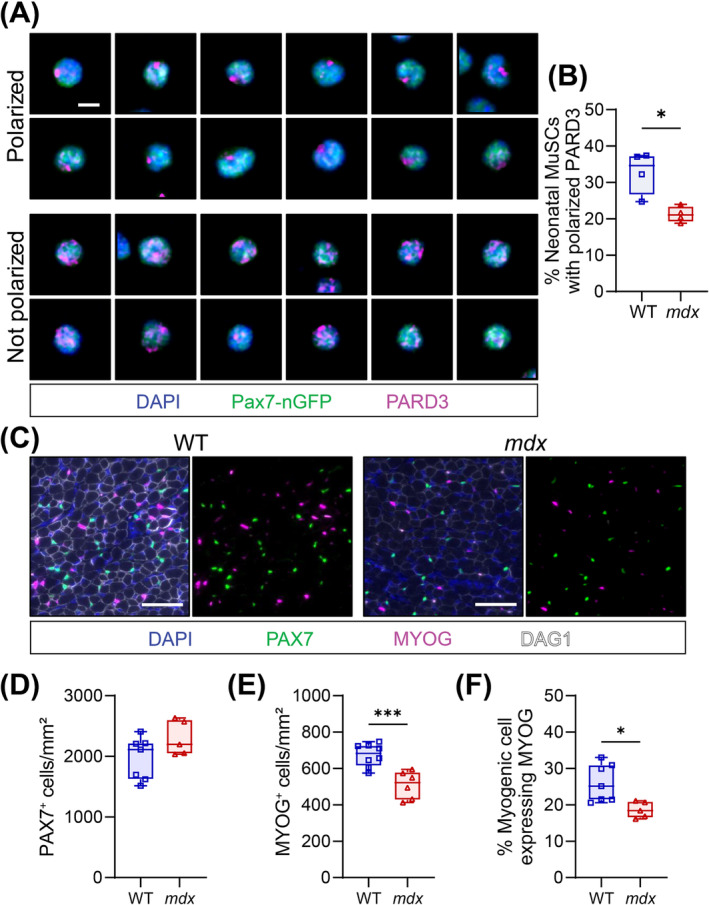
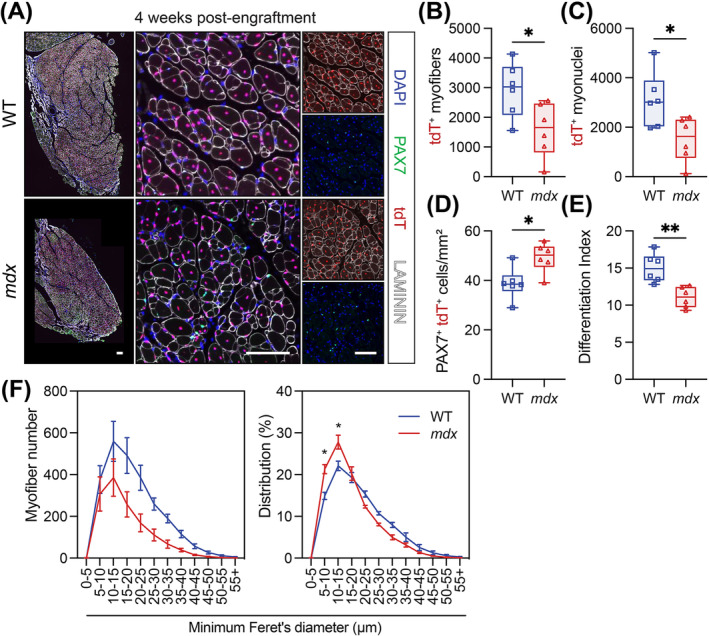
Results: Dystrophin-deficient skeletal muscle undergoes progressive changes with age and delayed regeneration in response to acute injury. Muscle hypertrophy, deposition of collagen and an increase in small myofibres occur with age in the tibialis anterior (TA) and diaphragm muscles in mdx mice. Dystrophic mdx mouse TA muscles become hypertrophic with age, whereas diaphragm atrophy is evident in 1-year-old mdx mice. Maximum tetanic force is comparable between genotypes in the TA, but maximum specific force is reduced by up to 38% between 13 and 52 weeks in the mdx mouse. Following acute injury, myofibre hyperplasia and hypotrophy and delayed recovery of maximum tetanic force occur in the mdx TA. We also find defective MuSC polarity and reduced numbers of myocytes in mdx muscle following acute injury. We observed a 50% and 30% decrease in PAX7+ and MYOG+ cells, respectively, at 5 days post CTX injury (5 dpi) in the mdx TA. A similar decrease in mdx progenitor cell proportion is observed by single cell RNA sequencing of myogenic cells at 5 dpi. The global expression of commitment-related genes is also reduced at 5 dpi. We find a 46% reduction in polarized PARD3 in mdx MuSCs. Finally, mdx MuSCs exhibit elevated PAX7+ cell engraftment with significantly fewer donor-derived myonuclei in regenerated myofibres.

Conclusions: Our study provides evidence that dystrophin deficiency in MuSCs and myofibres together contributes to progression of DMD. Ongoing muscle damage stimulates MuSC activation; however, aberrant intrinsic MuSC polarity and stem cell commitment deficits due to the loss of dystrophin impair muscle regeneration. Our study provides in vivo validation that dystrophin-deficient MuSCs undergo fewer asymmetric cell divisions, instead favouring symmetric expansion.

Keywords: mdx; Duchenne muscular dystrophy; dystrophin; muscle stem cell; regeneration; satellite cell.


Conflict of interest statement

M.A.R. is the Founding Scientist and Chief Development Officer of Satellos Bioscience Inc. The other authors declare no conflicts of interest.

Figures

FIGURE 1
FIGURE 1
Myofibre hypertrophy, hyperplasia and reduced force generation occur in response to chronic injury in the mdx mouse. (A) Representative immunofluorescence images of transversal tibialis anterior (TA) muscle sections from 13‐, 26‐, 36‐ and 52‐week‐old wild‐type (WT) and mdx mice. LAMININ (red) delineates the myofibres, WGA (green) stains the connective tissues, and Hoechst (blue) labels the nuclei. (B) Quantification of the number of myofibres per transversal TA muscle sections. (C) Mean TA myofibres size using the minimum Feret's diameter. (D) Normalized TA myofibre distribution using the minimum Feret's diameter. (E) Maximum tetanic force and (F) maximum specific force of TA muscles from 13‐, 26‐, 36‐ and 52‐week‐old WT and mdx mice. Scale bar, 100 μm. Data presented as mean values ± SEM. For Panels B–F, two‐way ANOVA with post hoc analysis corrected for multiple comparisons using Sidak's test (*p < 0.05, **p < 0.01, ***p < 0.001). For Panels B–F, n = 4 WT and 4 mdx 13‐week‐old mice, n = 3 WT and 4 mdx 26‐week‐old mice, n = 4 WT and 4 mdx 36‐week‐old mice, n = 4 WT and 4 mdx 52‐week‐old mice. For Panels E and F, n = 6 WT and 6 mdx 13‐week‐old mice, n = 3 WT and 4 mdx 26‐week‐old mice, n = 5 WT and 5 mdx 36‐week‐old mice, n = 4 WT and 5 mdx 52‐week‐old mice.
FIGURE 2
FIGURE 2
Morphology of mdx diaphragm becomes increasingly perturbed with age. (A) Representative immunofluorescence images of transversal diaphragm muscle sections from 13‐, 26‐, 36‐ and 52‐week‐old wild‐type (WT) and mdx mice. LAMININ (red) delineates the myofibres, WGA (green) stains the connective tissues, and Hoechst (blue) labels the nuclei. (B) Quantification of the number of myofibres per quantified diaphragm section. (C) Mean diaphragm myofibre size using the minimum Feret's diameter. (D) Normalized TA myofibre size distribution using minimum Feret's diameter. Scale bar, 100 μm. Data presented as mean values ± SEM. Two‐way ANOVA corrected for multiple comparisons using Sidak's test (*p < 0.05). n = 4 WT and 4 mdx 13‐week‐old mice, n = 3 WT and 4 mdx 26‐week‐old mice, n = 4 WT and 4 mdx 36‐week‐old mice, n = 4 WT and 4 mdx 52‐week‐old mice.
FIGURE 3
FIGURE 3
Delayed regeneration of mdx muscle following acute injury. (A) Representative haematoxylin and eosin (H&E) and immunofluorescence images of transversal sections of non‐injured (NI) and cardiotoxin (CTX)‐injured tibialis anterior (TA) muscle at 3, 5, 7, 10, 21 and 90 days post‐injury (dpi) from wild‐type (WT) and mdx mice. LAMININ (red) delineates the myofibres, WGA (green) stains the connective tissues and Hoechst (blue) labels the nuclei. (B) Cross‐sectional TA myofibre quantification at 90 dpi compared to NI. (C) Mean WT and mdx TA myofibre size using the minimum Feret's diameter in NI and CTX‐injured muscles at 90 dpi. (D) Normalized TA myofibre size distribution using the minimum Feret's diameter. (E) Maximum tetanic force of TA muscle from NI, 21 and 90 dpi WT and mdx mice. (F) Maximum specific force of TA muscles from NI, 21 and 90 dpi WT and mdx mice. Scale bar, 100 μm. Data presented as mean values ± SEM. Two‐way ANOVA corrected for multiple comparisons using Sidak's test (*p < 0.05; **p < 0.01; ***p < 0.001). NI = non‐injured. For Panels B–D, n = 4 WT and 4 mdx ‘non‐injured’ mice, n = 5 WT and 5 mdx ‘90 dpi’ mice. For Panels E and F, n = 6 WT and 6 mdx ‘non‐injured’ mice, n = 5 WT and 6 mdx ‘21 dpi’ mice, n = 5 WT and 5 mdx ‘90 dpi’ mice.
FIGURE 4
FIGURE 4
Perturbed mdx MuSC homeostasis and activation. (A,B) Immunofluorescence labelling and quantification of PAX7‐expressing muscle stem cells (MuSCs, red) on WT and mdx tibialis anterior (TA, top, Panel A) and diaphragm (bottom, Panel B) muscle cross‐sections. Collagen1 (COL1, green) labels the extracellular matrix and Hoechst (blue) labels the nuclei. For Panels A and B, n = 4 WT and 4 mdx 13‐week‐old mice, n = 3 WT and 4 mdx 26‐week‐old mice, n = 4 WT and 4 mdx 36‐week‐old mice, n = 4 WT and 4 mdx 52‐week‐old mice. (C) Representative immunofluorescence images of transversal sections from WT and mdx non‐injured (N.I.) and cardiotoxin (CTX)‐injured TA muscles at 5, 7, 10, 21 and 90 days post‐injury (dpi) from wild‐type (WT) and mdx mice. PAX7 (red) marks the muscle stem cells (MuSCs), WGA (green) stains the connective tissues, and Hoechst (blue) labels the nuclei. (D) PAX7‐expressing MuSC number per mm2 TA sections at the corresponding days following injury. n = 4 mice/genotype. (E) Fold change of PAX7+ MuSCs at each timepoint post CTX‐injury relative to no‐injury (N.I.) conditions. n = 4 mice/genotype. Two‐way ANOVA corrected for multiple comparisons using Sidak's test (*p < 0.05; **p < 0.01; ***p < 0.001). Scale bar, 100 μm. Data presented as mean values ± SEM.
FIGURE 5
FIGURE 5
Increased activation of mdx MuSCs in homeostatic muscle. (A) Gene ontology term enrichment for the upregulated (left) and downregulated (right) genes (p adjusted  < 0.05, Log2FC > 2) in mdx compared to wild‐type (WT) freshly isolated muscle stem cells (FiMuSCs). (B) Uniform manifold approximation and projection (UMAP) visualization of cells (4205 WT and 6980 mdx) captured from uninjured MuSC libraries and coloured by cluster identity. (C) Bar plot representing cluster proportions for uninjured WT and mdx MuSC libraries. (D) Feature plot illustrating the expression of proliferation marker Mki67 and commitment markers Myog and Mymk. (E) Proportion of myogenic cells expressing Cenpa, Mki67 or Cdk1, split by MuSC and progenitor cell identity. (F) Pseudo bulk quiescence module score (top 400 enriched from Garcia‐Prat et al. [14]) divided between uninjured WT and mdx libraries.
FIGURE 6
FIGURE 6
Reduced generation of mdx progenitor cells following acute injury. (A) Gene ontology term enrichment for the upregulated (left) and downregulated (right) genes in mdx compared to wild type (WT) activated muscle stem cells (AMuSCs). (B) Uniform manifold approximation and projection (UMAP) visualization of cells (4616 WT and 5396 mdx) captured from 5‐day cardiotoxin injured (5 dpi) MuSC libraries and coloured by cluster identity. (C) Bar plot representing cluster proportions for 5‐day injured WT and mdx MuSC libraries. (D) Feature plot illustrating the expression of commitment markers Myog and Mymk and quiescence marker Calcr. (E) Proportion of myogenic cells expressing Cenpa, Mki67 or Cdk1, divided by MuSC and progenitor cell identity. (F) Pseudo bulk quiescence module score (top 400 enriched from Garcia‐Prat et al. [14]) divided between 5 dpi WT and mdx libraries.
FIGURE 7
FIGURE 7
Reduced polarity and commitment of neonatal MuSCs. (A) Representative immunostaining of polarized and non‐polarized PARD3 (magenta) in MuSCs (Pax7‐nGFP, green) isolated from the limbs of neonatal day 7 mice. Scale bar, 5 μm. (B) Quantification of PARD3 polarization in neonatal MuSCs. An average of 536 cells quantified per replicate. (C) Example immunofluorescence image of neonatal day 7 WT and mdx hindlimb muscle transverse section. PAX7 (green) denotes the neonatal MuSCs, MYOG (magenta) stains the differentiated myogenic cells, DAG1 (white) labels the connective tissues, and DAPI (blue) labels the nuclei. Scale bar, 50 μm. (D,E) Enumeration of PAX7‐expressing (PAX7+) (D) and MYOG‐expressing (MYOG+) (E) cells on extensor digitorum longus (EDL) and tibialis anterior (TA) cross‐sections at neonatal day 7 and normalized to mm2. (F) MYOG+ cell proportion relative to total PAX7+ and MYOG+ myogenic cells at neonatal day 7. Boxplot whiskers represent the maximum and minimum data values. Statistical analysis performed using unpaired t‐tests where *p < 0.05; **p < 0.01; ***p < 0.001.
FIGURE 8
FIGURE 8
Intrinsic MuSC dysfunction impairs muscle regeneration. (A) Immunostaining of host tibialis anterior (TA) muscle cross‐sections 4 weeks following the engraftment of 10 000 MuSCs isolated from WT;ROSA‐nTnG or mdx; ROSA‐nTnG mice. Donor MuSCs (PAX7, green) and myonuclei express nuclear tdTomato (tdT, red). Laminin (white) stains myofibre basal lamina and DAPI (blue) stains the nuclei. Scale bars: left panels, 250 μm; middle and right panels, 100 μm. (B) Number of tdT+ myofibres per TA muscle transverse section. (C) Number of tdT+ myonuclei per TA cross‐section . (D) PAX7+/tdT+ MuSC number normalized to mm2 of transplanted muscle cross‐sections. (E) Differentiation index is the ratio of tdT+ myonuclei to tdT+ MuSCs. (F) Myofibre size distribution using minimum Feret's diameter and illustrated by number of myofibres (left) and proportional distribution (right). For B‐E, box plot whiskers indicate the maximum and minimum data values. For F, data presented as mean values ± SEM. Panels B–E: Statistical analysis performed using unpaired t‐tests. Panel F: Two‐way ANOVA corrected for multiple comparisons using Sidak's test. *p < 0.05; **p < 0.01; ***p < 0.001.

References

    1. Kodippili K. and Rudnicki M. A., “Satellite Cell Contribution to Disease Pathology in Duchenne Muscular Dystrophy,” Frontiers in Physiology 14 (2023): 1180980. - PMC - PubMed
    1. Dumont N. A., Wang Y. X., von Maltzahn J., et al., “Dystrophin Expression in Muscle Stem Cells Regulates Their Polarity and Asymmetric Division,” Nature Medicine 21 (2015): 1455–1463. - PMC - PubMed
    1. McGreevy J. W., Hakim C. H., McIntosh M. A., and Duan D., “Animal Models of Duchenne Muscular Dystrophy: From Basic Mechanisms to Gene Therapy,” Disease Models & Mechanisms 8 (2015): 195–213. - PMC - PubMed
    1. Alexander M. S., Rozkalne A., Colletta A., et al., “CD82 Is a Marker for Prospective Isolation of Human Muscle Satellite Cells and Is Linked to Muscular Dystrophies,” Cell Stem Cell 19 (2016): 800–807. - PMC - PubMed
    1. Chang N. C., Sincennes M.‐C., Chevalier F. P., et al., “The Dystrophin Glycoprotein Complex Regulates the Epigenetic Activation of Muscle Stem Cell Commitment,” Cell Stem Cell 22 (2018): 755–768.e6. - PMC - PubMed