. 2025 Feb;16(1):e13670.
doi: 10.1002/jcsm.13670.

Succinate Regulates Exercise-Induced Muscle Remodelling by Boosting Satellite Cell Differentiation Through Succinate Receptor 1

Affiliations

Succinate Regulates Exercise-Induced Muscle Remodelling by Boosting Satellite Cell Differentiation Through Succinate Receptor 1

Yifan Shi et al. J Cachexia Sarcopenia Muscle. 2025 Feb.

Abstract

Background: Skeletal muscle remodelling can cause clinically important changes in muscle phenotypes. Satellite cells (SCs) myogenic potential underlies the maintenance of muscle plasticity. Accumulating evidence shows the importance of succinate in muscle metabolism and function. However, whether succinate can affect SC function and subsequently coordinate muscle remodelling to exercise remains unexplored.

Methods: A mouse model of high-intensity interval training (HIIT) was used to investigate the effects of succinate on muscle remodelling and SC function by exercise capacity test and biochemical methods. Mice with succinate receptor 1 (SUCNR1)-specific knockout in SCs were generated as an in vivo model to explore the underlying mechanisms. RNA sequencing of isolated SCs was performed to identify molecular changes responding to succinate-SUCNR1 signalling. The effects of identified key molecules on the myogenic capacity of SCs were investigated using gain- and loss-of-function assays in vitro. To support the translational application, the clinical efficacy of succinate was explored in muscle-wasting mice.

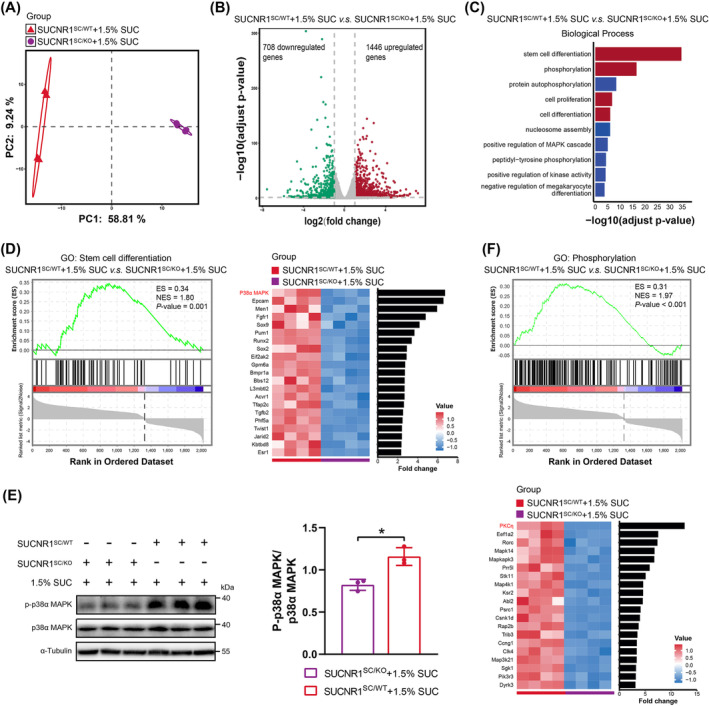
Results: After 21 days of HIIT, mice supplemented with 1.5% succinate exhibited striking gains in grip strength (+0.38 ± 0.04 vs. 0.26 ± 0.03 N, p < 0.001) and endurance (+276.70 ± 55.80 vs. 201.70 ± 45.31 s, p < 0.05), accompanied by enhanced muscle hypertrophy and neuromuscular junction regeneration (p < 0.001). The myogenic capacity of SCs was significantly increased in gastrocnemius muscle of mice supplemented with 1% and 1.5% succinate (+16.48% vs. control, p = 0.008; +47.25% vs. control, p < 0.001, respectively). SUCNR1-specific deletion in SCs abolished the modulatory influence of succinate on muscle adaptation in response to exercise, revealing that SCs respond to succinate-SUCNR1 signalling, thereby facilitating muscle remodelling. SUCNR1 signalling markedly upregulated genes associated with stem cell differentiation and phosphorylation pathways within SCs, of which p38α mitogen-activated protein kinase (MAPK; fold change = 6.7, p < 0.001) and protein kinase C eta (PKCη; fold change = 12.5, p < 0.001) expressions were the most enriched, respectively. Mechanistically, succinate enhanced the myogenic capacity of isolated SCs by activating the SUCNR1-PKCη-p38α MAPK pathway. Finally, succinate promoted SC differentiation (1.5-fold, p < 0.001), ameliorating dexamethasone-induced muscle atrophy in mice (p < 0.001).

Conclusions: Our findings reveal a novel function of succinate in enhancing SC myogenic capacity via SUCNR1, leading to enhanced muscle adaptation in response to exercise. These findings provide new insights for developing pharmacological strategies to overcome muscle atrophy-related diseases.

Keywords: PKCη; SUCNR1; muscle remodelling; satellite cells; succinate.


Conflict of interest statement

The authors declare no conflicts of interest.

Figures

FIGURE 1
FIGURE 1
Exercise capacity increased in mice supplemented with succinate (SUC). (A) Timeline characterizing time points of SUC supplementation, high‐intensity interval training (HIIT), exercise capacity test and sample harvest. (B) Comparison of plasma SUC level among three groups following 21 days of HIIT. (C) Absolute changes in body weight from mice supplemented with 0%, 1% or 1.5% SUC during HIIT. Lean mass, fat mass (D), gastrocnemius (GA) and tibialis anterior (TA) mass indices (E) of mice supplemented with 0%, 1% or 1.5% SUC after completing the HIIT protocol. (F) Absolute changes in grip strength (left) and exhaustion time (middle) from mice supplemented with 0%, 1% or 1.5% SUC during the HIIT protocol. The maximal tetanic force in extensor digitorum longus of mice with 0%, 1% or 1.5% SUC after completing the HIIT protocol (right). Data are presented as mean ± SD. One‐way analysis of variance (ANOVA) with Bonferroni multiple comparisons (BMC) was employed in (B), (D), (E) and (F) (right). Two‐way ANOVA with BMC was employed in (C) and (F) (left and middle) where #1% SUC vs. control, *1.5% SUC vs. control, and &1.5% SUC vs. 1% SUC. *p or # p < 0.05, **p or && p < 0.01, ***p < 0.001; n = 10 per group.
FIGURE 2
FIGURE 2
Succinate enhances hypertrophic adaptations in muscles. (A) Representative laminin staining (top) and frequency histogram (bottom) of cross‐sectional area (CSA) in gastrocnemius (GA) muscle harvested from mice supplemented with 0%, 1% or 1.5% succinate (SUC). Laminin, green; scale bars, 100 μm. (B) The representative images of immunofluorescent staining for laminin (green), myosin heavy chain (MyHC) I, MyHC IIa and MyHC IIb (red) in GA muscle of mice supplemented with 0%, 1% or 1.5% SUC. Scale bars, 100 μm. (C) The mean CSA analysis of MyHC I, MyHC IIa and MyHC IIb in GA muscles (left). Frequency histogram of MyHC I (middle) and MyHC IIb (right) CSA in GA muscles. (D) Real‐time quantitative PCR analyses of MyHC I, MyHC IIa, MyHC IIb, myoglobin, TnnT1 and TnnT3 mRNA levels in GA muscles from mice supplemented with 0%, 1% or 1.5% SUC. (E) Western blotting and semi‐quantitative analyses of MyHC I, MyHC IIa and MyHC IIb protein expression in GA muscle among three groups. (F) Pearson correlation analyses between changes in grip strength and exhaustion time (x‐axis) and the mean CSA of Type I and Type IIb fibres (y‐axis). Data are presented as mean ± SD. One‐way ANOVA with Bonferroni multiple comparisons (BMC) was employed in (A) and (C) (middle, right) where #1% SUC vs. control, *1.5% SUC vs. control, and &1.5% SUC vs. 1% SUC. One‐way ANOVA with BMC was employed in (C) (left), (D) and (E). *p, # p or & p < 0.05, **p, ## p or && p < 0.01, and ***p, ### p or &&& p < 0.001; n = 7 per group (A, B, C and F), n = 5 per group (D), n = 3 per group (E).
FIGURE 3
FIGURE 3
Succinate (SUC) promotes neuromuscular junction (NMJ) regeneration. (A) Maximal projections of confocal stacks of NMJs in gastrocnemius (GA) muscles from mice supplemented with 0%, 1% or 1.5% SUC. Muscle sections were stained with antibodies against neurofilament (2H3) and synaptic vesicle (SV2) (green) for presynaptic apparatus, and α‐bungarotoxin (α‐Bgtx) (red) for postsynaptic acetylcholine receptor (AChR). Scale bars, 20 μm. NMJ number, NMJ area (B), AChR intensity and myonuclear number per NMJ (C) in GA muscles of mice supplemented with 0%, 1% or 1.5% SUC. (D) Pearson correlation analyses for myonuclear number per NMJ and NMJ number (left), NMJ area (middle) and AChR intensity (right). (E) Real‐time quantitative PCR analysis of Chrna1, Chrnb, Chrnd, Chrne, Rapsyn and Lrp4 mRNA levels in GA muscles from mice supplemented with 0%, 1% or 1.5% SUC. Data are presented as mean ± SD. One‐way ANOVA with Bonferroni multiple comparisons (BMC) was employed in (B), (C) and (E). *p < 0.05, **p < 0.01 and ***p < 0.001; n = 7 per group (A, B, C and D), n = 5 per group (E).
FIGURE 4
FIGURE 4
The myogenic capacity of satellite cells (SCs) increases in mice supplemented with succinate (SUC). (A) Representative images of immunofluorescent staining for Pax7 (red), laminin (green) and DAPI (blue) in gastrocnemius (GA) muscles from mice supplemented with 0%, 1% or 1.5% SUC. White arrows, PAX7+ nuclei. Scale bars, 20 μm. (B) The average number of PAX7+ SCs per GA section of mice supplemented with 0%, 1% or 1.5% SUC. (C) Real‐time quantitative PCR analysis of Pax7 mRNA levels in GA muscles from mice supplemented with 0%, 1% or 1.5% SUC (top). Western blotting and semi‐quantitative analysis of PAX7 expression in GA muscles among three groups (bottom). (D) Representative images of immunofluorescent staining for Pax7 (red), MyoD (green) and DAPI (blue) in GA muscles from mice supplemented with 0%, 1% or 1.5% SUC. White arrows, Pax7 + /MyoD + nuclei; yellow arrows, Pax7 /MyoD + nuclei. Scale bars, 20 μm. (E) The average number of Pax7 + /MyoD + and Pax7 /MyoD + SCs per GA section of mice supplemented with 0%, 1% or 1.5% SUC. (F) Real‐time quantitative PCR analysis of MyoD mRNA levels in GA muscle from mice supplemented with 0, 1% or 1.5% SUC (left). Western blotting and semi‐quantitative analysis of MyoD protein expression in GA muscles among three groups (right). Data are presented as mean ± SD. *p < 0.05, **p < 0.01 and ***p < 0.001 by one‐way ANOVA with Bonferroni multiple comparisons (BMC); n = 7 per group (A, B, D and E), n = 5 per group (C [top], F [left]), n = 3 per group (C [bottom], F [right]).
FIGURE 5
FIGURE 5
Succinate receptor 1 (SUCNR1)‐specific deletion in satellite cells (SCs) abolishes succinate‐induced muscle remodelling. (A) Timeline characterizing time points of tamoxifen injection, succinate (SUC) supplementation, high‐intensity interval training (HIIT), exercise capacity test and sample harvest. (B) Western blotting and semi‐quantitative analysis of SUCNR1 protein expression in gastrocnemius (GA) muscles from SUCNR1SC/WT and SUCNR1SC/KO mice. (C) Representative images of immunofluorescent staining for PAX7 (red), laminin, MyoD (green) and DAPI (blue) in GA muscles from SUCNR1SC/WT and SUCNR1SC/KO mice supplemented with or without 1.5% SUC (top). White arrows, Pax7 + nuclei or Pax7 + /MyoD + nuclei; yellow arrows, Pax7 /MyoD + nuclei. Scale bars, 20 μm. The average number of Pax7 + , Pax7 + /MyoD + and Pax7 /MyoD + SCs per GA section among these four groups (bottom). (D) Representative images of immunofluorescent staining for laminin (green), myosin heavy chain (MyHC) I, and MyHC IIb (red) in GA muscles from SUCNR1SC/WT and SUCNR1SC/KO mice supplemented with or without 1.5% SUC (top). Scale bars, 100 μm. The semi‐quantitative analyses for mean cross‐sectional area (CSA) of MyHC I and MyHC IIb in GA muscles from these four groups (bottom). (E) Representative images of immunofluorescent staining for presynaptic neurofilament (2H3)/synaptic vesicle (SV2) (green) and postsynaptic acetylcholine receptors (AChRs) labelled with α‐bungarotoxin (α‐Bgtx) (red) in GA muscles from SUCNR1SC/WT and SUCNR1SC/KO mice supplemented with or without 1.5% SUC. Scale bars, 20 μm. (F) NMJ number, NMJ area, AChR intensity and myonuclear number per NMJ in GA muscles among these four groups. Data are presented as mean ± SD. Student's t‐test was employed in (B). One‐way ANOVA with Bonferroni multiple comparisons was employed in (C), (D) and (F). N.S., not significant, *p < 0.05, **p < 0.01 and ***p < 0.001; n = 10 per group (A), n = 3 per group (B), n = 7 per group (C, D, E and F).
FIGURE 6
FIGURE 6
Succinate receptor 1 (SUCNR1) signalling regulates satellite cell (SC) differentiation transcriptional programs. (A) Principal component analysis (PCA) for the transcriptome of isolated SCs from SUCNR1SC/WT and SUCNR1SC/KO mice supplemented with 1.5% succinate (SUC). (B) Volcano plot displaying the adjusted p‐value (y‐axis) and fold change (x‐axis) of the identified genes in the transcriptomic data. The colour of the circle represents differentially expressed genes (DEGs) with upregulation (red) or downregulation (green) in SCs isolated from SUCNR1SC/WT mice supplemented with 1.5% SUC. (C) Gene ontology (biological process) analysis for upregulated DEGs in SCs from SUCNR1SC/WT mice supplemented with 1.5% SUC. (D) Gene set enrichment analysis (GSEA) analysis for stem cell differentiation pathway between SUCNR1SC/WT and SUCNR1SC/KO mice supplemented with 1.5% SUC (left). Heatmap and fold change of stem cell differentiation–related gene expression between the two groups (right). (E) Western blotting and semi‐quantitative analysis of phosphorylated p38α MAPK and p38α MAPK protein expression in SCs from SUCNR1SC/WT and SUCNR1SC/KO mice supplemented with 1.5% SUC. (F) GSEA analysis for phosphorylation pathway between SUCNR1SC/WT and SUCNR1SC/KO mice supplemented with 1.5% SUC (top). Heatmap and fold change of phosphorylation‐related gene expression between the two groups (bottom). Data are presented as mean ± SD. Student's t‐test was employed in E. *p < 0.01; n = 4 per group (A, B, C, D and F), n = 3 per group (E). Each n = SCs isolated from a single mouse.
FIGURE 7
FIGURE 7
Succinate promotes satellite cell (SC) differentiation via activating succinate receptor 1 (SUCNR1)–protein kinase C eta (PKCη) pathway in vitro. (A) Representative images of immunofluorescence staining for myosin heavy chain (MyHC) (red) and DAPI (blue) in SCs transfected with PKCη small interfering RNA (si‐PKCη) and negative control (NC) after treatment with or without 0.2‐mM succinate (SUC) during differentiation. Scale bars, 50 μm. (B) Quantification of differentiation index and myotube size in si‐PKCη and NC transfected SCs after treatment with or without 0.2‐mM SUC during differentiation. (C) Real‐time quantitative PCR analyses of MyoD and MyHC mRNA levels in si‐PKCη and NC transfected SCs after treatment with or without 0.2‐mM SUC during differentiation. (D) Western blotting and semi‐quantitative analyses of MyoD and MyHC protein expression in si‐PKCη and NC transfected SCs after treatment with or without 0.2‐mM SUC during differentiation. (E) Green fluorescent protein (GFP) expression as determined by Western blotting in SCs transfected with empty plasmid (vector) and plasmid expressing constitutively active PKCη (PKCηCA). (F) Real‐time quantitative PCR analyses of MyoD and MyHC mRNA levels in SCs cotransfected with vector or PKCηCA and SUCNR1 small interfering RNA (si‐SUCNR1) or NC after treatment with 0.2‐mM SUC during differentiation (left). Western blotting and semi‐quantitative analyses of MyoD and MyHC protein expression in SCs among the four groups (right). Data are presented as mean ± SD. *p < 0.05, **p < 0.01 and ***p < 0.001 by one‐way ANOVA with Bonferroni multiple comparisons; n = 5 per group (A, B, C and F [left]), n = 3 per group (D, E and F [right]).
FIGURE 8
FIGURE 8
Succinate (SUC) ameliorates dexamethasone (Dexa)‐induced muscle atrophy in mice by enhancing the myogenic capacity of satellite cells (SCs). (A) Timeline characterizing time points of tamoxifen injection, Dexa injection, SUC supplementation, exercise capacity test and sample harvest. (B) Representative images of immunofluorescent staining for PAX7 (red), laminin, MyoD (green) and DAPI (blue) in tibialis anterior (TA) muscles from SUCNR1SC/WT and SUCNR1SC/KO mice injected by Dexa and supplemented with or without 1.5% SUC (top). White arrows, Pax7 + nuclei or Pax7 + /MyoD + nuclei; yellow arrows, Pax7 /MyoD + nuclei. Scale bars, 20 μm. The average number of Pax7 + , Pax7 + /MyoD + and Pax7 /MyoD + SCs per TA section among the four groups (bottom). (C) Representative image of TA muscle from SUCNR1SC/WT and SUCNR1SC/KO mice injected with Dexa and supplemented with or without 1.5% SUC. (D) TA muscle mass and mass index in mice from the four groups. (E) Representative laminin staining (green) of cross‐sectional area (CSA) in TA muscles from SUCNR1SC/WT and SUCNR1SC/KO mice injected by Dexa and supplemented with or without 1.5% SUC (left). Scale bars, 50 μm. Semi‐quantitative analyses of mean CSA in TA muscles from the four groups (right). (F) Percentage change from baseline of grip strength (left) and exhaustion time (right) in mice. Data are presented as mean ± SD. One‐way ANOVA with Bonferroni multiple comparisons (BMC) was employed in (B), (D) and (E). Two‐way ANOVA with BMC was employed in (F) where *SUCNR1SC/WT + Dexa + 1.5% SUC vs. SUCNR1SC/WT + Dexa and &SUCNR1SC/WT + Dexa + 1.5% SUC vs. SUCNR1SC/KO + Dexa + 1.5% SUC. N.S., not significant, *p or & p < 0.05, **p < 0.01, ***p < 0.001; n = 10 per group (A, C, D and F), n = 7 per group (B, E).

Similar articles

Cited by

References

    1. Powers S. K., “Exercise: Teaching Myocytes New Tricks,” Journal of Applied Physiology (1985) 123 (2017): 460–472. - PMC - PubMed
    1. Smith J., Murach K. A., Dyar K. A., and Zierath J. R., “Exercise Metabolism and Adaptation in Skeletal Muscle,” Nature Reviews. Molecular Cell Biology 24 (2023): 607–632. - PMC - PubMed
    1. Lessard S. J., Macdonald T. L., Pathak P., et al., “JNK Regulates Muscle Remodeling via Myostatin/SMAD Inhibition,” Nature Communications 9 (2018): 3030. - PMC - PubMed
    1. Ali S. and Garcia J. M., “Sarcopenia, Cachexia and Aging: Diagnosis, Mechanisms and Therapeutic Options—A Mini‐Review,” Gerontology 60 (2014): 294–305. - PMC - PubMed
    1. Folland J. P. and Williams A. G., “The Adaptations to Strength Training: Morphological and Neurological Contributions to Increased Strength,” Sports Medicine 37 (2007): 145–168. - PubMed

LinkOut - more resources