

Genome evolution following an ecological shift in nectar-dwelling Acinetobacter
- PMID: 39723821
- PMCID: PMC11774029
- DOI: 10.1128/msphere.01010-24
Genome evolution following an ecological shift in nectar-dwelling Acinetobacter
Abstract
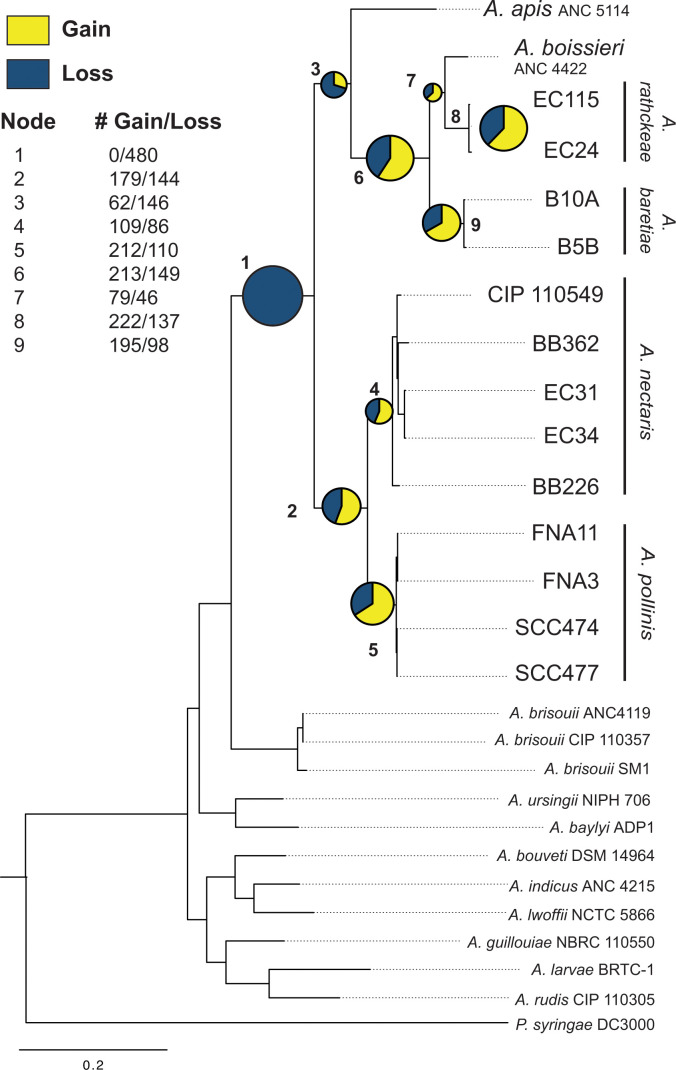
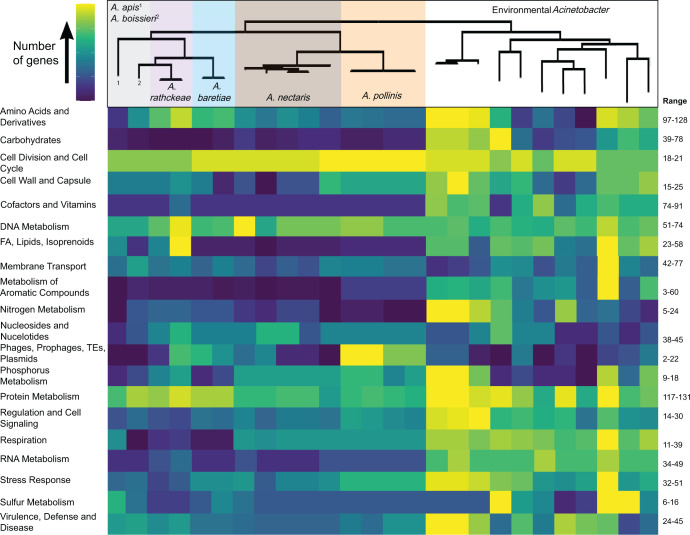
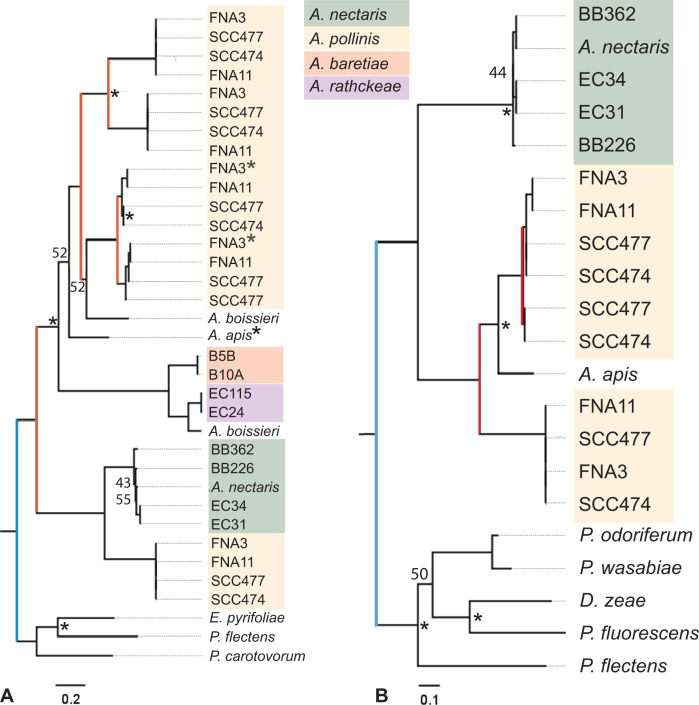
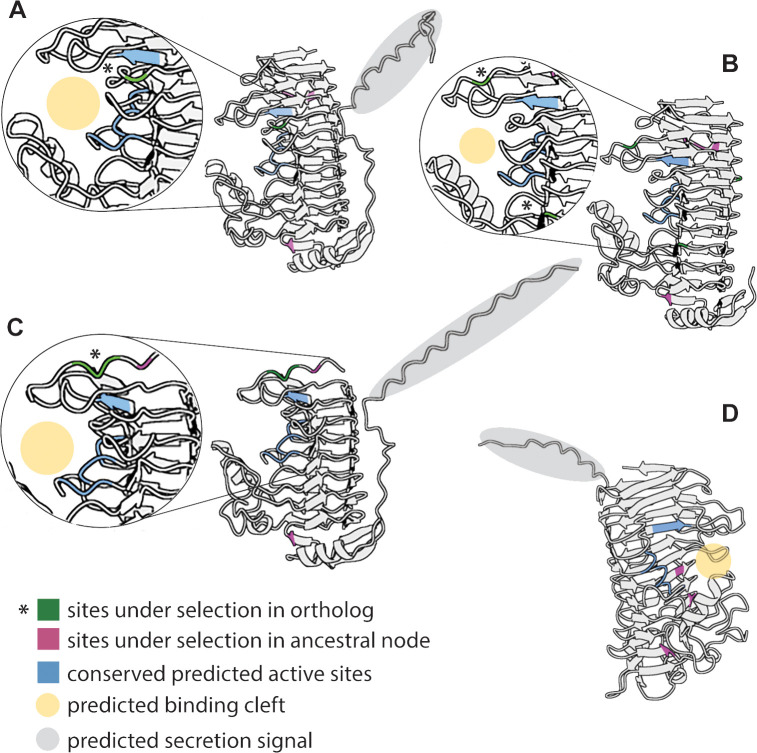
The bacterial genus Acinetobacter includes species found in environmental habitats like soil and water, as well as taxa adapted to be host-associated or pathogenic. High genetic diversity may allow for this habitat flexibility, but the specific genes underlying switches between habitats are poorly understood. One lineage of Acinetobacter has undergone a substantial habitat change by evolving from a presumed soil-dwelling ancestral state to thrive in floral nectar. Here, we compared the genomes of floral-dwelling and pollinator-associated Acinetobacter, including newly described species, with genomes from relatives found in other environments to determine the genomic changes associated with this ecological shift. Following one evolutionary origin of floral nectar adaptation, nectar-dwelling Acinetobacter taxa have undergone reduction in genome size compared with relatives and have experienced dynamic gene gains and losses as they diversified. Gene content changes suggest a shift to metabolism of monosaccharides rather than diverse carbohydrates, and scavenging of nitrogen sources, which we predict to be beneficial in nectar environments. Gene gains appear to result from duplication events, evolutionary divergence, and horizontal gene transfer. Most notably, nectar-dwelling Acinetobacter acquired the ability to degrade pectin from plant pathogens, and the genes underlying this ability have duplicated and are under selection within the clade. We hypothesize that this ability was a key trait for adaptation to floral nectar, as it could improve access to nutrients in the nutritionally unbalanced habitat of nectar. These results identify the genomic changes and traits coinciding with a dramatic habitat switch from soil to floral nectar.
Importance: Many bacteria, including the genus Acinetobacter, commonly evolve to exploit new habitats. However, the genetic changes that underlie habitat switches are often unknown. Floral nectar is home to specialized microbes that can grow in this nutritionally unbalanced habitat. Several specialized Acinetobacter species evolved from soil-dwelling relatives to become common and abundant in floral nectar. Here, we investigate the genomic adaptations required to successfully colonize a novel habitat like floral nectar. We performed comparative genomics analyses between nectar-dwelling Acinetobacter and Acinetobacter species from other environments, like soil and water. We find that although gene loss coincided with the switch to living in nectar, gains of specific genes from other bacteria may have been particularly important for this ecological change. Acinetobacter living in nectar gained genes for degrading pectin, a plant polysaccharide, which may improve access to nutrients in their environment. These findings shed light on how evolutionary novelty evolves in bacteria.
Keywords: Acinetobacter; evolution; genomics; microbial ecology; plant–microbe interactions.
Conflict of interest statement
The authors declare no conflict of interest.
Figures
Similar articles
-
The Role of Phenotypic Plasticity and Within-Environment Trait Variability in the Assembly of the Nectar Microbiome and Plant-Microbe-Animal Interactions.Ecol Evol. 2025 Mar 2;15(3):e71059. doi: 10.1002/ece3.71059. eCollection 2025 Mar. Ecol Evol. 2025. PMID: 40027422 Free PMC article. Review.
-
Tiny but mighty? Overview of a decade of research on nectar bacteria.New Phytol. 2025 Mar;245(5):1897-1910. doi: 10.1111/nph.20369. Epub 2024 Dec 23. New Phytol. 2025. PMID: 39716780 Free PMC article. Review.
-
Nitrogen Assimilation Varies Among Clades of Nectar- and Insect-Associated Acinetobacters.Microb Ecol. 2021 May;81(4):990-1003. doi: 10.1007/s00248-020-01671-x. Epub 2021 Jan 6. Microb Ecol. 2021. PMID: 33404822
-
Sugar Concentration, Nitrogen Availability, and Phylogenetic Factors Determine the Ability of Acinetobacter spp. and Rosenbergiella spp. to Grow in Floral Nectar.Microb Ecol. 2023 Jul;86(1):377-391. doi: 10.1007/s00248-022-02088-4. Epub 2022 Aug 5. Microb Ecol. 2023. PMID: 35930073 Free PMC article.
-
Nectar bacteria stimulate pollen germination and bursting to enhance microbial fitness.Curr Biol. 2021 Oct 11;31(19):4373-4380.e6. doi: 10.1016/j.cub.2021.07.016. Epub 2021 Jul 28. Curr Biol. 2021. PMID: 34324834
Cited by
-
The Role of Phenotypic Plasticity and Within-Environment Trait Variability in the Assembly of the Nectar Microbiome and Plant-Microbe-Animal Interactions.Ecol Evol. 2025 Mar 2;15(3):e71059. doi: 10.1002/ece3.71059. eCollection 2025 Mar. Ecol Evol. 2025. PMID: 40027422 Free PMC article. Review.
-
Tiny but mighty? Overview of a decade of research on nectar bacteria.New Phytol. 2025 Mar;245(5):1897-1910. doi: 10.1111/nph.20369. Epub 2024 Dec 23. New Phytol. 2025. PMID: 39716780 Free PMC article. Review.
-
Microbial Evolution in Allodapine Bees: Perspectives From Trophallactic, Socially Plastic Pollinators.Evol Appl. 2025 Jul 27;18(7):e70137. doi: 10.1111/eva.70137. eCollection 2025 Jul. Evol Appl. 2025. PMID: 40727087 Free PMC article. Review.
References
-
- Touchon M, Cury J, Yoon E-J, Krizova L, Cerqueira GC, Murphy C, Feldgarden M, Wortman J, Clermont D, Lambert T, Grillot-Courvalin C, Nemec A, Courvalin P, Rocha EPC. 2014. The genomic diversification of the whole Acinetobacter genus: origins, mechanisms, and consequences. Genome Biol Evol 6:2866–2882. doi:10.1093/gbe/evu225 - DOI - PMC - PubMed
-
- Koskella B, Vos M. 2015. Adaptation in natural microbial populations. Annu Rev Ecol Evol Syst 46:503–522. doi:10.1146/annurev-ecolsys-112414-054458 - DOI
MeSH terms
Substances
LinkOut - more resources
Full Text Sources
