

Dose-dependent serological profiling of AdCLD-CoV19-1 vaccine in adults
- PMID: 39723823
- PMCID: PMC11774024
- DOI: 10.1128/msphere.00998-24
Dose-dependent serological profiling of AdCLD-CoV19-1 vaccine in adults
Abstract
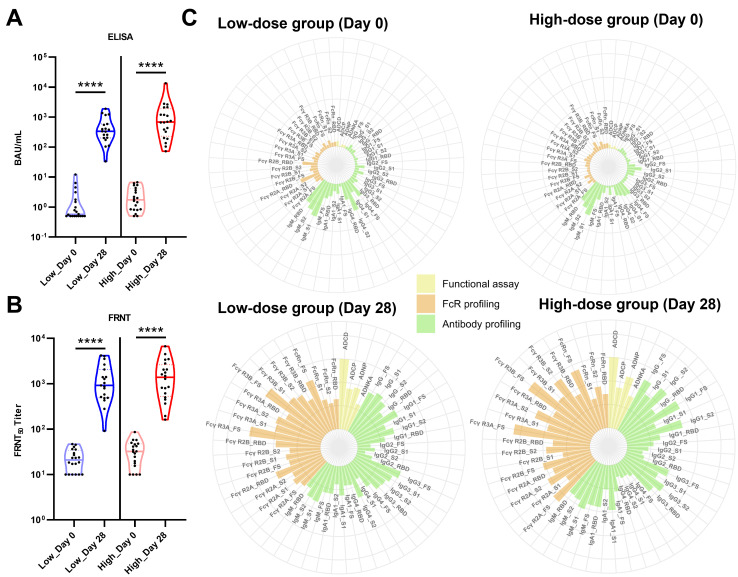
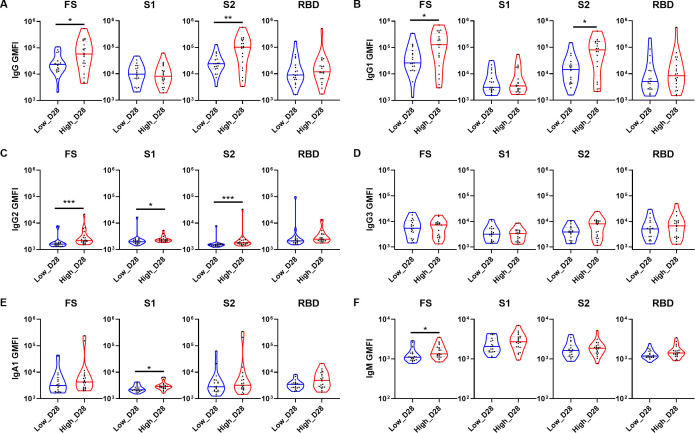
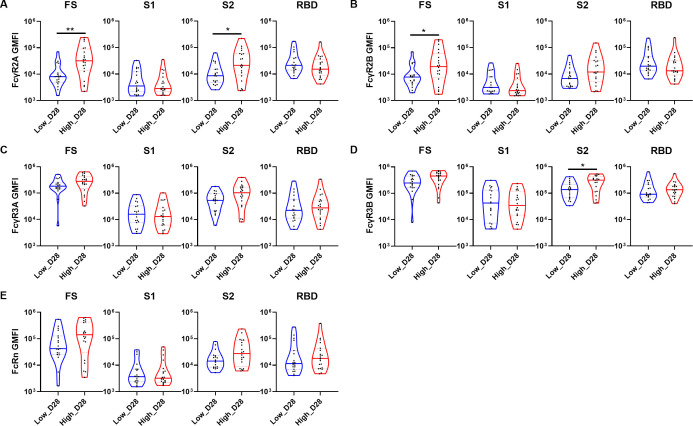
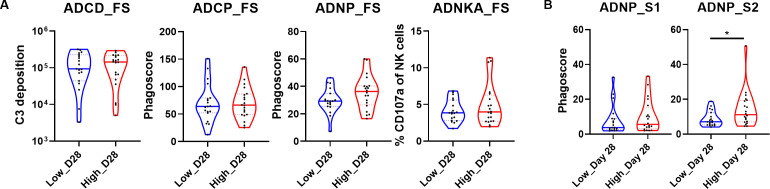
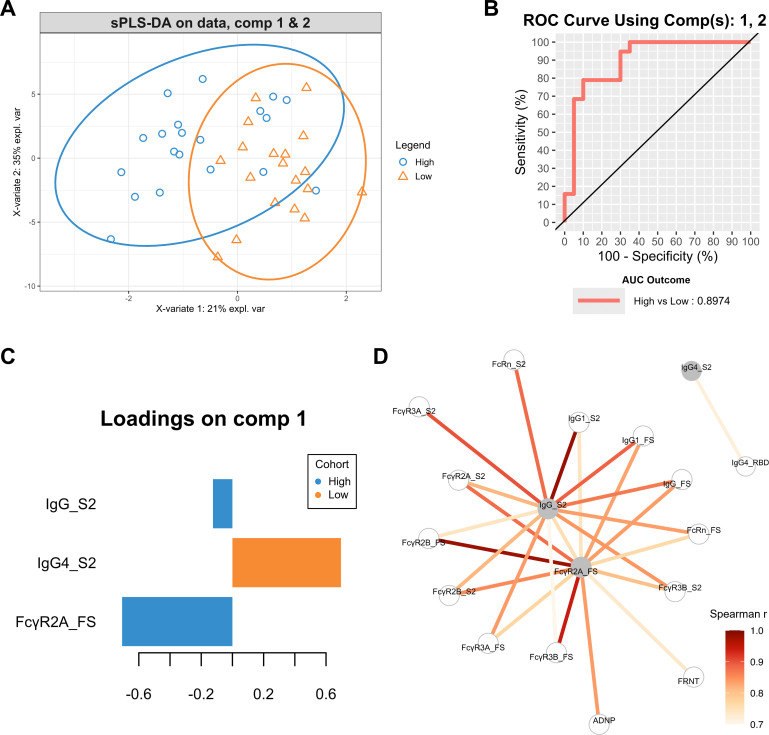
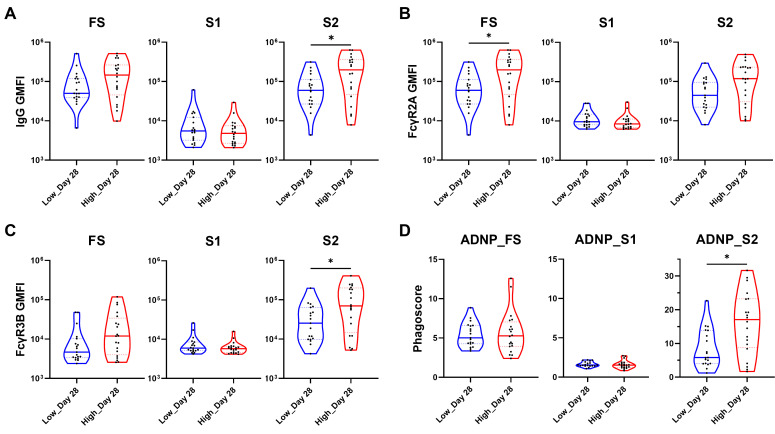
AdCLD-CoV19-1, a chimeric adenovirus-based severe acute respiratory syndrome coronavirus 2 (SARS-CoV-2) vaccine, was previously reported to elicit robust antibody responses in mice and non-human primates after a single dose. In this study, we conducted a systems serology analysis to investigate changes in humoral immune responses induced by varying doses of the AdCLD-CoV19-1 vaccine in a phase I clinical trial. Serum samples from participants receiving either a low or a high dose of the vaccine were analyzed for antibody features against prototype SARS-CoV-2 spike (S) domains (full-length S, S1, S2, and receptor binding domain), as well as Fc receptor binding and effector functions. While both low- and high-dose vaccines induced robust humoral immune responses following vaccination, the quality of antibody features differed between the dose groups. Notably, while no significant difference was observed between the groups in the induction of most S1-specific antibody features, the high-dose group exhibited higher levels of antibodies and a stronger Fc receptor binding response specific to the S2 antigen. Moreover, univariate and multivariate analyses revealed that the high-dose vaccine induced higher levels of S2-specific antibodies binding to FcγR2A and FcγR3B, closely associated with antibody-dependent neutrophil phagocytosis (ADNP). Further analysis using the Omicron BA.2 variant demonstrated that the high-dose group maintained significantly higher levels of IgG and FcγR3B binding to the S2 antigen and exhibited a significantly higher ADNP response for the S2 antigen compared with the low-dose group. These findings underscore the importance of considering diverse humoral immune responses when evaluating vaccine efficacy and provide insights for optimizing adenovirus vector-based SARS-CoV-2 vaccine doses.IMPORTANCEOptimization of vaccine dose is crucial for eliciting effective immune responses. In addition to neutralizing antibodies, non-neutralizing antibodies that mediate Fc-dependent effector functions play a key role in protection against various infectious diseases, including coronavirus disease 2019. Using a systems serology approach, we demonstrated significant dose-dependent differences in the humoral immune responses induced by the AdCLD-CoV19-1 chimeric adenovirus-based severe acute respiratory syndrome coronavirus 2 (SARS-CoV-2) vaccine, particularly against the SARS-CoV-2 spike 2 domain. These findings highlight the importance of assessing not only neutralizing antibody titers but also the quality and functionality of antibody responses when evaluating vaccine efficacy.
Keywords: SARS-CoV-2; adenovirus vector-based vaccine; effector function; spike protein; systems serology.
Conflict of interest statement
The authors declare no conflict of interest.
Figures
Similar articles
-
Diversified humoral immunity and impacts of booster vaccines: SARS-CoV-2 antibody profile and Omicron BA.2 neutralization before and after first or second boosters.Microbiol Spectr. 2024 Oct 3;12(10):e0060524. doi: 10.1128/spectrum.00605-24. Epub 2024 Aug 20. Microbiol Spectr. 2024. PMID: 39162540 Free PMC article.
-
MVA-based vaccine candidates expressing SARS-CoV-2 prefusion-stabilized spike proteins of the Wuhan, Beta or Omicron BA.1 variants protect transgenic K18-hACE2 mice against Omicron infection and elicit robust and broad specific humoral and cellular immune responses.Front Immunol. 2024 Aug 29;15:1420304. doi: 10.3389/fimmu.2024.1420304. eCollection 2024. Front Immunol. 2024. PMID: 39267752 Free PMC article.
-
Hybrid Immunity Shifts the Fc-Effector Quality of SARS-CoV-2 mRNA Vaccine-Induced Immunity.mBio. 2022 Oct 26;13(5):e0164722. doi: 10.1128/mbio.01647-22. Epub 2022 Aug 24. mBio. 2022. PMID: 36000735 Free PMC article.
-
Fc-effector functional antibody assays for SARS-CoV-2 variants of concern.Front Immunol. 2025 May 20;16:1571835. doi: 10.3389/fimmu.2025.1571835. eCollection 2025. Front Immunol. 2025. PMID: 40463385 Free PMC article.
-
Characterization of SARS-CoV-2-specific humoral immunity and its potential applications and therapeutic prospects.Cell Mol Immunol. 2022 Feb;19(2):150-157. doi: 10.1038/s41423-021-00774-w. Epub 2021 Oct 13. Cell Mol Immunol. 2022. PMID: 34645940 Free PMC article. Review.
Cited by
-
Developing the next-generation of adenoviral vector vaccines.Hum Vaccin Immunother. 2025 Dec;21(1):2514356. doi: 10.1080/21645515.2025.2514356. Epub 2025 Jul 1. Hum Vaccin Immunother. 2025. PMID: 40590260 Free PMC article. Review.
References
-
- World Health Organization . 2023. Status of COVID-19 Vaccines within WHO EUL/PQ evaluation process. Available from: https://extranet.who.int/prequal/sites/default/files/document_files/Stat.... Retrieved 7 Aug 2024.
-
- Feng S, Phillips DJ, White T, Sayal H, Aley PK, Bibi S, Dold C, Fuskova M, Gilbert SC, Hirsch I, Humphries HE, Jepson B, Kelly EJ, Plested E, Shoemaker K, Thomas KM, Vekemans J, Villafana TL, Lambe T, Pollard AJ, Voysey M, Oxford CVTG. 2021. Correlates of protection against symptomatic and asymptomatic SARS-CoV-2 infection. Nat Med 27:2032–2040. doi:10.1038/s41591-021-01540-1 - DOI - PMC - PubMed
-
- Bergwerk M, Gonen T, Lustig Y, Amit S, Lipsitch M, Cohen C, Mandelboim M, Levin EG, Rubin C, Indenbaum V, Tal I, Zavitan M, Zuckerman N, Bar-Chaim A, Kreiss Y, Regev-Yochay G. 2021. Covid-19 breakthrough infections in vaccinated health care workers. N Engl J Med 385:1474–1484. doi:10.1056/NEJMoa2109072 - DOI - PMC - PubMed
Publication types
MeSH terms
Substances
Grants and funding
LinkOut - more resources
Full Text Sources
Medical
Miscellaneous
