. 2025 Jan 28;44(1):115111.
doi: 10.1016/j.celrep.2024.115111. Epub 2024 Dec 25.

A minority of Th1 and Tfh effector cells express survival genes shared by memory cell progeny that require IL-7 or TCR signaling to persist

Affiliations

A minority of Th1 and Tfh effector cells express survival genes shared by memory cell progeny that require IL-7 or TCR signaling to persist

Kevin C Osum et al. Cell Rep. .

Abstract

It is not clear how CD4+ memory T cells are formed from a much larger pool of earlier effector cells. We found that transient systemic bacterial infection rapidly generates several antigen-specific T helper (Th)1 and T follicular helper (Tfh) cell populations with different tissue residence behaviors. Although most cells of all varieties had transcriptomes indicative of cell stress and death at the peak of the response, some had already acquired a memory cell signature characterized by expression of genes involved in cell survival. Each Th1 and Tfh cell type was maintained long term by interleukin (IL)-7, except germinal center Tfh cells, which depended on a T cell antigen receptor (TCR) signal. The results indicate that acute infection induces rapid differentiation of Th1 and Tfh cells, a minority of which quickly adopt the gene expression profile of memory cells and survive by signals from the IL-7 receptor or TCR.

Keywords: CD4+ T cell; CP: Immunology; Tfh; Th1; immune memory.


Conflict of interest statement

Declaration of interests The authors have no conflicts of interest.

Figures
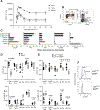
Figure 1.
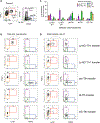
Figure 1.. Naive 2W:I-Ab-specific T cells undergo expansion after intravenous infection with aLm-2W bacteria
(A) Mean numbers (±SD) of 2W:I-Ab tetramer-binding cells in the indicated organs of B6 mice (n ≥ 3 at each time point from two independent experiments) at the indicated times after aLm-2W infection. (B) Flow cytometry plots of staining of the indicated proteins on 2W:I-Ab tetramer+ cells from the SLOs of mice, 7 days after aLm-2W infection. (C) Mean fluorescence intensities (±SD) of antibody staining of the indicated proteins on the indicated subsets identified as in (B). CD44lo naive CD4+ T cells are shown for comparison. (D) Numbers (top) and percentages (bottom) of 2W:I-Ab tetramer-binding cells of the indicated subsets from the SLOs of individual wild-type (filled circles) or Tbx21−/− (open circles) mice (n ≥ 6 from two independent experiments) on day 7 after aLm-2W infection. Mean values are indicated with a horizontal bar. p values are from multiple unpaired t tests. (E) Numbers (top) and percentages (bottom) of 2W:I-Ab tetramer-binding cells of the indicated subsets from the SLOs of individual LckWT/WT Bcl6fl/fl (filled circles) or LckCre/WT Bcl6fl/fl (open circles) mice (n ≥ 5 from two independent experiments) on day 7 after aLm-2W infection. Mean values are indicated with a horizontal bar. p values are from multiple unpaired t tests. (F) Histograms of CXCR5 staining on 2W:I-Ab tetramer-binding pre-Tfh cells (blue) or naive 2W:I-Ab tetramer CD4+ T cells (black) from mice of the indicated genotypes on day 7 after aLm-2W infection.
Figure 2.
Figure 2.. Phenotype and location of 2W:I-Ab-specific memory T cells after intravenous infection with aLm-2W bacteria
(A) Flow cytometry plots of staining of the indicated molecules on 2W:I-Ab tetramer+ cells from the SLOs of mice 21 days after aLm-2W infection. (B) Mean fluorescence intensities (±SD) of antibody staining of the indicated proteins on the indicated subsets identified as in (A). CD44lo naive CD4+ T cells are shown for comparison. (C) Percentages of 2W:I-Ab tetramer-binding cells of the indicated subsets from the SLOs, blood, or livers of mice (n = 4 from two experiments) on day 7 (circles) or day 21 (squares) after aLm-2W infection. Mean values are indicated with a horizontal bar. The p value is from a multiple unpaired t test. (D) Mean percentages (±SD, n = 9–10 from three independent experiments) of the indicated 2W:I-Ab tetramer-binding memory cell subsets that did not recirculate between the SLOs of the parabionts in a 21-day period (% resident). p values were derived from a one-way ANOVA with a Tukey’s multiple-comparisons test. One outlying value was removed from the Ly-6Chi Th1 cell group based on the robust regression and outlier removal method with a Q value of 1%.
Figure 3.
Figure 3.. CD4+ effector T cell subsets generate phenotypically similar memory T cell subsets
(A) Flow cytometry plots of the indicated molecules on 2W:I-Ab tetramer+ cells from the SLOs of CD45.2+ mice 7 days after aLm-2W infection from a sample later subjected to fluorescence-activated cell sorting (FACS). (B) Flow cytometry plots of the indicated molecules on 2W:I-Ab tetramer+ effector cells of the indicated subsets from SLOs of day 7 aLm-2W-infected CD45.2+ mice after FACS based on the gates shown in (A). (C) Mean percentages (±SEM, n ≥ 3 from four independent experiments) of 2W:I-Ab tetramer-binding memory cell subsets of CD45.2+ donor origin in CD45.1+ mice that received the indicated FACS-sorted CD45.2+ effector cell populations 21 days earlier. (D) Flow cytometry plots of the indicated molecules on 2W:I-Ab tetramer+ memory cells derived from the indicated FACS-sorted effector cell subsets 21 days after transfer into day 7 aLm-2W-infected recipients.
Figure 4.
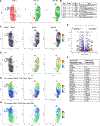
Figure 4.. Identification of CD4+ effector and memory T cells by single-cell RNA sequencing
(A) Low-resolution dimension-reduction plots of single-cell RNA sequencing data from 2W:I-Ab and LLOp:I-Ab tetramer+ cells FACS sorted at the indicated times after aLm-2W infection. (B) Number and percentages of cells in the three clusters identified in (A). (C and D) Feature plots of Mki67 (C) or Il7r (D) expression. (E) Volcano plot of genes over-expressed in non-proliferating effector cells (left half) or memory cells (right half) with a subset of genes labeled. (F) Lists of the top 20 genes over-expressed in the non-proliferating effector cell cluster compared to the memory cell cluster or vice versa and with p values <10−300. The full list is in Table S1. The proliferating effector cell cluster was excluded to prevent highly expressed cell-cycle genes from skewing the analysis. (G and H) Feature plots of expression of a module of Th1 (G) or Tfh (H) genes.
Figure 5.
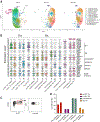
Figure 5.. Identification of Th1 and Tfh effector and memory cell subsets by single-cell RNA sequencing
(A) High-resolution dimension-reduction plot of single-cell RNA sequencing data from 2W:I-Ab and LLOp:I-Ab tetramer+ cells FACS sorted from the indicated times after aLm-2W infection with identity calls on each cluster listed in the legend. (B) Violin plots of expression of the indicated genes by the indicated Th cell subsets. (C) Flow cytometry plots of the indicated molecules on tetramer+ cells from aLm-2W-infected mice demonstrating the presence of CX3CR1+ cells in the Ly-6Chi Th1 cell subset. (D) 2W:I-Ab plus LLOp:I-Ab tetramer-binding T cells sorted from the spleens of day-21 and -60 aLm-2W-infected mice were analyzed by single-cell RNA sequencing or by flow cytometry and memory cells subsets were identified as described in (A) and Figure 2A. The values in the figure indicate the percentage of each subset in the tetramer-binding population identified by each method.
Figure 6.
Figure 6.. Memory T cell subsets depend on IL-7 and/or IL-15 or CD4 for survival
(A) Numbers of 2W:I-Ab tetramer-binding cells of the indicated memory subsets from the SLOs of individual Cd4WT/WT Il7rfl/fl (filled circles) or Cd4Cre-ERT2/WT Il7rfl/fl (open circles) mice (n ≥ 5 from four independent experiments) 50 days after aLm-2W infection and 30 days after tamoxifen treatment. Mean values are indicated with a horizontal bar. p values from a multiple unpaired t test. (B) Numbers of 2W:I-Ab tetramer-binding cells of the indicated memory subsets from the SLOs of individual wild-type (filled circles) or Il15−/− (open circles) mice (n ≥ 8 from four independent experiments) 30 days after aLm-2W infection. Mean values are indicated with a horizontal bar. p values from a multiple unpaired t test. (C) Normalized numbers of 2W:I-Ab plus LLOp:I-Ab tetramer-binding cells of the indicated memory subsets from mice infected with aLm-2W bacteria and then 40 days later, injected twice intraperitoneally with YTS177 CD4 antibody or control immunoglobulin (Ig)G, 7 days apart and analyzed 7 days after the second antibody injection. Mean values are indicated with a horizontal bar. p values from a multiple unpaired t test. (D) Fluorescence microscope images of spleens from uninfected mice or mice infected intravenously with aLm-2W bacteria 14 or 60 days before analysis. T cell areas were identified as dense collections of CD90.2+ cells (yellow). Follicles were identified as dense collections of IgD+ (purple) CD19+ (blue) cells and GCs as foci of CD19+ IgD GL7+ cells (bluish green) within follicles. GCs are indicated with arrows. A bar representing 300 μm is shown in the left panel. (E) Mean percentages (±SD, n = 2 sections averaged from three mice per group) of follicles containing a GL7+ GC in the spleens of mice from the indicated groups. p values were derived from a one-way ANOVA with a Tukey’s multiple-comparisons test.

References

    1. Tubo NJ, and Jenkins MK (2014). CD4+ T cells: guardians of the phagosome. Clin. Microbiol. Rev. 27, 200–213. 10.1128/CMR.00097-13. - DOI - PMC - PubMed
    1. Pepper M, and Jenkins MK (2011). Origins of CD4(+) effector and central memory T cells. Nat. Immunol. 12, 467–471, [pii]. 10.1038/ni.2038. - DOI - PMC - PubMed
    1. Homann D, Teyton L, and Oldstone MB (2001). Differential regulation of antiviral T-cell immunity results in stable CD8+ but declining CD4+ T-cell memory. Nat. Med. 7, 913–919. - PubMed
    1. Kurtulus S, Tripathi P, Opferman JT, and Hildeman DA (2010). Contracting the ‘mus cells’–does down-sizing suit us for diving into the memory pool? Immunol. Rev. 236, 54–67. 10.1111/j.1600-065X.2010.00920.x. - DOI - PMC - PubMed
    1. Milner JJ, Toma C, He Z, Kurd NS, Nguyen QP, McDonald B, Quezada L, Widjaja CE, Witherden DA, Crowl JT, et al. (2020). Heterogenous populations of tissue-resident CD8+ T cells are generated in response to infection and malignancy. Immunity 52, 808–824.e7. 10.1016/j.immuni.2020.04.007. - DOI - PMC - PubMed

Publication types

Associated data

LinkOut - more resources