. 2025 Jan 28;44(1):115120.
doi: 10.1016/j.celrep.2024.115120. Epub 2024 Dec 24.

MIRO2 promotes cancer invasion and metastasis via MYO9B suppression of RhoA activity

Affiliations

MIRO2 promotes cancer invasion and metastasis via MYO9B suppression of RhoA activity

Dillon P Boulton et al. Cell Rep. .

Abstract

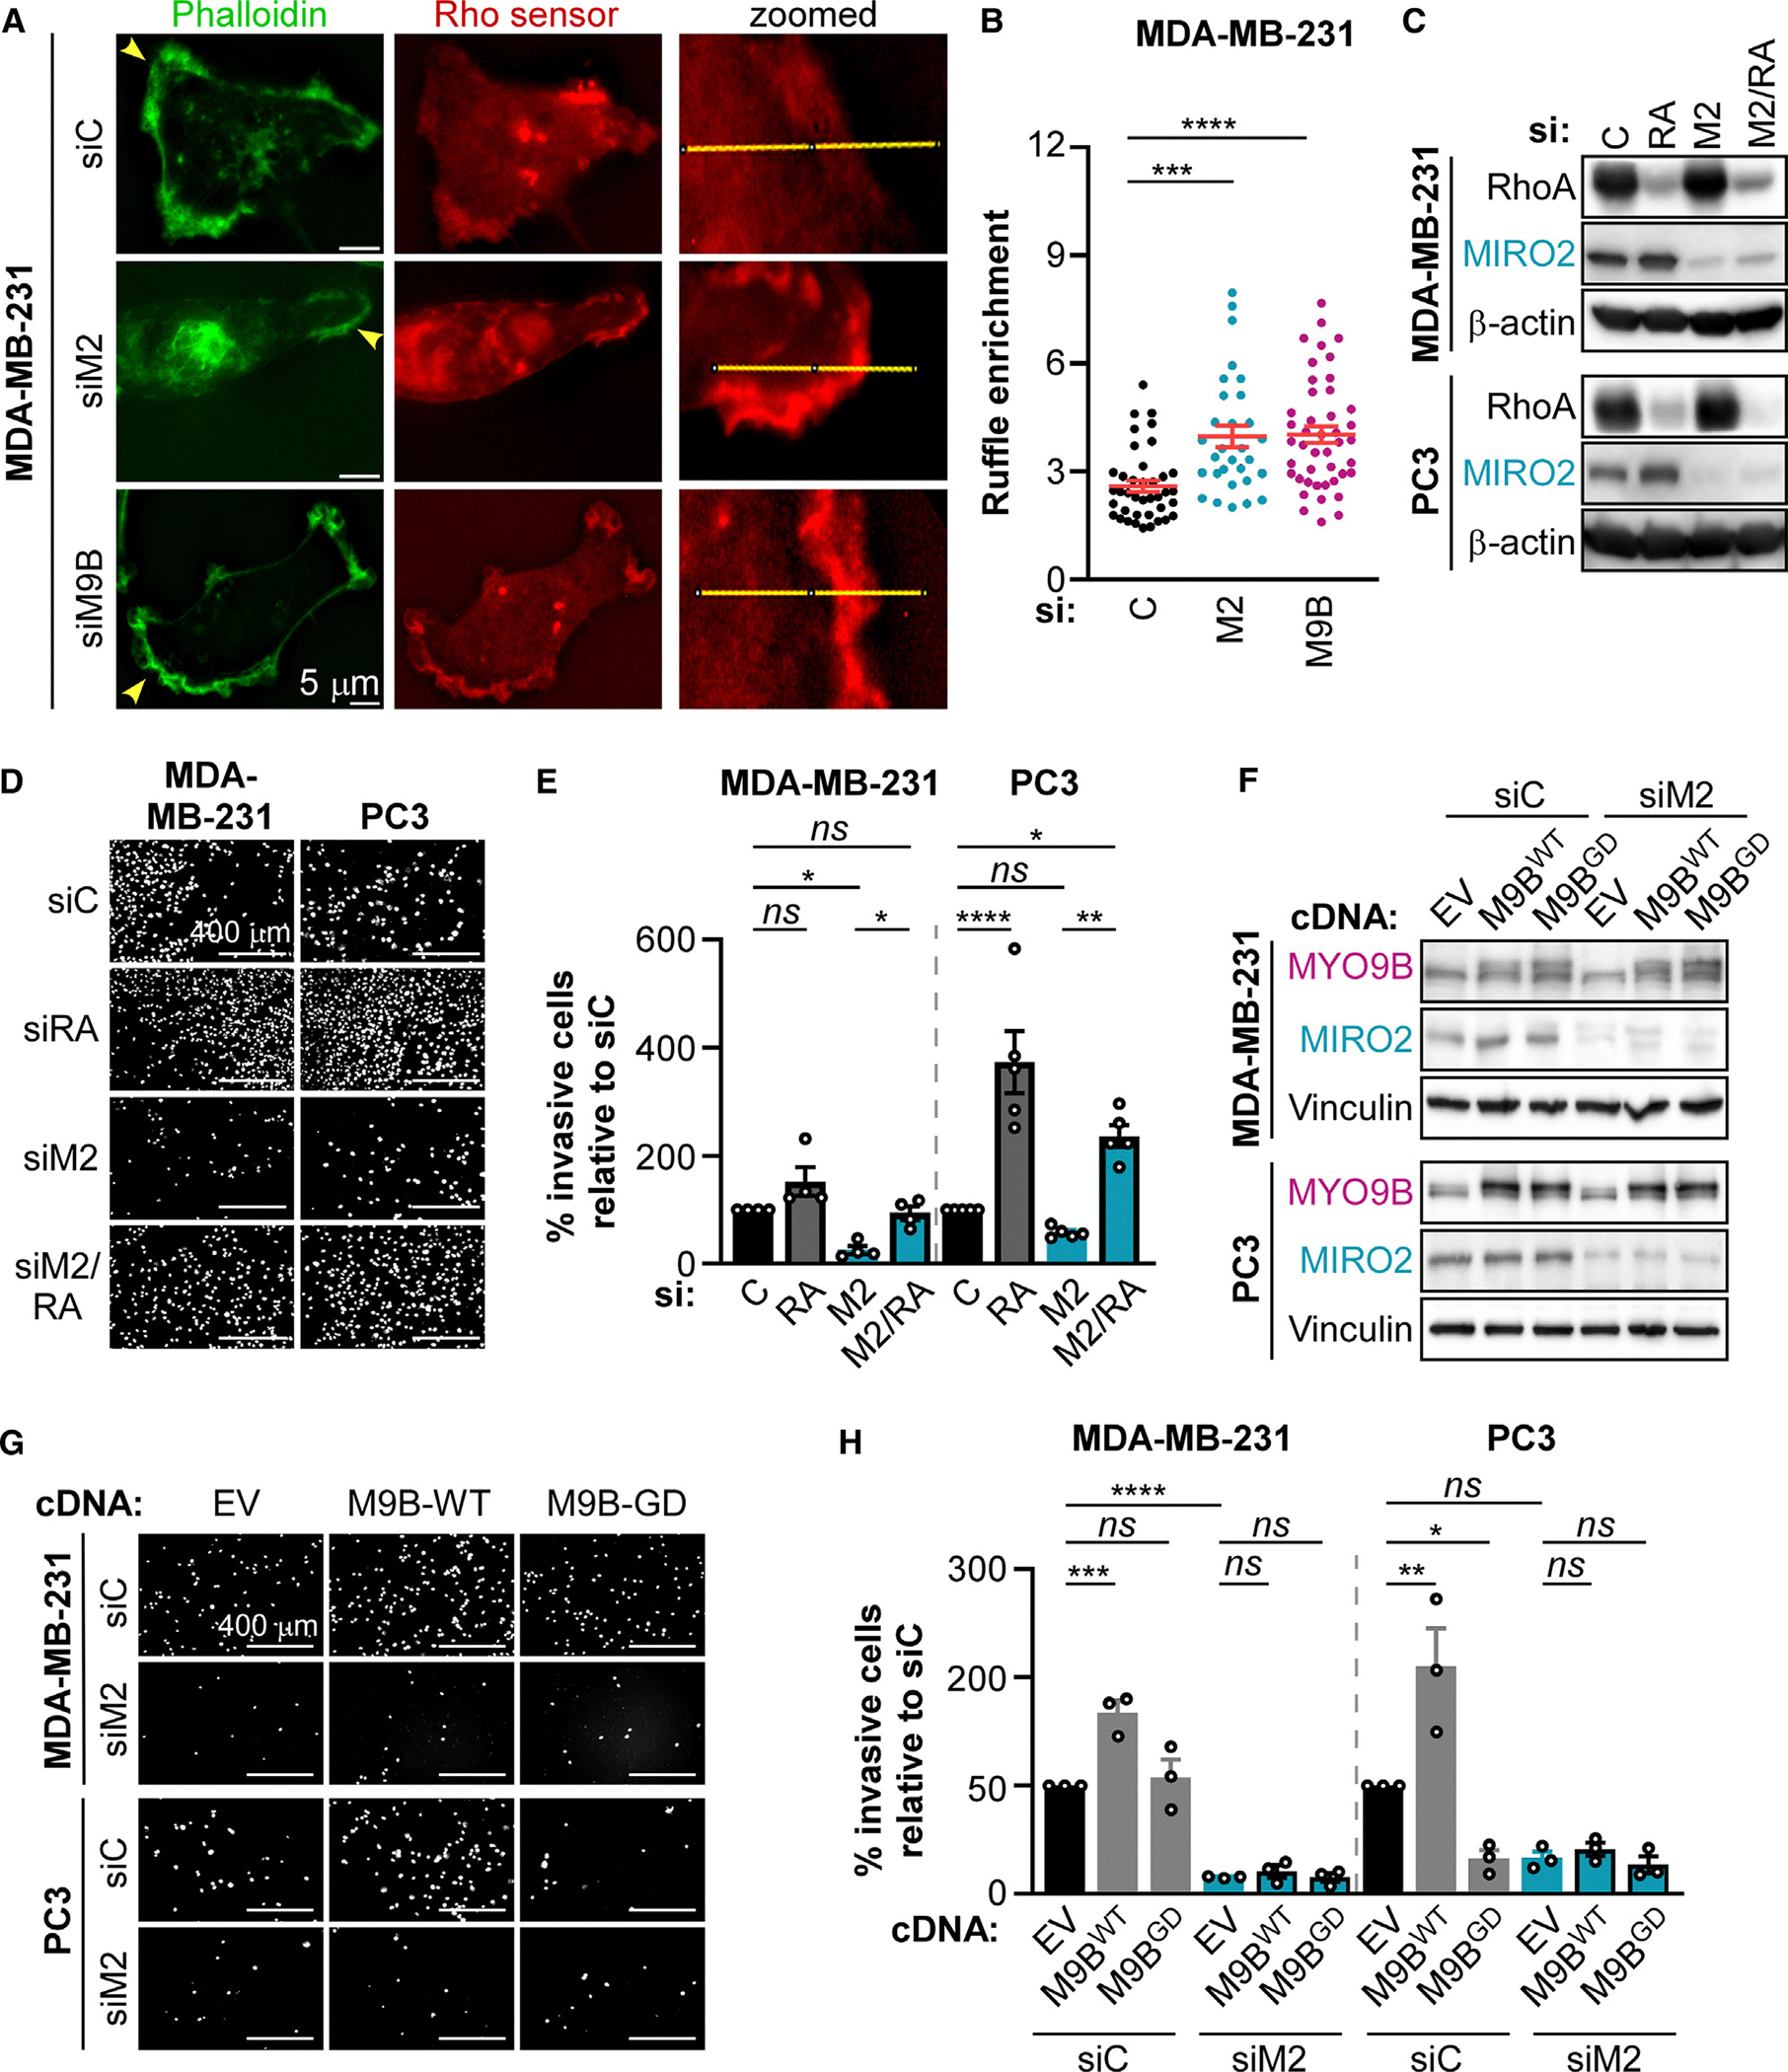
Metastasis to vital organs remains the leading cause of cancer-related deaths, emphasizing an urgent need for actionable targets in advanced-stage cancer. The role of mitochondrial Rho GTPase 2 (MIRO2) in prostate cancer growth was recently reported; however, whether MIRO2 is important for additional steps in the metastatic cascade is unknown. Here, we show that knockdown of MIRO2 ubiquitously reduces tumor cell invasion in vitro and suppresses metastatic burden in prostate and breast cancer mouse models. Mechanistically, depletion of MIRO2's binding partner-unconventional myosin 9B (MYO9B)-reduces tumor cell invasion and phenocopies MIRO2 depletion, which in turn results in increased active RhoA. Furthermore, dual ablation of MIRO2 and RhoA fully rescues tumor cell invasion, and MIRO2 is required for MYO9B-driven invasion. Taken together, we show that MIRO2 supports invasion and metastasis through cooperation with MYO9B, underscoring a potential targetable pathway for patients with advanced disease.

Keywords: CP: Cancer; CP: Molecular biology; MIRO2; MYO9B; RhoA; metastasis; small GTPases; tumor cell invasion.


Conflict of interest statement

Declaration of interests The authors declare no competing interests.

Figures

Figure 1.
Figure 1.. MIRO2 depletion universally impairs BCa and PCa tumor cell invasion.
The indicated cell lines were transfected with control (C) or MIRO2-targeting siRNA (M2a and M2b, two independent sequences) and used for downstream assays at 72 h post-transfection. (A) Western blot was carried out to confirm MIRO2 knockdown. Representative blots from n = 3 experiments are shown. (B and C) Cells were seeded in transwell invasion assays and allowed to invade for 16–24 h. (B) Representative images of invasive cells stained with DAPI. (C) Quantification of invaded cells/field, relative to control. Data are represented as the mean ± SEM (n = 3), and means were compared by one-way ANOVA and Dunnett’s post-test. (D) Cell growth was determined by CyQUANT cell proliferation assay measured at the time of plating and at 24 h post-plating. Data were calculated as the differential growth relative to control and are represented as the mean ± SEM (n = 3). Means were compared by one-way ANOVA and Dunnett’s post-test. (E) Comparison of the changes in invasion and growth in MIRO2 knockdown cells relative to control cells from (C) and (D), respectively. Data are represented as the mean ± SEM (n = 3), and means were compared by two-tailed unpaired t test. For (C)–(E), p values are represented as ns, not significant (p > 0.05), or *p < 0.05, **p < 0.01, ***p < 0.001, or ****p < 0.0001. See also Figure S1.
Figure 2.
Figure 2.. MIRO2 depletion dampens metastatic burden in vivo.
(A–F) PC3 cells stably expressing luciferase (Luc) and either control (C) or MIRO2-targeting shRNA (M2b and M2d, two independent sequences) were injected into the tail vein of male NSG mice (n = 12), and metastatic burden was determined via bioluminescence IVIS imaging. (A) Efficiency of knockdown at the time of injection was analyzed via western blot. (B) Representative IVIS images of mice at the endpoint (day 50 post-injection). (C) Quantification of Luc signal throughout the study. Data are represented as the mean ± SEM (n = 12), and means were compared by two-way ANOVA and Dunnett’s post-test. (D–F) Target organs containing Luc+ signal were analyzed histologically in hematoxylin and eosin-stained sections for the presence of metastatic foci. (D) Representative images of hematoxylin and eosin stains. Metastatic foci are outlined with black dashed lines. Quantification of metastatic burden in liver (E) and kidney (F) is represented as the mean ± SEM (n = 12), and means were compared by one-way ANOVA and Dunnett’s post-test. (G–L) 4T1 cells stably expressing Luc and either control (C) or MIRO2-targeting shRNA (M2a and M2b, two independent shRNA sequences) were injected into the mammary fat pad of female BALB/c mice (n = 10). (G) Efficiency of knockdown at the time of injection was analyzed via western blot. (H) Primary tumors were measured with calipers to quantitate tumor volume. Data are represented as the mean ± SEM (n = 10), and means were compared by two-way ANOVA and Dunnett’s post-test. (I) Primary tumors were removed at around 450 mm and metastatic disease was tracked via IVIS imaging. Representative images of mice at the endpoint (day 14 post-primary tumor removal). Red boxes highlight the region where the Luc signal was measured to avoid the location of primary tumors that were resected. (J) Quantification of Luc signal, with data represented as the mean ± SEM (see STAR Methods for group size explanation; n = 9 for shC and shM2b and n = 7 for shM2a). Means were compared by two-way ANOVA and Dunnett’s post-test. (K) Target organs containing Luc+ signal were analyzed histologically in hematoxylin and eosin-stained sections for the presence of metastatic foci. Representative images of lungs are provided, with metastatic foci outlined with black dashed lines. (L) Quantification of metastatic burden in lungs. Data are represented as the mean ± SEM (see STAR Methods for group size explanation; n = 10 for control, n = 6 for shM2a, and n = 8 for shM2b), and means were compared by one-way ANOVA and Dunnett’s post-test. For (C), (E), (F), (H), (J), and (L), p values are represented as ns, not significant (p > 0.05), or *p < 0.05, **p < 0.01, ***p < 0.001, or ****p < 0.0001. See also Figure S2.
Figure 3.
Figure 3.. MIRO2 is expressed in the epithelium of human primary and metastatic tumors.
(A–C) A PCa progression TMA was stained for MIRO2 via IHC and analyzed for expression. NR, non-recurrent; R, recurrent. (A) Representative images of MIRO2 stains in primary and metastatic PCa tumors. (B) Distribution of MIRO2 expression scores. (C) Average MIRO2 expression in stromal and epithelial compartments. Data are represented as the mean ± SEM (n = 127 for primary tumors and n = 181 for metastatic tumors). *p = 0.0189 and ****p < 0.0001 by one-way ANOVA and Tukey’s post-test. (D–F) A BCa TMA was stained for MIRO2 via IHC and analyzed for expression. (D) Representative images of MIRO2 stains in primary and metastatic BCa tumors. (E) MIRO2 expression according to nodal status (N0–N3) of primary tumors. Data are represented as the mean ± SEM (n = 53 for N0 tumors, n = 46 for N1 tumors, and n = 21 for N2–3 tumors). ns, not significant (p > 0.05), and ****p < 0.0001 by one-way ANOVA and Tukey’s post-test. (F) MIRO2 expression according to tumor grade. Data are represented as box and Tukey whiskers (n = 16 for tumor grade 1, n = 67 for tumor grade 2, and n = 43 for tumor grade 3). p = 0.7087 by one-way ANOVA. See also Figure S3.
Figure 4.
Figure 4.. MYO9B positively regulates BCa and PCa tumor cell invasion.
The indicated cell lines were transfected with control (C) or MYO9B-targeting siRNA (M9B-a and M9B-b, two independent sequences) and used for downstream assays at 72 h post-transfection. (A) Western blot was carried out to confirm MIRO2 knockdown. Representative blots from n = 3 experiments are shown. (B) Cells were seeded in transwell invasion assays and allowed to invade for 18–24 h. Representative images of invasive cells stained with DAPI are provided. (C) Quantification of invasive cells/field relative to control. Data are represented as the mean ± SEM (n = 3), and means were compared by one way ANOVA and Dunnett’s post-test. (D) Cell growth was determined by CyQUANT cell proliferation assay measured at the time of plating and at 24 h post-plating. Data were calculated as the differential growth relative to control. Data are represented as the mean ± SEM (n = 3), and means were compared by one-way ANOVA and Dunnett’s post-test. (E) Comparison of the changes in invasion and growth in MYO9B-knockdown cells relative to control cells from (C) and (D), respectively. Data are represented the mean ± SEM (n = 3), and means were compared by two-tailed unpaired t test. For (C)–(E), p values are represented as ns, not significant (p > 0.05), or *p < 0.05, **p < 0.01, ***p < 0.001, or ****p < 0.0001. See also Figure S4.
Figure 5.
Figure 5.. MYO9B and RhoA are binding partners of MIRO2.
(A) Protein lysates from PC3 or MDA-MB-231 cells transiently overexpressing FLAG-entry vector (EV) or FLAG-MIRO2 were immunoprecipitated with anti-FLAG beads and analyzed by western blot for coIP with MYO9B and RhoA. Representative blots from n = 3 experiments are shown. (B) Protein lysates from PC3 or MDA-MB-231 cells transiently overexpressing EGFP-empty vector (EV), EGFP-MYO9B-wild type (WT), or EGFP-MYO9B-R1695M (GAP deficient, GD) were immunoprecipitated with GFP-trap beads and analyzed by western blot for coIP with MIRO2 and RhoA. Representative blots from n = 3 experiments are shown. (C) Protein lysates from PC3 or MDA-MB-231 cells transiently overexpressing EGFP-EV, EGFP-RhoA-wild type (RAWT), EGFP-RhoA-T19N (RA19N), or EGFP-RhoA-Q63L (RA63L) were immunoprecipitated with GFP-trap beads and analyzed by western blot for coIP with MIRO2 and MYO9B. Representative blots from n = 3 experiments are shown. (D) MIRO2-myc truncation constructs. (E and F) Protein lysates from PC3 cells co-expressing MIRO2-myc truncation constructs and either EGFP-MYO9B (E) or EGFP-RhoA (F) were immunoprecipitated with GFP-trap beads and analyzed by western blot for coIP with myc-tagged proteins. Representative blots from n = 3 experiments are shown. (G) Quantification of relative immunoprecipitated binding of MYO9B or RhoA with the MIRO2 truncations from blots in (E) and (F). Data are represented as the mean ± SEM (n = 3), and means were compared by one-way ANOVA and Dunnett’s post-test. (H) EGFP-MYO9B truncation constructs. (I and J) Protein lysates from PC3 cells co-expressing EGFP-MYO9B truncation constructs and either MIRO2-FLAG (I) or RhoA-FLAG (J) were immunoprecipitated with anti-FLAG beads and analyzed by western blot for coIP with EGFP-tagged proteins. Representative blots from n = 3 experiments are shown. ns, non-specific bands appear at the indicated molecular weight. (K) Quantification of relative immunoprecipitated binding of MIRO2 or RhoA with the MYO9B truncations from blots in (I) and (J). Data are represented as the mean ± SEM (n = 3), and means were compared by one-way ANOVA and Dunnett’s post-test. For (G) and (K), p values are represented as *p < 0.05, **p < 0.01, ***p < 0.001, or ****p < 0.0001. All other comparisons were not significant (p > 0.05).
Figure 6.
Figure 6.. MIRO2 and MYO9B control tumor cell invasion via inactivation of RhoA.
(A) MDA-MB-231 cells were transfected with control, MYO9B (M9B), or MIRO2 (M2) pooled siRNA in combination with a Rho sensor (dTomato-2xrGBD), plated into collagen-coated slides, and analyzed via fluorescence microscopy. Arrows point to ruffles selected for analysis and zoomed panels include region of line scans. (B) Quantification of Rho sensor signal enrichment at the ruffles. Data are represented as the mean ± SEM, and means were compared by one-way ANOVA and Dunnett’s post-test. (C–E) The indicated cell lines were transfected with control, MIRO2 (M2), RhoA (RA), or a combination of both MIRO2 and RhoA (M2/RA) pooled siRNA and used for downstream assays at 72 h post-transfection. (C) Representative blots showing the efficiency of knockdown. (D) Cells were seeded in transwell invasion chambers and allowed to invade for 18–24 h. Representative images of invasive cells stained with DAPI are shown. (E) Quantification of invasive cells/field, relative to control. Data are represented as the mean ± SEM (n = 4 for MDA-MB-231 and n = 5 for PC3), and means were compared by one-way ANOVA and Dunnett’s post-test. (F–H) The indicated cell lines were transfected with either control or MIRO2 (M2) pooled siRNA for 24 h, followed by cDNA transfection of either EGFP-empty (EV), EGFP-MYO9B-wildtype (WT), or EGFP-MYO9B-R1695M (GAP deficient, GD) for 48 h. (F) Representative western blots at time of plating. (G) Cells were seeded in transwell invasion chambers and allowed to invade for 18–24 h. Representative images of invasive cells stained with DAPI are shown. (H) Quantification of invasive cells/field, relative to control. Data are represented as the mean ± SEM (n = 3), and means were compared by one-way ANOVA and Dunnett’s post-test. For (B), (E), and (H), p values are represented as ns, not significant (p > 0.05), or *p < 0.05, **p < 0.01, ***p < 0.001, or ****p < 0.0001. See also Figures S5 and S6.
Figure 7.
Figure 7.. MIRO2 suppresses RhoA-dependent gene expression in patient cohorts.
(A and B) The top 1,000 genes differentially expressed in MIRO2 high (Q4) versus MIRO2 low (Q1) samples from the Prostate TCGA (A) and Breast TCGA (B) datasets were subjected to pathway analysis. The top 20 pathways are shown with Rho family GTPase-related pathways highlighted. (C and D) Gene set enrichment analysis of RhoA-specific genes in MIRO2 high (Q4) and low (Q1) samples from the Prostate TCGA (C) and Breast TCGA (D) databases. NES, normalized enrichment score; FDR, false discovery rate. See also Figure S7.

Similar articles

Cited by

References

    1. Valastyan S, and Weinberg RA (2011). Tumor metastasis: molecular insights and evolving paradigms. Cell 147, 275–292. 10.1016/j.cell.2011.09.024. - DOI - PMC - PubMed
    1. Riley RS, June CH, Langer R, and Mitchell MJ (2019). Delivery technologies for cancer immunotherapy. Nat. Rev. Drug Discov. 18, 175–196. 10.1038/s41573-018-0006-z. - DOI - PMC - PubMed
    1. Gross S, Rahal R, Stransky N, Lengauer C, and Hoeflich KP (2015). Targeting cancer with kinase inhibitors. J. Clin. Invest. 125, 1780–1789. 10.1172/JCI76094. - DOI - PMC - PubMed
    1. Scheid AD, Beadnell TC, and Welch DR (2021). Roles of mitochondria in the hallmarks of metastasis. Br. J. Cancer 124, 124–135. 10.1038/s41416-020-01125-8. - DOI - PMC - PubMed
    1. Caino MC, and Altieri DC (2016). Molecular Pathways: Mitochondrial Reprogramming in Tumor Progression and Therapy. Clin. Cancer Res. 22, 540–545. 10.1158/1078-0432.CCR-15-0460. - DOI - PMC - PubMed

Publication types

MeSH terms