. 2024 Dec 26;10(3):e174825.
doi: 10.1172/jci.insight.174825.

Glucose-dependent insulinotropic polypeptide receptor signaling alleviates gut inflammation in mice

Affiliations

Glucose-dependent insulinotropic polypeptide receptor signaling alleviates gut inflammation in mice

Rola Hammoud et al. JCI Insight. .

Abstract

Glucose-dependent insulinotropic polypeptide (GIP) and glucagon-like peptide 1 (GLP-1) are gut-derived peptide hormones that potentiate glucose-dependent insulin secretion. The clinical development of GIP receptor-GLP-1 receptor (GIPR-GLP-1R) multiagonists exemplified by tirzepatide and emerging GIPR antagonist-GLP-1R agonist therapeutics such as maritide is increasing interest in the extrapancreatic actions of incretin therapies. Both GLP-1 and GIP modulate inflammation, with GLP-1 also acting locally to alleviate gut inflammation in part through antiinflammatory actions on GLP-1R+ intestinal intraepithelial lymphocytes. In contrast, whether GIP modulates gut inflammation is not known. Here, using gain- and loss-of-function studies, we show that GIP alleviates 5-fluorouracil-induced (5FU-induced) gut inflammation, whereas genetic deletion of Gipr exacerbates the proinflammatory response to 5FU in the murine small bowel (SB). Bone marrow (BM) transplant studies demonstrated that BM-derived Gipr-expressing cells suppress 5FU-induced gut inflammation in the context of global Gipr deficiency. Within the gut, Gipr was localized to nonimmune cells, specifically stromal CD146+ cells. Hence, the extrapancreatic actions of GIPR signaling extend to the attenuation of gut inflammation, findings with potential translational relevance for clinical strategies modulating GIPR action in people with type 2 diabetes or obesity.

Keywords: Diabetes; Endocrinology.


Figures

Figure 1
Figure 1. Treatment with [D-Ala2]-GIP downregulates cytokine gene expression in the small bowel of mice exposed to 5FU.
(A) Schematic representation of the experimental protocol. (BD) Gene expression, relative to Tbp, of cytokines in response to 5FU and [DAla2]-GIP coadministration within the duodenum, jejunum, and ileum (n = 5–6). Data are presented as mean ± SD of samples pooled from 3 independent mouse cohorts. *P ≤ 0.05, **P ≤ 0.01, ***P ≤ 0.001, and ****P ≤ 0.0001 by 2-way ANOVA followed by Tukey post hoc tests.
Figure 2
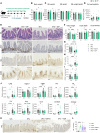
Figure 2. GIPR agonism protects against high-dose 5FU–induced gut damage and inflammation.
(A) Schematic representation of the experimental protocol. (BD) Body weight, small bowel weight and length adjusted for tibia length as well as SB weight/length ratio (n = 10), and gut permeability measured as the concentration of plasma ovalbumin 3 hours after oral ovalbumin gavage (n = 5). (E) Representative images for ileum stained with H&E, anti-Ki67, anti-neutrophil elastase (anti-NE), and anti-CD68 antibody (magnification, 20×). Scale bar: 50 μm. (F) Quantification of villus height, crypt depth, and crypt density (n = 8–9). (G) Average number of Ki67+ cells per ring (n = 9–10). (H) Average number of NE+ cells per ring (n = 7–10). (I) Average positive area of CD68+ signal per ring (n = 8–10). (J) Ileal gene expression relative to Ppia of inflammatory markers in response to 5FU and [DAla2 ]-GIP coadministration (n = 9–10). (K and L) Representative images (magnification, 20×). Scale bar: 50 μm. Quantification of anti-NE staining within the ileum of mice treated with either Veh, 5FU, 5FU and semaglutide (Sema, 10 nmol/kg/day), or 5FU and tirzepatide (TZP, 3 nmol/kg/day) (n = 8–10). Data are presented as mean ± SD of samples pooled from 2 independent mouse cohorts. *P ≤ 0.05, **P ≤ 0.01, ***P ≤ 0.001, and ****P ≤ 0.0001 by 2-way ANOVA followed by Tukey post hoc tests (BD, FJ) and by 1-way ANOVA followed by Dunnett’s test with 5FU as the control (L).
Figure 3
Figure 3. Gipr–/– mice exhibit increased sensitivity to 5FU-induced gut inflammation.
(A) Schematic representation of experimental protocol performed. (B and C) Gene expression relative to Tbp (B) and protein expression (C) of inflammation-related markers within the ileum of Gipr+/+ and Gipr–/– mice with or without 5FU exposure (n = 4–7). (D) Circulating IL-1β concentrations (n = 6–8). Data are presented as mean ± SD of samples pooled from 3 independent mouse cohorts. *P ≤ 0.05, **P ≤ 0.01, ***P ≤ 0.001, and ****P ≤ 0.0001 by 2-way ANOVA followed by Tukey post hoc tests.
Figure 4
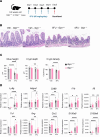
Figure 4. Gipr–/– mice exhibit increased sensitivity to high-dose 5FU–induced gut damage and inflammation in the ileum.
(A) Schematic representation of the experimental protocol. (B) Representative images for ileum stained with H&E (magnification, 20×). Scale bar: 50 μm. (C) Quantification of ileum villus height, crypt depth, and crypt density (n = 5–9). (D) Gene expression relative to Ppia of inflammatory markers within the ileum in response to 5FU in Gipr+/+ or Gipr–/– mice (n = 2–13). Data are presented as mean ± SD of samples pooled from 2 independent mouse cohorts. *P ≤ 0.05, **P ≤ 0.01, ***P ≤ 0.001, and ****P ≤ 0.0001 by 2-way ANOVA followed by Tukey post hoc tests.
Figure 5
Figure 5. BM-specific Gipr deletion does not increase 5FU-induced gut inflammation.
(A) Percentage of CD45.1+ and CD45.2+ cells out of total CD45+ cells in the peripheral blood of WT CD45.1 recipient mice transplanted with BM from Gipr+/+ or Gipr–/– CD45.2 donor mice (WTBM-Gipr+/+ versus WTBM-Gipr–/–) (n = 20) as depicted in Supplemental Figure 7A. (B) Gipr mRNA expression relative to Rpl32 in BM (n = 6–12). (C) Gipr and Gip mRNA expression relative to Tbp in the ileum (n = 7–13). (D) Total plasma GIP concentration (n = 7–13). (E and F) Ileal gene expression (E) relative to Tbp and protein expression (F) of inflammation-related markers (n = 7–13). Data are presented as mean ± SD of samples pooled from 4 independent mouse cohorts. *P ≤ 0.05, **P ≤ 0.01, ***P ≤ 0.001, ****P ≤ 0.0001 by 2-way ANOVA followed by Tukey post hoc tests.
Figure 6
Figure 6. BM-derived Gipr-expressing cells suppress 5FU-induced gut inflammation in the context of global Gipr deficiency.
(A) Percentage of sorted CD45.1+ and CD45.2+ cells out of total CD45+ cells in the peripheral blood of Gipr–/– and Gipr+/+ CD45.2 recipient mice transplanted with BM from WT CD45.1 mice (i.e., Gipr+/+BM-WT versus Gipr–/–BM-WT) (n = 10–16) as depicted in Supplemental Figure 8A. (B and C) BM Gipr expression relative to Rpl32 (n = 4–11) and ileal Gipr and Gip expression relative to Tbp in Gipr+/+BM-WT and Gipr–/–BM-WT mice with or without 5FU exposure (n = 5–12). (D) Total plasma GIP concentration (n = 5–12). (E and F) Ileal gene expression (E) relative to Tbp and protein expression (F) of cytokines (n = 5–12). (G) Plasma cytokine concentrations (n = 5–12). Data are presented as mean ± SD of samples pooled from 3 independent mouse cohorts. *P ≤ 0.05, **P ≤ 0.01, ***P ≤ 0.001, ****P ≤ 0.0001 by 2-way ANOVA followed by Tukey post hoc tests.
Figure 7
Figure 7. Gipr is predominantly expressed in nonimmune cells within the lamina propria of the small bowel.
(A) Relative Gipr expression across various tissues. (B) Relative radiant efficiency expression levels of tdTomato from GiprCre–tdTomato+/+ mice normalized to the average radiant efficiency expression of tdTomatofl/fl across gut segments (n = 3). (C) Gene expression relative to Rpl32 in manually dissected small bowel compartments (n = 6). (D) mRNA expression relative to Rpl32 in lamina propria (LP) + muscle and epithelium throughout distinct segments of the small bowel (n = 5–6). (E and F) Confocal microscopy of jejunum segments showing expression of GIPR-tdTomato (red), DAPI (blue), and E-cadherin (CDH1) (green) (E) or CD45 (green) (F) (magnification, 40×). Scale bar: 20 mm. (G) GIPR-tdTomato mean fluorescence intensity (MFI) of distinct cell populations isolated from the small bowel (n = 4–8). (H) Gene expression in whole jejunum, LP + muscle, total cells after digestion (crude cells), and isolated CD146 and CD146+ cells via magnetic cell separation (n = 5–11). Data are presented as mean ± SD from samples from 1 experiment (AF) and pooled from 2 independent experiments (G and H) with each data value corresponding to 1 mouse. *P ≤ 0.05, **P ≤ 0.01, ***P ≤ 0.001, ****P ≤ 0.0001 by 1-way ANOVA followed by Tukey post hoc tests. BAT, brown adipose tissue; BS, brain stem; Duo, duodenum; ECs, endothelial cells; Hypo, hypothalamus; Ile, ileum; Jej, jejunum; Kid, kidney; M. Col, medial colon; M. Fat, mesenteric fat; ND, not detected; P. Col, proximal colon; P. Fat, perirenal fat; Panc, pancreas; Sk. M, skeletal muscle.

References

    1. Baggio LL, Drucker DJ. Biology of incretins: GLP-1 and GIP. Gastroenterology. 2007;132(6):2131–2157. doi: 10.1053/j.gastro.2007.03.054. - DOI - PubMed
    1. Hammoud R, Drucker DJ. Beyond the pancreas: contrasting cardiometabolic actions of GIP and GLP1. Nat Rev Endocrinol. 2023;19(4):201–216. doi: 10.1038/s41574-022-00783-3. - DOI - PubMed
    1. Drucker DJ. The biology of incretin hormones. Cell Metab. 2006;3(3):153–165. doi: 10.1016/j.cmet.2006.01.004. - DOI - PubMed
    1. Nauck MA, Muller TD. Incretin hormones and type 2 diabetes. Diabetologia. 2023;66(10):1780–1795. doi: 10.1007/s00125-023-05956-x. - DOI - PMC - PubMed
    1. Drucker DJ, Holst JJ. The expanding incretin universe: from basic biology to clinical translation. Diabetologia. 2023;66(10):1765–1779. doi: 10.1007/s00125-023-05906-7. - DOI - PubMed

Substances

LinkOut - more resources