. 2024 Dec 26;20(12):e1012697.
doi: 10.1371/journal.pcbi.1012697. eCollection 2024 Dec.

Deciphering regulatory architectures of bacterial promoters from synthetic expression patterns

Affiliations

Deciphering regulatory architectures of bacterial promoters from synthetic expression patterns

Rosalind Wenshan Pan et al. PLoS Comput Biol. .

Abstract

For the vast majority of genes in sequenced genomes, there is limited understanding of how they are regulated. Without such knowledge, it is not possible to perform a quantitative theory-experiment dialogue on how such genes give rise to physiological and evolutionary adaptation. One category of high-throughput experiments used to understand the sequence-phenotype relationship of the transcriptome is massively parallel reporter assays (MPRAs). However, to improve the versatility and scalability of MPRAs, we need a "theory of the experiment" to help us better understand the impact of various biological and experimental parameters on the interpretation of experimental data. These parameters include binding site copy number, where a large number of specific binding sites may titrate away transcription factors, as well as the presence of overlapping binding sites, which may affect analysis of the degree of mutual dependence between mutations in the regulatory region and expression levels. To that end, in this paper we create tens of thousands of synthetic gene expression outputs for bacterial promoters using both equilibrium and out-of-equilibrium models. These models make it possible to imitate the summary statistics (information footprints and expression shift matrices) used to characterize the output of MPRAs and thus to infer the underlying regulatory architecture. Specifically, we use a more refined implementation of the so-called thermodynamic models in which the binding energies of each sequence variant are derived from energy matrices. Our simulations reveal important effects of the parameters on MPRA data and we demonstrate our ability to optimize MPRA experimental designs with the goal of generating thermodynamic models of the transcriptome with base-pair specificity. Further, this approach makes it possible to carefully examine the mapping between mutations in binding sites and their corresponding expression profiles, a tool useful not only for developing a theory of transcription, but also for exploring regulatory evolution.


Conflict of interest statement

The authors have declared that no competing interests exist.

Figures

Fig 1
Fig 1. A computational pipeline for deciphering regulatory architectures from first principles.
Given (1) knowledge or assumptions about the regulatory architecture of a promoter, we make use of (2) thermodynamic models to construct a states-and-weights diagram, which contains information about all possible states of binding and the associated Boltzmann weights. Here, in the states-and-weights diagram, P is the copy number of RNAP, R is the copy number of the repressor, NNS is the number of non-specific binding sites, and Δεpd and Δεrd represent the binding energies of RNAP and the repressors at their specific binding sites relative to the non-specific background, respectively. Using these states-and-weights diagrams as well as the energy matrices, which are normalized to show the change in binding energies for any mutation along the promoter compared to the wild-type sequence, we can (3) predict the expression levels for each of the promoter variants in a mutant library. To recover the regulatory architecture, we (4) calculate the mutual information between the predicted expression levels and mutations at each position along the promoter according to Eq 6. In particular, there is high mutual information if a mutation leads to a large change in expression and there is low mutual information if a mutation does not lead to a significant change in expression. The mutual information at each position is plotted in an information footprint, where the height of the peaks corresponds to the magnitude of mutual information, defined in Eq 6, and the peaks are colored based on the sign of expression shift, defined in Eq 9. Given the assumption that the positions with high mutual information are likely to be RNAP and transcription factor binding sites, we (5) recover the regulatory architecture of the promoter. The base-specific effects of mutations on expression levels can also be seen from expression shift matrices, which are calculated using Eq 10, where the difference between the expression levels of sequences carrying a specific mutation at a given position and the average expression level across all mutant sequences is computed.
Fig 2
Fig 2. Required parameters for the thermodynamic model of a promoter with the simple repression regulatory architecture.
For a promoter with the simple repression regulatory architecture, five parameters are required. These parameters are (1) the number of non-specific binding sites, NNS, (2) the copy number of the RNA polymerase, P, (3) the copy number of the repressor, R, (4) the sequence-specific binding energy of the RNA polymerase at its binding site, Δεpd, and (5) the sequence-specific binding energy of the repressor at its binding site, Δεrd.
Fig 3
Fig 3. Mapping binding site sequences to binding energies using energy matrices.
(A) Given the assumption that binding energies are additive, we can use an energy matrix to determine how much energy each base along the binding site contributes and compute the total binding energy by taking the sum of the binding energies contributed by each position. The total binding energy can be used to compute the Boltzmann weight for each of the states, which is then used to calculate the probability of RNAP being bound. (B) Experimentally measured energy matrices of RNAP [52], the repressor LacI [53], and the activator CRP [8].
Fig 4
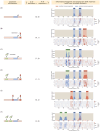
Fig 4. Building information footprints and expression shift matrices based on synthetic datasets of different regulatory architectures.
We describe each of the regulatory architectures using the notation (A,R), where A refers to the number of activator binding sites and R refers to the number of repressor binding sites. The corresponding information footprints and expression shift matrices built from synthetic datasets are shown on the right. The architectures shown in panels A-F are constitutive expression, simple repression, simple activation, repression-activation, double repression, and double activation, respectively. For panels A-C, we use energy matrices of RNAP, LacI, and CRP shown in Fig 3B. For panels D-F, we continue to use the experimentally measured energy matrix for RNAP; the energy matrices for the repressors and the activators are constructed by hand, where the interaction energies at the wild type bases are set to 0 kBT and the interaction energies at the mutant bases are set to 1 kBT.
Fig 5
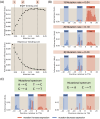
Fig 5. Changing mutation rate and adding mutational biases.
(A) Changes in the average mutual information at the RNAP and at the repressor binding sites when the mutation rate of the mutant library is increased. Average mutual information is calculated according to Eq 11. Each data point is the mean of average mutual information across 20 synthetic datasets with the corresponding mutation rate. The numbered labels correspond to information footprints shown in (B). (B) Representative information footprints built from synthetic datasets with mutation rates of 0.04, 0.1, and 0.2. (C) Information footprints built from synthetic datasets where the mutant library has a limited mutational spectrum. The left panel shows a footprint where mutations from A to G, G to A, T to C, and C to T are allowed. The right panel shows a footprint where only mutations from G to A and from C to T are allowed.
Fig 6
Fig 6. Noise as a function of library size.
(A) Signal-to-noise ratio increases as library size increases. Signal-to-noise ratio is calculated according to Eq 17. Each data point is the mean of average mutual information across 20 synthetic datasets with the corresponding library size. The numbered labels correspond to footprints in (B). (B) Representative information footprints with a library size of 100, 500, and 1000.
Fig 7
Fig 7. The strength of the signal at binding sites depends on the free energy of repressor binding.
(A) Increasing the binding energy of the repressor leads to an increase in average mutual information at the RNAP binding site and a decrease in average mutual information at the repressor binding site. Δεpd is fixed at -5 kBT, RNAP copy number is fixed at 1000, and repressor copy number is fixed at 10. Each data point is the mean of average mutual information across 20 synthetic datasets with the corresponding repressor binding energy. Numbered labels correspond to footprints in (B). (B) Representative information footprints where Δεrd is set to −20 kBT and −10 kBT. (C) Increasing the copy number of the repressor leads to a decrease in average mutual information at the RNAP binding site and an increase in average mutual information at the repressor binding site. Δεpd is fixed at -5 kBT and Δεrd is fixed at -15 kBT. RNAP copy number is fixed at 1000. Each data point is the mean of average mutual information across 20 synthetic datasets with the corresponding repressor copy number. Numbered labels correspond to footprints in (D). (D) Representative information footprints where repressor copy numbers are set to 1 and 500.
Fig 8
Fig 8. Changing repressor copy number for a double-repression promoter.
(A) Changing the copy number of the first repressor under AND logic and OR logic affects the signal at both repressor binding sites. For the energy matrices of the repressors, the interaction energy between the repressor and a site is set to 0 kBT if the site has the wild-type base identity and set to 1 kBT if the site has the mutant base identity. The interaction energy between the repressors is set to −5 kBT. 200 synthetic datasets are simulated for each copy number. We observe that the average mutual information at binding sites has high variability across synthetic datasets, especially under OR logic. To show variability, the trajectory for each of the synthetic dataset is shown as an individual light green or light purple curve. The average trajectories across all 200 synthetic datasets are shown as the bolded green curves and the bolded purple curves. The numbered labels correspond to footprints in (B). (B) Representative information footprints of a double repression promoter under AND and OR logic.
Fig 9
Fig 9. Changing the copy number of transcription factor binding sites.
(A) Average mutual information at the repressor binding site decreases when the number of repressor binding sites is increased. Repressor copy number is set to 10 for all data points. Each data point is the mean of average mutual information across 20 synthetic datasets with the corresponding number of repressor binding sites. Numbered labels correspond to footprints in (B). (B) Representative information footprints for cases where there is only 1 repressor binding site and when there are 50 repressor binding sites.
Fig 10
Fig 10. Changing the concentration of the inducer.
(A) Average mutual information at the repressor binding site decreases as the inducer concentration increases. pbound for the promoter with an inducible repressor is derived in S8 Appendix. Here, we use the following thermodynamic parameters: the dissociation constant of the inducer at the binding pockets of the active repressor KA = 139 × 10−6 M, the dissociation constant of the inducer at the binding pockets of the inactive repressor KI = 0.53 × 10⁻⁶ M, and the structural energy difference between the active repressor and the inactive repressor ΔεAI = 4.5 kBT. The thermodynamic parameters were inferred by Razo-Mejia et al. from predicted IPTG induction curves [72]. The inducer concentration on the x-axis is normalized with respect to the value of KA. Each data point is the mean of average mutual information across 20 synthetic datasets with the corresponding inducer concentration. The numbered labels correspond to footprints in (B). (B) Representative information footprints with low inducer concentration (10−6 M) and high inducer concentration (10−3 M).
Fig 11
Fig 11. Annotating transcription factor binding sites by identifying sites with high signal.
The footprint of the mar operon, produced by Ireland et al [16]. The binding sites are annotated based on known RNAP and transcription factor binding sites; the signal at some of the binding sites, such as the Fis and MarA binding sites, are not distinguishable from background noise.
Fig 12
Fig 12. Adding extrinsic noise to synthetic datasets.
(A) Increasing extrinsic noise lowers the signal-to-noise ratio in information footprints. For all synthetic datasets, the copy numbers of RNAP and repressors are drawn using the Log-Normal distributions described in S10 Appendix. In the Log-Normal distributions, μ is set to 5000 for RNAPs and 100 for repressors. Each data point is the mean of average mutual information across 100 synthetic datasets with the corresponding coefficient of variation. The numbered labels correspond to footprints in (B). (B) Representative information footprints with three levels of extrinsic noise.
Fig 13
Fig 13. Non-specific RNAP binding can create low levels of noise and lead to non-canonical functional binding sites.
(A) States-and-weights diagram of a simple repression promoter where spurious RNAP binding is allowed. For each of the RNAP spurious binding events, the binding energy, Δεpd,i, is computed by mapping the RNAP energy matrix to the spurious binding site sequence. The index i corresponds to the position of the first base pair to which RNAP binds along the promoter. 0 is at the start of the promoter sequence; k is at the canonical RNAP binding site; n = 160−lp is the index of the most downstream binding site where the promoter is assumed to be 160 base pairs long and lp is the length of the RNAP binding site. (B) Information footprints of a promoter under the simple repression regulatory architecture with non-specific binding (top) and with a new functional binding site (bottom). The bottom plot is created by inserting the sequence “TAGAAT”, which is one letter away from the TATA-box sequence, at the -80 position.
Fig 14
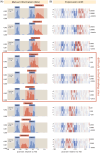
Fig 14. Changing the degree of overlap between the RNAP and repressor binding sites.
(A—B) Information footprints and expression shift matrices of a simple repression promoter with overlapping binding sites. The promoters are designed to maximize binding strength given the known energy matrices of the RNAP [52] and LacI [53]. The degree of overlap in the information footprints and expression shift matrices in each row is noted at the upper left hand corner of the footprints.
Fig 15
Fig 15. Building synthetic datasets with broken detailed balance.
(A) Changes in average mutual information at the RNAP and activator binding sites when the concentration of the activator ([A]) and the energy invested to break the detailed balance at the AP → A edge (UAP,A, defined in S11 Appendix) are changed. The sign of the value on the y-axis is based on the expression shift values calculated using Eq 9. Each data point is the mean of average mutual information across 20 synthetic datasets with the corresponding UAP,A and [A]. The numbered labels indicate datapoints for which the corresponding information footprints are shown in (B). (B) Information footprints built using the thermodynamic model and the graph-theoretic model. The second footprint is a graph-theoretic treatment of the equilibrium case.

Update of

Similar articles

Cited by

References

    1. Bartlett A, O’Malley RC, Huang SSC, Galli M, Nery JR, Gallavotti A, et al.. Mapping genome-wide transcription-factor binding sites using DAP-seq. Nat Protoc. 2017;12(8):1659–1672. doi: 10.1038/nprot.2017.055 - DOI - PMC - PubMed
    1. Trouillon J, Doubleday PF, Sauer U. Genomic footprinting uncovers global transcription factor responses to amino acids in Escherichia coli. Cell Syst. 2023;14(10):860–871.e4. doi: 10.1016/j.cels.2023.09.003 - DOI - PubMed
    1. Gao Y, Lim HG, Verkler H, Szubin R, Quach D, Rodionova I, et al.. Unraveling the functions of uncharacterized transcription factors in Escherichia coli using ChIP-exo. Nucleic Acids Res. 2021;49(17):9696–9710. doi: 10.1093/nar/gkab735 - DOI - PMC - PubMed
    1. Mundade R, Ozer HG, Wei H, Prabhu L, Lu T. Role of ChIP-seq in the discovery of transcription factor binding sites, differential gene regulation mechanism, epigenetic marks and beyond. Cell Cycle. 2014;13(18):2847–2852. doi: 10.4161/15384101.2014.949201 - DOI - PMC - PubMed
    1. Bulyk ML. Computational prediction of transcription-factor binding site locations. Genome Biol. 2003;5(1):201. doi: 10.1186/gb-2003-5-1-201 - DOI - PMC - PubMed

MeSH terms

Substances

LinkOut - more resources