. 2024 Dec 26;19(12):e0316362.
doi: 10.1371/journal.pone.0316362. eCollection 2024.

Butyric acid alleviates LPS-induced intestinal mucosal barrier damage by inhibiting the RhoA/ROCK2/MLCK signaling pathway in Caco2 cells

Affiliations

Butyric acid alleviates LPS-induced intestinal mucosal barrier damage by inhibiting the RhoA/ROCK2/MLCK signaling pathway in Caco2 cells

Luqiong Liu et al. PLoS One. .

Abstract

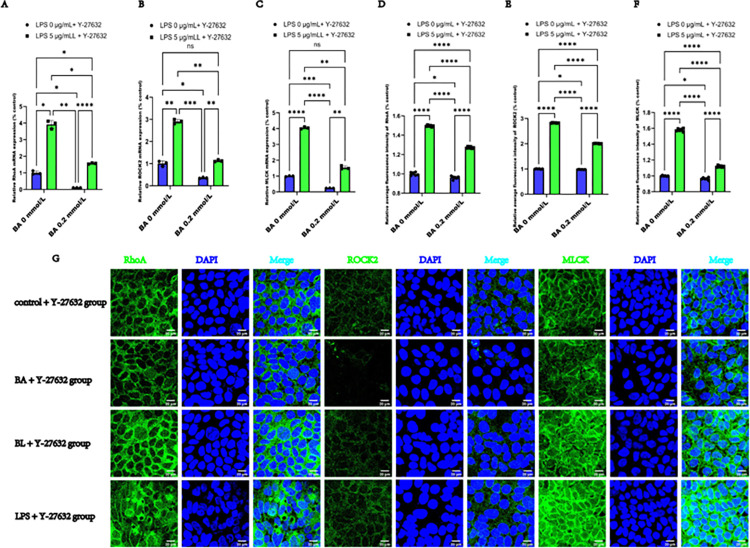
Butyric acid (BA) can potentially enhance the function of the intestinal barrier. However, the mechanisms by which BA protects the intestinal mucosal barrier remain to be elucidated. Given that the Ras homolog gene family, member A (RhoA)/Rho-associated kinase 2 (ROCK2)/Myosin light chain kinase (MLCK) signaling pathway is crucial for maintaining the permeability of the intestinal epithelium, we further investigated whether BA exerts a protective effect on epithelial barrier function by inhibiting this pathway in LPS-induced Caco2 cells. First, we aimed to identify the optimal treatment time and concentration for BA and Lipopolysaccharide (LPS) through a CCK-8 assay. We subsequently measured Trans-epithelial electrical resistance (TEER), FITC-Dextran 4 kDa (FD-4) flux, and the mRNA expression of ZO-1, Occludin, RhoA, ROCK2, and MLCK, along their protein expression levels, and average fluorescence intensity following immunofluorescence staining. We then applied the ROCK2 inhibitor Y-27632 and reevaluated the TEER, FD-4 flux, and mRNA, and protein expression of ZO-1, Occludin, RhoA, ROCK2, and MLCK, as well as their distribution in Caco2 cells. The optimal treatment conditions were determined to be 0.2 mmol/L BA and 5 μg/mL LPS for 24 hours. Compared with LPS treatment alone, BA significantly mitigated the reduction in the TEER, decreased FD-4 flux permeability, increased the mRNA expression of ZO-1 and Occludin, and normalized the distribution of ZO-1 and Occludin in Caco2 cells. Furthermore, BA inhibited the expression of RhoA, ROCK2, and MLCK, and normalized their localization within Caco2 cells. Following treatment with Y-27632, the epithelial barrier function, along with the mRNA and protein expression and distribution of ZO-1 and Occludin were further normalized upon inhibition of the pathway. These findings contribute to a deeper understanding of the potential mechanisms through which BA attenuates LPS-induced impairment of the intestinal epithelial barrier.


Conflict of interest statement

The authors declare that they have no known competing financial interests or personal relationships that could have appeared to influence the work reported in this paper.

Figures

Fig 1
Fig 1. The optimal concentrations and treatment durations for BA and LPS in Caco2 cells.
(A) The viability of Caco2 cells was assessed using the CCK8 assays after treatment with various concentrations of BA for 0 to 36 h. (B) Cell viability following treatment with different concentrations of LPS for 18 to 30 h was also evaluated using the CCK8 assay. (C) The viability of Caco2 cells was determined by the CCK8 assays following treatment with 0.2 mmol/L BA combined with different concentrations of LPS for 24 h. **** denotes < 0.0001.
Fig 2
Fig 2. BA attenuated the decrease in the integrity and increase in the permeability of the epithelial barrier injury induced by LPS in Caco2 cell monolayers.
(A) Changes in TEER with increasing culture time on days 1–22. (B) BA alleviated the LPS-induced decrease in TEER in Caco2 cells after treatment for 24 h. (C) BA alleviated the LPS-induced increase in FD-4 flux in Caco2 cells on day 22.
Fig 3
Fig 3. BA attenuated the decrease in the expression of ZO-1 and Occludin induced by LPS in Caco2 cells.
(A) Relative mRNA expression levels of ZO-1. (B) Relative mRNA expression levels of Occludin. (C) Average relative fluorescence intensity of ZO-1 in Caco2 cells. (D) Average relative fluorescence intensity of Occludin. (E) Representative images of immunofluorescence staining for labeling ZO-1 and Occludin (antibodies, green) and nuclei (DAPI, blue) (scale bar  =  20 μm). The values are expressed as the means ± SDs and were analyzed according to the variance of the factorial design. *, **, *** and **** denote p < 0.05, < 0.01, < 0.001 and < 0.0001, respectively; ns  =  not significant.
Fig 4
Fig 4. Inhibitory effects of BA on the RhoA/ROCK2/MLCK signaling pathway in LPS-induced Caco2 cells.
(A) Relative mRNA expression of RhoA following exposure to LPS and BA in Caco2 cells. (B) Relative mRNA expression of ROCK2. (C) Relative mRNA expression of MLCK. (D) Average relative immunofluorescence intensity of RhoA after exposure to LPS and BA in Caco2 cells. (E) Average relative immunofluorescence intensity of ROCK2. (F) Average relative immunofluorescence intensity of MLCK in Caco2 cells after exposure to LPS and BA. (G) Representative images of immunofluorescence staining for RhoA, ROCK2, and MLCK (antibodies, green) and nuclei (DAPI, blue) (scale bar  =  20 μm). The values are expressed as the means ± SDs and were analyzed according to the variance of the factorial design. *, **, *** and **** denote p < 0.05, < 0.01, < 0.001 and< 0.0001, respectively.
Fig 5
Fig 5. Y-27632 collaborated with BA to attenuate the increase in the integrity and decrease in the permeability of epithelial barrier injury induced by LPS in Caco2 monolayers.
(A) Y-27632 collaborated with BA to attenuate the effect of LPS on TEER in Caco2 cells on days 1–22. (B) Y-27632 collaborated with BA to attenuate the effect of LPS on TEER in Caco2 cells on day 22. (C) Y-27632 collaborated with BA to alleviate the decrease in FD-4 flux in LPS-induced Caco2 cells on day 22. The values are expressed as the means ± SDs and were analyzed according to the variance of the factorial design. **, *** and ****denote p < 0.01, < 0.001 and < 0.0001, respectively; ns  =  not significant.
Fig 6
Fig 6. Y-27632 synergized with BA to alleviate the decrease in the expression of and abnormal localization of ZO-1 and Occludin in LPS-induced Caco2 cells.
(A) Relative mRNA expressions of the mRNA levels of ZO-1 after exposure to LPS, BA, and Y-27632 for 24 h. (B) Relative mRNA expressions of Occludin. (C) Average relative fluorescence intensity of ZO-1 in Caco2 cells exposed to LPS, BA, and Y-27632 for 24 h. (D) Average relative fluorescence intensity of Occludin. (E) Representative images of immunofluorescence staining by labeling ZO-1 and Occludin (antibodies, green) and nuclei (DAPI, blue) (scale bar  =  20 μm) in Caco2 cells exposed to LPS, BA, and Y-27632 for 24 h. The values are expressed as the means ± SDs and were analyzed by variance of factorial design. *, **, *** and **** denote p < 0.05, < 0.01, < 0.001 and < 0.0001, respectively; ns  =  not significant.
Fig 7
Fig 7. Y-27632 synergized with BA to inhibit the RhoA/ROCK2/MLCK signaling pathway in LPS-induced Caco2 cells.
(A) Relative mRNA expressions of RhoA after exposure to LPS, BA, and Y-27632 in Caco2 cells for 24 h. (B) Relative mRNA expressions of ROCK2. (C) Relative mRNA expressions of MLCK. (D) Average relative immunofluorescence intensity of RhoA in Caco2 cells after exposure to LPS, BA, and Y-27632 for 24 h. (E) Average relative immunofluorescence intensity of ROCK2. (F) Average relative immunofluorescence intensity of MLCK. (G) Representative images of immunofluorescence staining by labeling RhoA, ROCK2, and MLCK (antibodies, green) and nuclei (DAPI, green) (scale bar  =  20 μm) in Caco2 cells after exposure to LPS, BA, and Y-27632 for 24 h The values are expressed as the means ± SDs and were analyzed according to the variance of the factorial design. *, **, *** and **** denote p < 0.05, < 0.01, < 0.001 and < 0.0001, respectively; ns  =  not significant.

Similar articles

Cited by

References

    1. Odenwald MA, Turner JR. The intestinal epithelial barrier: a therapeutic target? Nat Rev Gastroenterol Hepatol. 2017;14(1):9–21. doi: 10.1038/nrgastro.2016.169 - DOI - PMC - PubMed
    1. Celebi Sözener Z, Cevhertas L, Nadeau K, Akdis M, Akdis CA. Environmental factors in epithelial barrier dysfunction. J Allergy Clin Immunol. 2020;145(6):1517–1528. doi: 10.1016/j.jaci.2020.04.024 - DOI - PubMed
    1. Zmora N, Suez J, Elinav E. You are what you eat: diet, health and the gut microbiota. Nat Rev Gastroenterol Hepatol. 2019;16(1):35–56. doi: 10.1038/s41575-018-0061-2 - DOI - PubMed
    1. Gasaly N, de Vos P, Hermoso MA. Impact of Bacterial Metabolites on Gut Barrier Function and Host Immunity: A Focus on Bacterial Metabolism and Its Relevance for Intestinal Inflammation. Front Immunol. 2021;12:658354. doi: 10.3389/fimmu.2021.658354 - DOI - PMC - PubMed
    1. Martin-Gallausiaux C, Marinelli L, Blottière HM, Larraufie P, Lapaque N. SCFA: mechanisms and functional importance in the gut. Proc Nutr Soc. 2021;80(1):37–49. doi: 10.1017/S0029665120006916 - DOI - PubMed

MeSH terms

LinkOut - more resources