. 2024 Dec 26;20(12):e1012685.
doi: 10.1371/journal.pcbi.1012685. eCollection 2024 Dec.

Computational Analysis of MDR1 Variants Predicts Effect on Cancer Cells via their Effect on mRNA Folding

Affiliations

Computational Analysis of MDR1 Variants Predicts Effect on Cancer Cells via their Effect on mRNA Folding

Tal Gutman et al. PLoS Comput Biol. .

Abstract

The P-glycoprotein efflux pump, encoded by the MDR1 gene, is an ATP-driven transporter capable of expelling a diverse array of compounds from cells. Overexpression of this protein is implicated in the multi-drug resistant phenotype observed in various cancers. Numerous studies have attempted to decipher the impact of genetic variants within MDR1 on P-glycoprotein expression, functional activity, and clinical outcomes in cancer patients. Among these, three specific single nucleotide polymorphisms-T1236C, T2677G, and T3435C - have been the focus of extensive research efforts, primarily through in vitro cell line models and clinical cohort analyses. However, the findings from these studies have been remarkably contradictory. In this study, we employ a computational, data-driven approach to systematically evaluate the effects of these three variants on principal stages of the gene expression process. Leveraging current knowledge of gene regulatory mechanisms, we elucidate potential mechanisms by which these variants could modulate P-glycoprotein levels and function. Our findings suggest that all three variants significantly change the mRNA folding in their vicinity. This change in mRNA structure is predicted to increase local translation elongation rates, but not to change the protein expression. Nonetheless, the increased translation rate near T3435C is predicted to affect the protein's co-translational folding trajectory in the region of the second ATP binding domain. This potentially impacts P-glycoprotein conformation and function. Our study demonstrates the value of computational approaches in elucidating the functional consequences of genetic variants. This framework provides new insights into the molecular mechanisms of MDR1 variants and their potential impact on cancer prognosis and treatment resistance. Furthermore, we introduce an approach which can be systematically applied to identify mutations potentially affecting mRNA folding in pathology. We demonstrate the utility of this approach on both ClinVar and TCGA and identify hundreds of disease related variants that modify mRNA folding at essential positions.


Conflict of interest statement

The authors have declared that no competing interests exist.

Figures

Fig 1
Fig 1. Comparison of MDR1 expression in TCGA patients with and without the studied variants.
a) T1236C, b) T2677G, c) T3435C. Red dots represent mean MDR1 expression in variant carriers. Violin plots show distribution of mean expression in 100,000 randomly sampled non-carrier groups. Sample sizes (n) for carrier and non-carrier groups are indicated below each plot.
Fig 2
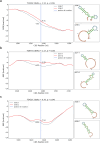
Fig 2. Impact of variants on MFE and mRNA secondary structure.
a) T1236C, b) T2677G, c) T3435C. Left: MFE profiles near variant sites. X-axis shows CDS position, Y-axis shows MFE score. Blue vertical line marks variant position. Grey curve: reference sequence MFE; Red curve: mutated sequence MFE. Right: Predicted mRNA secondary structures. Top: reference sequence; Bottom: mutated sequence. Color-coded nucleotides indicate structural elements: stems (green), junctions (red), interior loops (yellow), hairpin loops (blue). Variant position is outlined in red.
Fig 3
Fig 3. Impact of the three variants on CUB.
a) T1236C, b) T2677G, c) T3435C. The x-axis represents the amino acid position in the protein sequence, and the y-axis represents the CUB score (CAI/FPTC). The vertical line denotes the position of the variant. Light grey x’s mark the CUB scores near the variant, while the x marks on the vertical line represent the CUB score at the variant position, for the reference (dark grey) and mutated (red) codon. (d) Distribution of synonymous codon usage for each amino acid in the set of highly expressed genes. Codons before and after each variant are marked as "REF" and "MUT" respectively, colored in red (T1236C) or fuchsia (T3435C). (e) Distribution of all codons in the human genome, with bar colors indicating the amino acid encoded by the codon. Codons before and after each variant are marked as "REF" and "MUT" respectively, colored in red (T1236C), orange (T2677G), or fuchsia (T3435C).
Fig 4
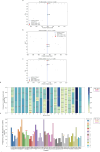
Fig 4. Impact of the three variants on tAI.
a) Changes in tAI caused by the three variants in tissues where MDR1 is highly expressed. Variants are shown in green for kidney renal clear cells (KIRC), yellow for liver hepatocytes (LIHC), purple for astrocytes (GBM), and red for epithelial colon cells (COAD). b) Change in tAI caused by T2677G in epithelial colon cells. The vertical blue line indicates the position of the variant. The tAI scores of the original and mutated codon are shown with dark grey and red x marks, respectively, while light grey x marks indicate the tAI scores of the surrounding codons. c) tAI scores of all codons in human epithelial colon cells, with bar colors representing the amino acid encoded by each codon. Codons with or without each variant are marked as "REF" and "MUT" respectively, colored in red (T1236C), orange (T2677G), or fuchsia (T3435C).
Fig 5
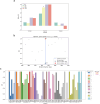
Fig 5. MDR1 translation simulation using the TASEP model.
a) Estimated elongation rates for each codon in the CDS of the reference and variant sequences (input of the model). Pink horizontal lines denote the percentiles. “x”s on the curves mark the positions of the variants. b) Density of each site (codon) at an arbitrary point in time for the reference and variant sequences. c) Protein production rates for different initialization rates. Each subplot depicts the reference sequence vs. one of the variant sequences. P-values were computed using Wilcoxon rank sum test.
Fig 6
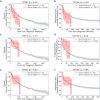
Fig 6. Impact of the three variants on patient survival.
a-b) T1236C; c-d) T2677G; e-f) T3435C. Left column: overall survival. Right column: progression-free survival. Comparison of the Kaplan-Meier survival curves of the variant positive group (red) and the variant negative group (gray).
Fig 7
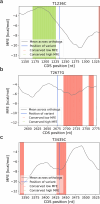
Fig 7. Conserved regions with extreme MFE near the three variants.
a) T1236C, b) T2677G, c) T3435C. The x-axis denotes the nucleotide position within the CDS of the MDR1 gene, while the y-axis shows the MFE score, which serves as a proxy for translation rate in this model. The grey curve represents the average MFE score of the MDR1 CDS across 383 orthologs. Green horizontal lines highlight positions with conserved high MFE across different organisms, whereas red horizontal lines indicate positions with conserved low MFE across these organisms.
Fig 8
Fig 8. An Illustration of the second ATP binding domain of MDR1 and its translation.
a) An illustration of the structure of the second ATP binding domain of MDR1. The domain has a structure of a P-loop NTPase fold, containing seven conserved motifs, shown in dark blue. The location of the T3435C variant is shown in red and the rest of the domain is depicted in grey. The distances between T3435C and the Q-loop and Walker-A motifs are also noted. b) An illustration of the translation of the second ATP binding domain. The emerging of the Walker-A motif from the exit tunnel is simultaneous with the decoding of the variant codon, possibly affecting the folding of the motif. The small and large ribosomal subunits are depicted in shades of light blue; The position of the variant (3435) in the mRNA sequence is highlighted in red, while the motifs are shown in dark blue and the remaining mRNA sequence in grey. The tRNA is illustrated in purple. Amino acids within the motifs are colored dark blue, and other amino acids are shown in grey.
Fig 9
Fig 9. Validation of MFE z-scores using ClinVar and TCGA.
a) ClinVar variants grouped by z-scores. The z-score indicates how extreme is the MFE at the variant position. The y- axis denotes the groups, “All” being all ClinVar variants and “>99.9” being the 0.1% of variants with the highest z-score. The x-axis denotes the percent of pathogenic variants in the group. Altogether, variants located at positions with more extreme z-scores show a higher likelihood of being pathogenic. b) TCGA variants grouped by z-scores. The z-score indicates how extreme is the MFE at the variant position. The y- axis denotes the groups, “All” being all ClinVar variants and “>99.9” being the 0.1% of variants with the highest z-score. The x-axis denotes the percent of variants that are polymorphisms that can be found in the 1000 genomes database. Variants located at positions with more extreme z-scores show a lower likelihood of being prevalent in the general population.
Fig 10
Fig 10. Meta-data of potentially CTF-modifying variants in TCGA.
a) Distribution of MFE z-scores in the positions where the variants reside. b) Distribution of the change in MFE caused by the variants. c) Distribution of variants’ distance from a structural domain. d) Frequency of top 20 variants in their most prevalent cancer type. UVM–Uveal Melanoma, LUSC–Lung Squamous Cell Carcinoma, GBM—Glioblastoma, DLBC–Lymphoid Neoplasm Diffuse Large B-cell Lymphoma, SARC—Sarcoma, MESO–Mesothelioma. e) Enrichment of cancerous genes among the genes with potential CTF modifying variants. The outer ring refers to all human protein coding genes with variants on TCGA while the inner ring refers to genes in which we found potential CTF modifying variants in TCGA. Red represents genes known to be related to cancer (TSGs and oncogenes) while blue represents genes not currently associated with cancer. The significance of the enrichment is calculated using a hyper-geometric p-value.
Fig 11
Fig 11. Examples for potentially CTF modifying pathogenic variants.
a) Illustration of SMC1A function. Interact with SMC3 and other proteins to create the cohesin complex and trap sister chromatids within it. SMC1A and SMC3 interact through the hinge domain of both proteins. b) G1923A resided in a region of conserved low MFE. Description of the graph is the same as in Fig 7. c) G1923A caused a significant increase in local MFE in its vicinity. Description of the graph is the same as in Fig 2. d) Structural domains of SMC1A. The ATP binding domains and the hinge domain are depicted in blue, the variant in red and the rest of the residues in grey. e) Illustration of RBFOX2 function. RBFOX2 modulates splicing according to its binding location relative to the exons of the pre-mRNA. In the top part of the figure all three exons are included in the processed mRNA. In the bottom part, the middle exon is skipped. f) C732A resided in a region of conserved low MFE. g) C732A caused a significant increase in local MFE in its vicinity. h) Structural domains of RBFOX2. The nucleotide binding domain is depicted in blue, the variant in red and the rest of the residues in grey.

Similar articles

References

    1. Juliano RL, Ling V. A surface glycoprotein modulating drug permeability in Chinese hamster ovary cell mutants. BBA—Biomembranes. 1976;455(1):152–62. doi: 10.1016/0005-2736(76)90160-7 - DOI - PubMed
    1. Li Y1, Yuan H1, Yang K1, Xu W1, Tang W2, Li and X. The structure and functions of P-Glycoprotein. Curr Med Chem. 2010;17:786–800. doi: 10.2174/092986710790514507 - DOI - PubMed
    1. Allikmets R, Gerrard B, Hutchinson A, Dean M. Characterization of the human ABC superfamily: isolation and mapping of 21 new genes using the expressed sequence tags database. Hum Mol Genet. 1996. Oct;5(10):1649–55. doi: 10.1093/hmg/5.10.1649 - DOI - PubMed
    1. Sakaeda T, Nakamura T, Okumura K. MDR1 genotype-related pharmacokinetics and pharmacodynamics. Biol Pharm Bull. 2002;25(11):1391–400. doi: 10.1248/bpb.25.1391 - DOI - PubMed
    1. Thiebaut F, Tsuruo T, Hamada H, Gottesman MM, Pastan I, Willingham MC. Cellular localization of the multidrug-resistance gene product P-glycoprotein in normal human tissues. Proc Natl Acad Sci U S A. 1987;84(21):7735–8. doi: 10.1073/pnas.84.21.7735 - DOI - PMC - PubMed

MeSH terms

Substances