

Optimizing RNA extraction methods for high-throughput transcriptome sequencing of formalin-fixed paraffin-embedded cardiac tissue specimens
- PMID: 39724161
- PMCID: PMC11670944
- DOI: 10.1371/journal.pone.0315098
Optimizing RNA extraction methods for high-throughput transcriptome sequencing of formalin-fixed paraffin-embedded cardiac tissue specimens
Abstract
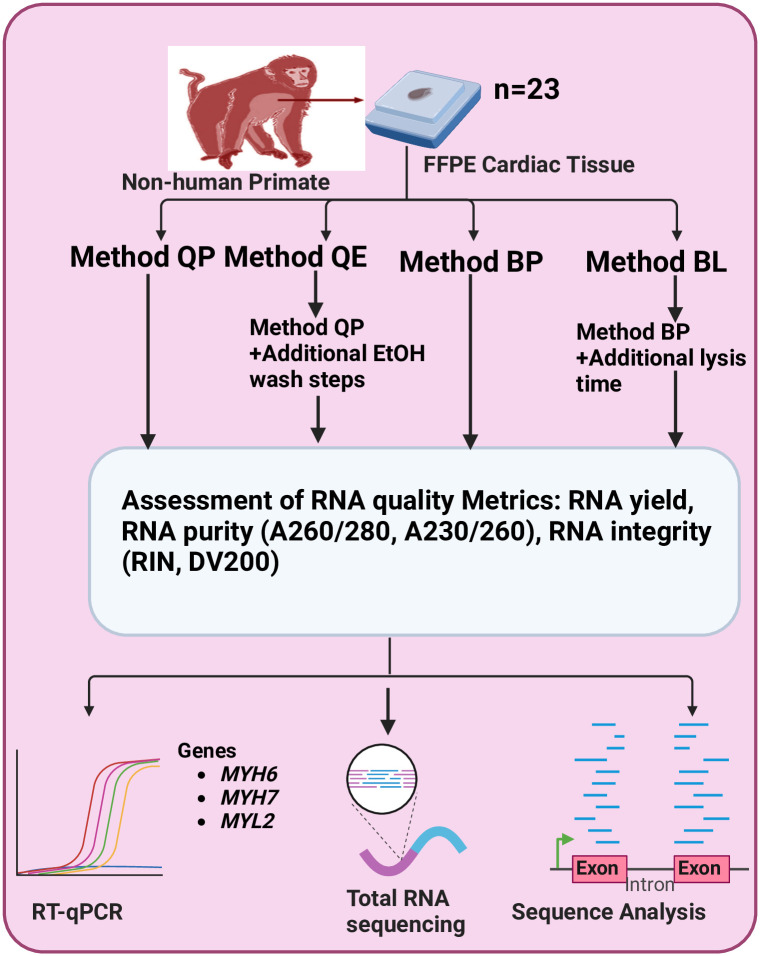
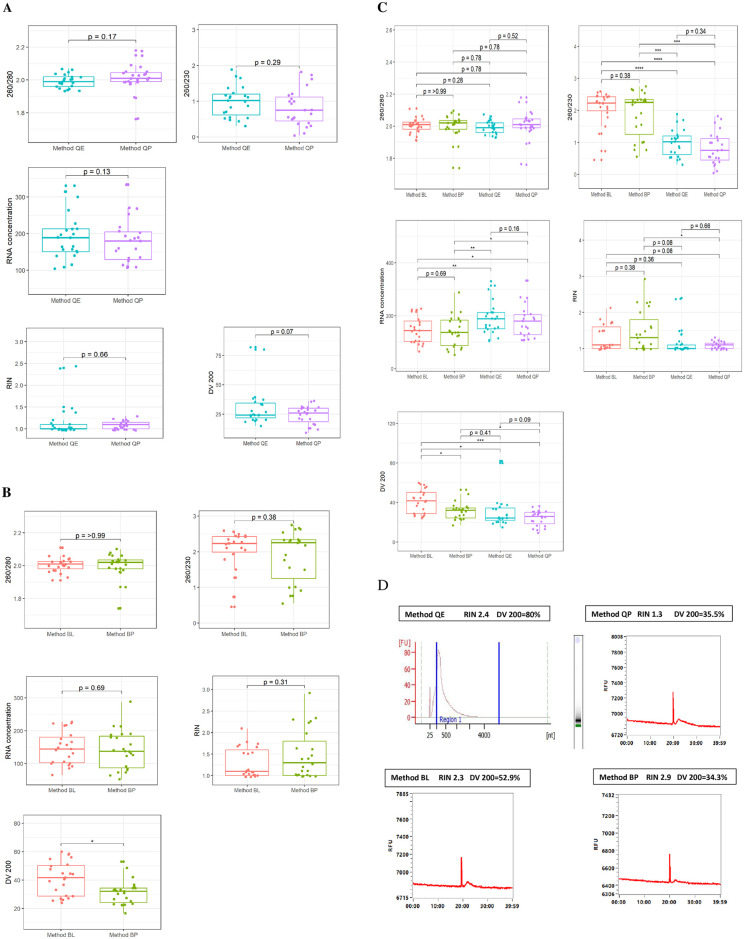
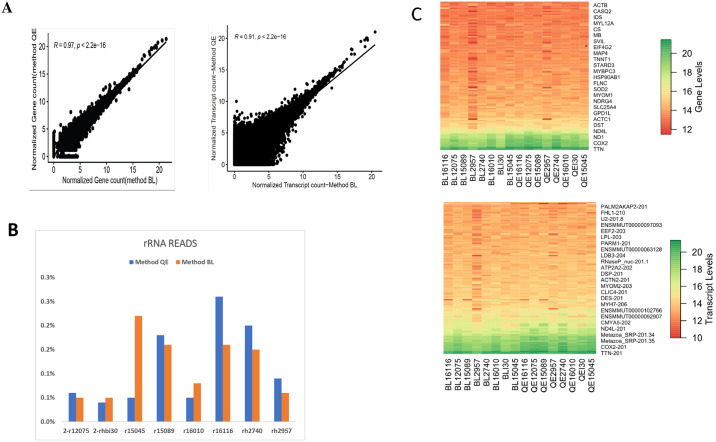
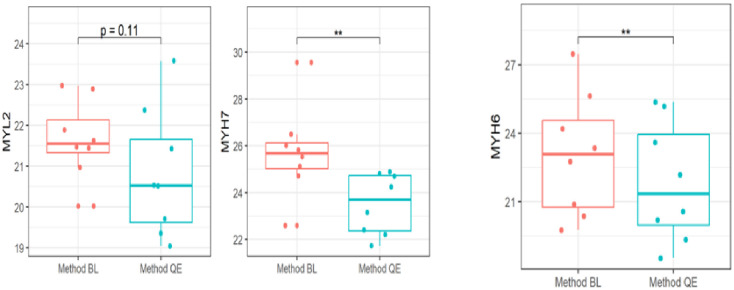
Archived FFPE cardiac tissue specimens are valuable for molecular studies aimed at identifying biomarkers linked to mortality in cardiovascular disease. Establishing a reliable and reproducible RNA extraction method is critical for generating high-quality transcriptome sequences for molecular assays. Here, the efficiency of four RNA extraction methods: Qiagen AllPrep DNA/RNA method (Method QP); Qiagen AllPrep DNA/RNA method with protocol modification on the ethanol wash step after deparaffinization (Method QE); CELLDATA RNA extraction (Method BP) and CELLDATA RNA extraction with protocol modifications on the lysis step (Method BL) was compared on 23 matching FFPE cardiac tissue specimens (n = 92).In comparing RNA quality metrics across FFPE RNA extract, nucleic acids extracted deploying Method QE and QP produced the highest RNA yield. However, Method QE outperformed Method QP as more extract from Method QE had DV 200 values above 30%. Both method BL and BP produced similar range of RNA purity and yield but more extract from Method BL had DV 200 values above 30% compared to Method BP. When accessing distribution value, Method BL outperformed Methods BP, QE, and QP as more extracts from Method BL had DV 200 values above 30% compared to other methods (PDV200<0.001; Kruskal-Wallis). Method QE outperformed other methods in terms of RNA yield. RNA extracts from Method QE, characterized by high RNA yield, achieved sequencing results comparable to those from Method BL, characterized by high DV200 values. Our findings reveal that optimizing protocols can yield higher-quality RNA, facilitating the exploration of more disease conditions with high-resolution transcriptome profiling.
Copyright: © 2024 Odogwu et al. This is an open access article distributed under the terms of the Creative Commons Attribution License, which permits unrestricted use, distribution, and reproduction in any medium, provided the original author and source are credited.
Conflict of interest statement
The author(s) declare no competing interests or other interests that might be perceived to influence the results and/or discussion reported in this paper.
Figures
Similar articles
-
Effective DNA/RNA co-extraction for analysis of microRNAs, mRNAs, and genomic DNA from formalin-fixed paraffin-embedded specimens.PLoS One. 2012;7(4):e34683. doi: 10.1371/journal.pone.0034683. Epub 2012 Apr 13. PLoS One. 2012. PMID: 22514653 Free PMC article.
-
Extraction, Purification, and Next-Generation Sequencing (NGS) Analysis of DNA and RNA from Formalin-Fixed and Paraffin-Embedded (FFPE) Tissue.Methods Mol Biol. 2025;2866:207-227. doi: 10.1007/978-1-0716-4192-7_12. Methods Mol Biol. 2025. PMID: 39546205
-
Results and lessons from dual extraction of DNA and RNA from formalin-fixed paraffin-embedded breast tumor tissues for a large Cancer epidemiologic study.BMC Genomics. 2022 Aug 25;23(1):614. doi: 10.1186/s12864-022-08837-6. BMC Genomics. 2022. PMID: 36008758 Free PMC article.
-
Systematic review and feasibility study on pre-analytical factors and genomic analyses on archival formalin-fixed paraffin-embedded breast cancer tissue.Sci Rep. 2024 Aug 6;14(1):18275. doi: 10.1038/s41598-024-69285-8. Sci Rep. 2024. PMID: 39107471 Free PMC article.
-
Detection of alpha human papillomaviruses in archival formalin-fixed, paraffin-embedded (FFPE) tissue specimens.J Clin Virol. 2016 Mar;76 Suppl 1:S88-S97. doi: 10.1016/j.jcv.2015.10.007. Epub 2015 Oct 22. J Clin Virol. 2016. PMID: 26514313 Review.
References
-
- World Health Organization. (n.d.). Cardiovascular diseases (CVDs). https://www.who.int/news-room/fact-sheets/detail/cardiovascular-diseases...
MeSH terms
Substances
LinkOut - more resources
Full Text Sources
Molecular Biology Databases
