. 2024 Dec 26;214(1):4.
doi: 10.1007/s00430-024-00813-z.

Deciphering long-term immune effects of HIV-1/SARS-CoV-2 co-infection: a longitudinal study

Affiliations

Deciphering long-term immune effects of HIV-1/SARS-CoV-2 co-infection: a longitudinal study

Elena Vazquez-Alejo et al. Med Microbiol Immunol. .

Erratum in

Abstract

Introduction: While the general immune response to Severe Acute Respiratory Syndrome-Coronavirus-2 (SARS-CoV-2) is well-understood, the long-term effects of Human Immunodeficiency Virus-1/Severe Acute Respiratory Syndrome-Coronavirus-2 (HIV-1/SARS-CoV-2) co-infection on the immune system remain unclear. This study investigates the immune response in people with HIV-1 (PWH) co-infected with SARS-CoV-2 to understand its long-term health consequences.

Methods: A retrospective longitudinal study of PWH with suppressed viral load and SARS-CoV-2 infection was conducted. Cryopreserved peripheral blood mononuclear cells and plasma samples were collected at three time-points: HIV-1/pre-SARS-CoV-2 (n = 18), HIV-1/SARS-CoV-2 (n = 46), and HIV-1/post-SARS-CoV-2 (n = 36). Plasma levels of 25 soluble cytokines and chemokines, and anti-S/anti-N-IgG-SARS-CoV-2 antibodies were measured. Immunophenotyping of innate and adaptive immune components and HIV-1 and SARS-CoV-2-specific T/B-cell responses were assessed by flow cytometry.

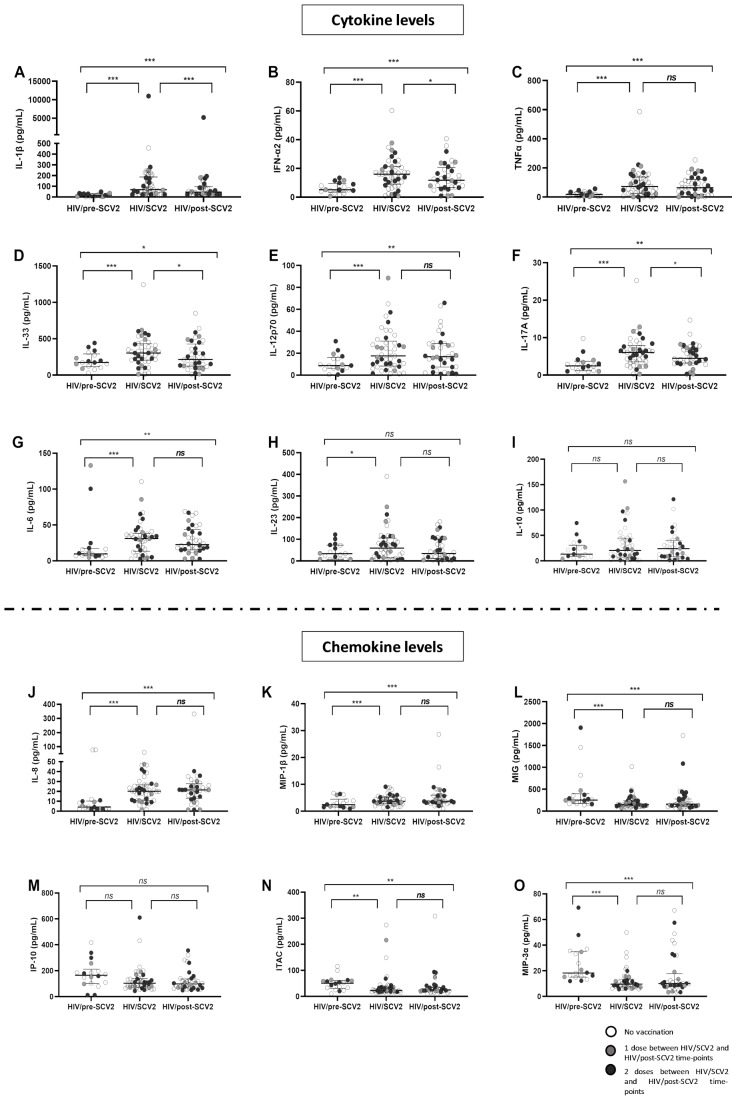
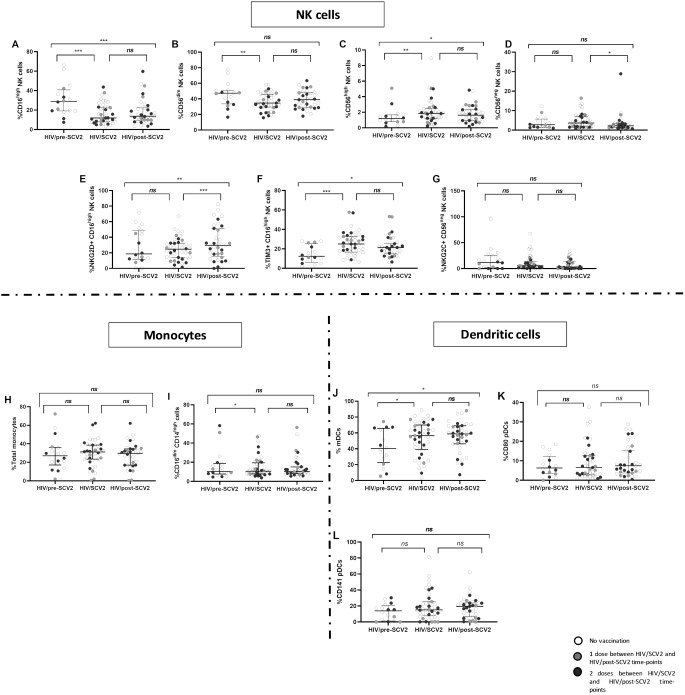
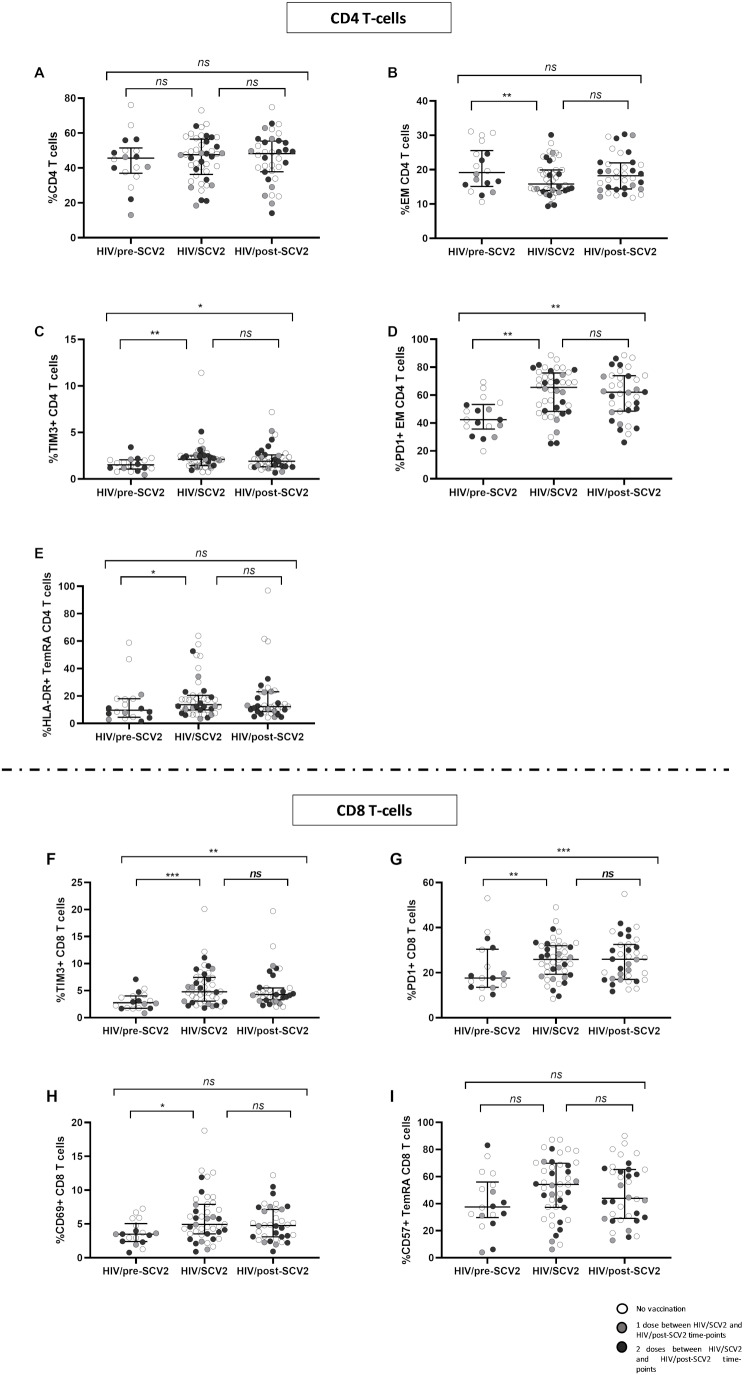
Results: HIV-1/SARS-CoV-2 co-infection was associated with long-lasting immune dysfunction, characterized by elevated levels of pro-inflammatory cytokines and a decrease in the MIG-IP10-ITAC chemokine axis at the HIV/SARS-CoV-2 time-point, which persisted one year later. Additionally, alterations in the distribution of subsets and increased activation (NKG2D/NKG2C) and maturation (TIM3) markers of NK and dendritic cells were observed at the HIV-1/SARS-CoV-2 time-point, persisting throughout the study. Effector memory CD4 T-cell subsets were decreased, while exhaustion/senescence (PD1/TIM3/CD57) markers were elevated at all three time-points. SARS-CoV-2-specific T/B-cell responses remained stable throughout the study, while HIV-1-specific T-cell responses decreased at the HIV-1/SARS-CoV-2 time-point and remained so.

Conclusions: Persistent immune dysfunction in HIV-1/SARS-CoV-2 co-infection increases the risk of future complications, even in PWH with mild symptoms. Exacerbated inflammation and alterations in immune cells may contribute to reduce vaccine efficacy and potential reinfections.

Keywords: Dysregulated immune profile; HIV-1; HIV-1 immunovirological parameters; Longitudinal analysis; SARS-CoV-2; SARS-CoV-2-specific T/B-cell responses.


Conflict of interest statement

Declarations. Consent for publication: Not applicable. Competing interests: The authors declare no competing interests.

Figures

Fig. 1
Fig. 1
Soluble pro and anti-inflammatory cytokine and chemokine levels in plasma. Longitudinal analysis in HIV/pre-SCV2 (n = 18), HIV/SCV2 (n = 46) and HIV/post-SCV2 (n = 36) time-points of IL-1β, IFN-α2, TNF-α, IL-33, IL-12p70, IL-17A, IL-6, IL-23, and IL-10 cytokine levels (A-I). IL-8, MIP-1β, MIG, IP-10, ITAC and MIP-3α chemokine levels (J-O). Six subjects (who received 1 vaccine doses between HIV/SCV2 and HIV/post-SCV2 time-points) are highlighted in light grey, thirteen subjects (who received 2 vaccine doses between HIV/SCV2 and HIV/post-SCV2 time-points) are highlighted in dark grey and twenty-seven subjects (who did not receive any vaccine doses between HIV/SCV2 and HIV/post-SCV2 time-points) are represented in white. Lines represent medians and interquartile ranges. A mixed linear model was used to follow participants individually throughout the three time-points of the study. ***≤0.001, **p ≤ 0.01, *p < 0.05, ns ≥ 0.05
Fig. 2
Fig. 2
Frequency of NK, monocyte and dendritic cell subsets, and activation and maturation markers expression. Longitudinal analysis in HIV/pre-SCV2 (n = 18), HIV/SCV2 (n = 46) and HIV/post-SCV2 (n = 36) time-points. Frequency of CD16high, CD56dim, CD56high and CD56neg NK cell subsets; NKG2D, TIM3 and NKG2C expression in CD16high and CD56neg NK cell subsets, respectively (A-G). Distribution of total monocytes and CD16dimCD14high monocytes subset (H, I). Frequency of myeloid dendritic cells (mDCs) and CD80 and CD141 expression in plasmacytoid dendritic cells (pDCs) (J-L). Six subjects (who received 1 vaccine doses between HIV/SCV2 and HIV/post-SCV2 time-points) are highlighted in light grey, thirteen subjects (who received 2 vaccine doses between HIV/SCV2 and HIV/post-SCV2 time-points) are highlighted in dark grey and twenty-seven subjects (who did not receive any vaccine doses between HIV/SCV2 and HIV/post-SCV2 time-points) are represented in white. Lines represent medians and interquartile ranges. A mixed linear model was used to follow participants individually throughout the three time-points of the study. ***≤0.001, **p ≤ 0.01, *p < 0.05, ns ≥ 0.05
Fig. 3
Fig. 3
Frequency of CD4 and CD8 T-cells and exhaustion, activation and senescence markers expression. Longitudinal analysis in HIV/pre-SCV2 (n = 18), HIV/SCV2 (n = 46) and HIV/post-SCV2 (n = 36) time-points. Differences in total and Effector Memory (EM) CD4 T-cell subsets distribution; TIM3 expression in total CD4 T-cells; PD1 expression in EM CD4 T-cells; HLA-DR expression in Terminally Differentiated (TemRA) CD4 T-cells (A-E). TIM3, PD1 and CD69 expression in total CD8 T-cells; CD57 expression in TemRA CD8 T-cells (F-I). Six subjects (who received 1 vaccine doses between HIV/SCV2 and HIV/post-SCV2 time-points) are highlighted in light grey, thirteen subjects (who received 2 vaccine doses between HIV/SCV2 and HIV/post-SCV2 time-points) are highlighted in dark grey and twenty-seven subjects (who did not receive any vaccine doses between HIV/SCV2 and HIV/post-SCV2 time-points) are represented in white. Lines represent medians and interquartile ranges. A mixed linear model was used to follow participants individually throughout the three time-points of the study. ***≤0.001, **p ≤ 0.01, *p < 0.05, ns ≥ 0.05
Fig. 4
Fig. 4
HIV-1 and SARS-CoV-2-specific CD4 and CD8 T cell response, SARS-CoV-2-spike-specific B cell response and correlations between SARS-CoV-2 T/B-cell responses at the HIV/SCV2 time-point and Anti-S-IgG-SARS-CoV-2 plasma levels at the HIV/post-SCV2 time-point. Longitudinal analysis of HIV-1-specific T-cell responses in HIV/pre-SCV2 (n = 18), HIV/SCV2 (n = 46) and HIV/post-SCV2 (n = 36) time-points. Longitudinal analysis in HIV/SCV2 (n = 46) and HIV/post-SCV2 (n = 36) time-points of SARS-CoV-2-specific T-cell response. Frequency of the specific Effector Memory (EM) CD4 T-cells subset and the Terminally Differentiated Memory (TemRA) CD8 T-cells subset response against HIV-1 and SARS-CoV-2, respectively (A-D). Longitudinal analysis in HIV/SCV2 (n = 23) and HIV/post-SCV2 (n = 23) time-points of SARS-CoV-2-specific B-cell response. Proportion of SARS-CoV-2-spike specific B cells and immunoglobulins IgG, IgA and IgM (E-H). Associations between SARS-CoV-2-specific CD4 T-cells and Central Memory (CM) CD8 T-cells subset and Anti-S-IgG-SARS-CoV-2 plasma levels, respectively (n = 36); correlations between SARS-CoV-2-spike specific B-cells and Anti-S-IgG-SARS-CoV-2 plasma levels (n = 23) (I-K). Six subjects (who received 1 vaccine doses between HIV/SCV2 and HIV/post-SCV2 time-points) are highlighted in light grey, thirteen subjects (who received 2 vaccine doses between HIV/SCV2 and HIV/post-SCV2 time-points) are highlighted in dark grey and twenty-seven subjects (who did not receive any vaccine doses between HIV/SCV2 and HIV/post-SCV2 time-points) are represented in white. Lines represent medians and interquartile ranges. A mixed linear model was used to follow participants individually throughout the three time-points of the study. The Wilcoxon test was conducted to compare paired events and the Spearman ρ coefficient test was used to correlations analysis. ***≤0.001, **p ≤ 0.01, *p < 0.05, ns ≥ 0.05

References

    1. Harris TG, Rabkin M, El-Sadr WM (2018) Achieving the fourth 90: healthy aging for people living with HIV. AIDS 32:1563–1569. 10.1097/QAD.0000000000001870 - PMC - PubMed
    1. Fitzpatrick ME, Kunisaki KM, Morris A (2018) Pulmonary disease in HIV-infected adults in the era of antiretroviral therapy. AIDS 32:277–292. 10.1097/QAD.0000000000001712 - PMC - PubMed
    1. Silverberg MJ, Leyden W, Hernández-Ramírez RU et al (2021) Timing of Antiretroviral Therapy Initiation and Risk of Cancer Among Persons Living With Human Immunodeficiency Virus. Clin Infect Dis 72:1900–1909. 10.1093/cid/ciaa1046 - PMC - PubMed
    1. Dandachi D, Geiger G, Montgomery MW et al (2021) Characteristics, Comorbidities, and Outcomes in a Multicenter Registry of Patients With Human Immunodeficiency Virus and Coronavirus Disease 2019. Clin Infect Dis 73:e1964–e1972. 10.1093/cid/ciaa1339 - PMC - PubMed
    1. Hu J, Wang Y (2021) The Clinical Characteristics and Risk Factors of Severe COVID-19. Gerontology 67:255–266. 10.1159/000513400 - PMC - PubMed