

Sociodemographic Factors and Utilization of Pediatric Oncology Satellite Clinics in Ontario, Canada
- PMID: 39724373
- PMCID: PMC11672161
- DOI: 10.1001/jamanetworkopen.2024.52063
Sociodemographic Factors and Utilization of Pediatric Oncology Satellite Clinics in Ontario, Canada
Abstract
Importance: Pediatric cancer care services in high-income nations are mainly centralized in metropolitan cities. To allow treatments closer to home, patients across Ontario, Canada, a geographically large province, are offered decentralized care via satellite clinics; however, it is unclear whether the utilization of these pediatric oncology satellite clinics differs by area-level sociodemographic factors.
Objective: To examine whether sociodemographic factors, such as area-level income and rurality, are independently associated with the odds of satellite clinic visit and the hazards of time to first visit among pediatric oncology patients receiving cancer treatment.
Design, setting, and participants: This is a retrospective population-based cohort study of patients aged 0 to 17 years with cancer living in a satellite catchment area in Ontario, Canada (from 2015 to 2022, with follow-up through 2023). The Pediatric Oncology Group of Ontario Networked Information System cancer registry (containing age, sex, diagnosis type, and year information) was linked to satellite, OpenStreetMap, and postal-code databases to ascertain rural or urban dwelling, neighborhood-based income, and driving time saved.
Exposures: Age, sex, rural or urban dwelling, and neighborhood-level income quintiles.
Main outcomes and measures: The primary outcomes were the odds of satellite clinic attendance within 1 year of diagnosis and the hazards of first clinic visit after starting systemic therapy, derived from multivariable logistic and Cox proportional hazards models, respectively.
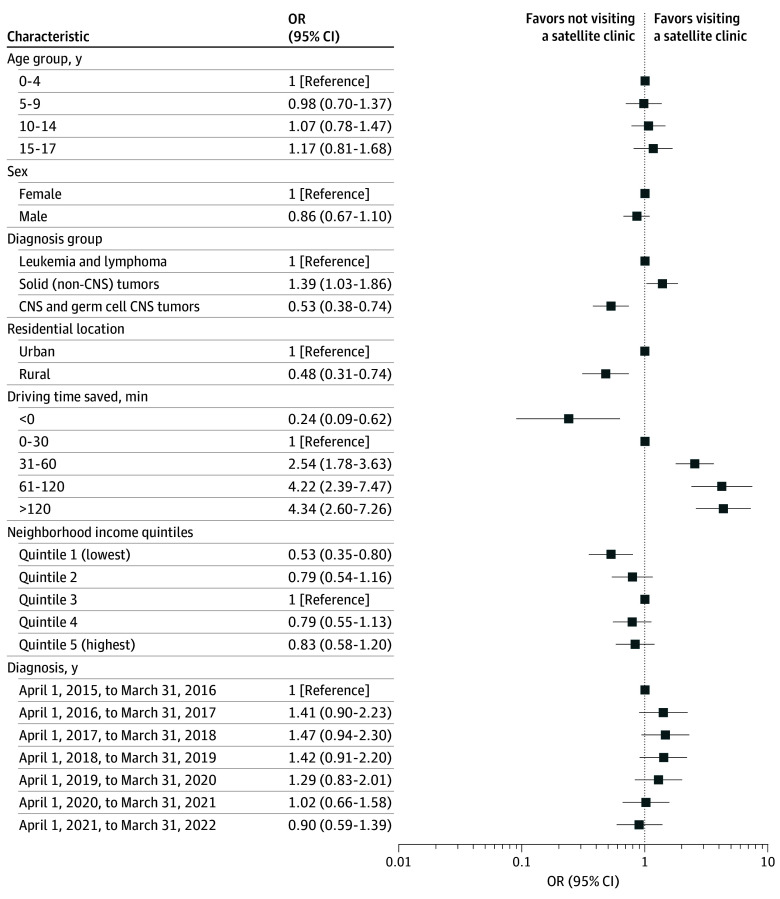
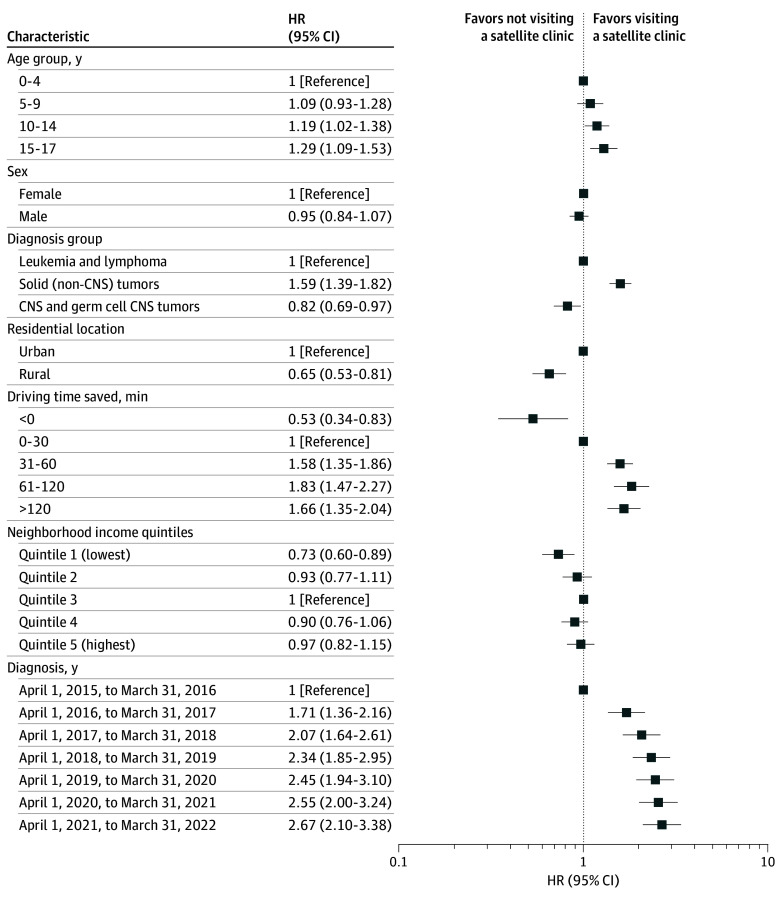
Results: Among the 1280 eligible patients (median [IQR] age, 7.0 [3.0-13.0] years; 753 male [58.8%]), 844 (65.9%) visited a satellite clinic within 1 year of diagnosis with a median (IQR) of 39 (14-67) days to first visit. Driving time saved (>60 minutes) was the factor most associated with satellite use, followed by diagnostic type (with patients with central nervous system tumors least likely to visit). Rural (vs urban) patients had significantly lower odds of satellite visit within a year of diagnosis (odds ratio, 0.48; 95% CI, 0.31-0.74; P = .001) and lower instantaneous likelihood of visiting after start of treatment (hazard ratio, 0.65; 95% CI, 0.53-0.81; P < .001). Living in a lower-income (vs middle-income) area was also associated with significantly lower utilization (odds ratio, 0.53; 95% CI, 0.35-0.80; P = .009; hazard ratio, 0.73; 95% CI, 0.60-0.89; P = .002).
Conclusions and relevance: This population-based study of pediatric oncology patients found that satellite clinics, despite being designed to reduce transportation and financial burdens, were disproportionately underutilized by patients living in rural and lower-income areas. Monitoring area-level social determinants of health can help inform interventions to improve timely and equitable access to childhood cancer care closer to home.
Conflict of interest statement
Figures
Similar articles
-
Comparison of Two Modern Survival Prediction Tools, SORG-MLA and METSSS, in Patients With Symptomatic Long-bone Metastases Who Underwent Local Treatment With Surgery Followed by Radiotherapy and With Radiotherapy Alone.Clin Orthop Relat Res. 2024 Dec 1;482(12):2193-2208. doi: 10.1097/CORR.0000000000003185. Epub 2024 Jul 23. Clin Orthop Relat Res. 2024. PMID: 39051924
-
Do Patients of Different Levels of Affluence Receive Different Care for Pediatric Osteosarcomas? One Institution's Experience.Clin Orthop Relat Res. 2025 Apr 1;483(4):748-758. doi: 10.1097/CORR.0000000000003299. Epub 2024 Oct 30. Clin Orthop Relat Res. 2025. PMID: 39485923
-
Home treatment for mental health problems: a systematic review.Health Technol Assess. 2001;5(15):1-139. doi: 10.3310/hta5150. Health Technol Assess. 2001. PMID: 11532236
-
Are Detailed, Patient-level Social Determinant of Health Factors Associated With Physical Function and Mental Health at Presentation Among New Patients With Orthopaedic Conditions?Clin Orthop Relat Res. 2023 May 1;481(5):912-921. doi: 10.1097/CORR.0000000000002446. Epub 2022 Oct 6. Clin Orthop Relat Res. 2023. PMID: 36201422 Free PMC article.
-
Signs and symptoms to determine if a patient presenting in primary care or hospital outpatient settings has COVID-19.Cochrane Database Syst Rev. 2022 May 20;5(5):CD013665. doi: 10.1002/14651858.CD013665.pub3. Cochrane Database Syst Rev. 2022. PMID: 35593186 Free PMC article.
References
-
- Centre for Surveillance and Applied Research, Public Health Agency of Canada . Cancer in young people in Canada data tool. 2024. Accessed May 1, 2024. https://health-infobase.canada.ca/data-tools/cypc/
-
- Pediatric Oncology Group of Ontario (POGO) . Childhood cancer in Ontario: the 2020 surveillance report. 2020. Accessed May 1, 2024. https://www.pogo.ca/research-data/data-reports/2020-pogo-surveillance-re...
-
- Statistics Canada . Census profile, 2021 census of population. Catalogue No. 98-316-X2021001. Published February 9, 2022. Updated November 15, 2023. Accessed May 1, 2024. https://www12.statcan.gc.ca/census-recensement/2021/dp-pd/prof/index.cfm...
-
- Government of Ontario . About Ontario. 2024. Accessed May 1, 2024. https://www.ontario.ca/page/about-ontario
-
- Statistics Canada . Canada’s population estimates: subprovincial areas, July 1, 2023. May 22, 2024. Accessed May 1, 2024. https://www150.statcan.gc.ca/n1/daily-quotidien/240522/dq240522b-eng.htm
Publication types
MeSH terms
LinkOut - more resources
Full Text Sources
Medical
