. 2025 Feb:60:101116.
doi: 10.1016/j.neo.2024.101116. Epub 2024 Dec 25.

High p16INK4A expression in glioblastoma is associated with senescence phenotype and better prognosis

Affiliations

High p16INK4A expression in glioblastoma is associated with senescence phenotype and better prognosis

Soon Sang Park et al. Neoplasia. 2025 Feb.

Abstract

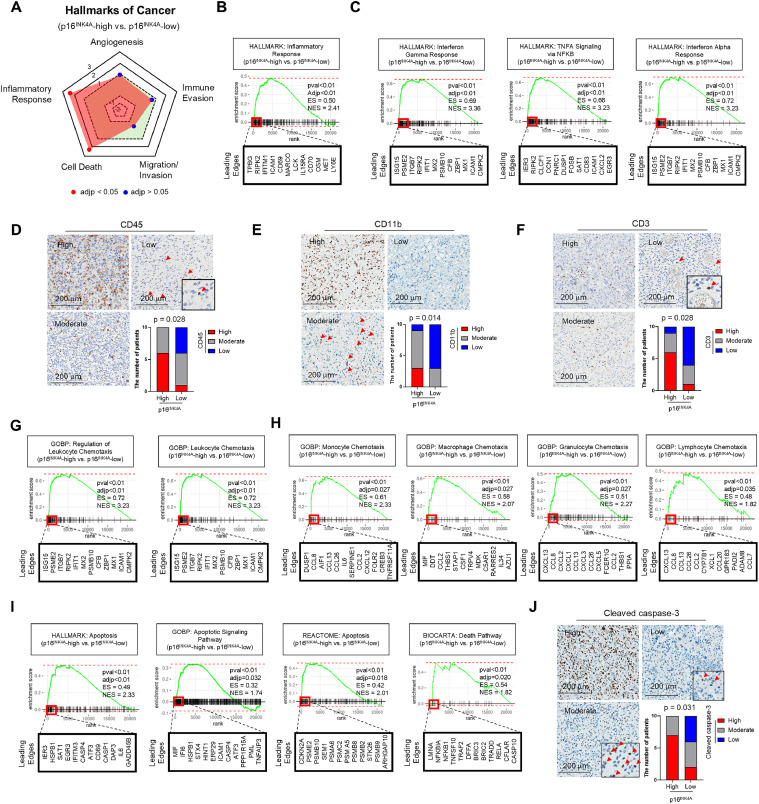
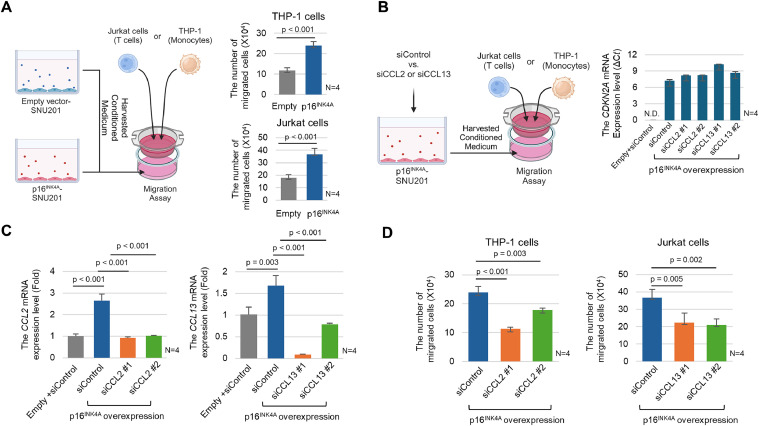
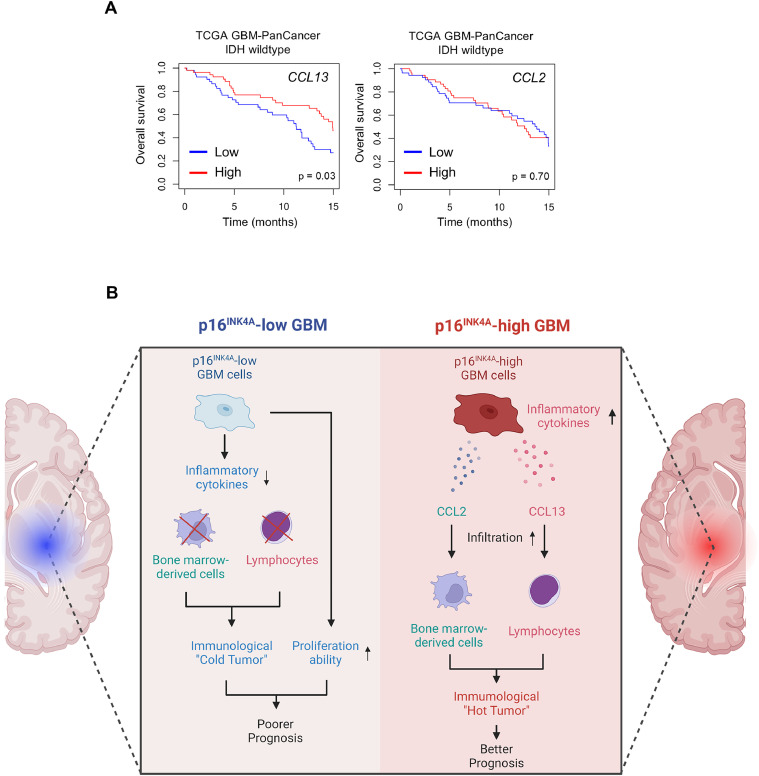
Glioblastoma, isocitrate dehydrogenase (IDH)-wildtype (GBM), is the most malignant brain tumor in adults, with limited therapeutic intervention. Previous studies have identified a few prognostic markers for GBM, including the methylation status of O6-methylguanine-DNA methyltransferase (MGMT) promoter, TERT promoter mutation, EGFR amplification, and CDKN2A/2B deletion. However, the classification of GBM remains incomplete, necessitating a comprehensive analysis. In this study, we investigated the impact of p16INK4A expression in GBM and found that p16INK4A-high GBM exhibits distinct characteristics compared to p16INK4A-low GBM. Specifically, tumor cells with p16INK4A-high expression display a senescent phenotype and are correlated with higher intra-tumoral immune cell infiltration. Furthermore, an association was observed between elevated p16INK4A expression in GBM and extended overall survival of patients. Our in vivo and in vitro studies revealed that CCL13 is predominantly expressed by p16INK4A-high GBM cells. The released CCL13 enhances the infiltration of T cells within the tumor, potentially contributing to the improved prognosis observed in patients with high p16INK4A expression. These findings suggest that tumor cells with a senescence phenotype in GBM, through the secretion of chemokines such as CCL13, may augment immune cell infiltration and potentially enhance patient outcomes by creating a more immunologically active tumor microenvironment.

Keywords: CCL13; GBM IDH-wildtype; Glioblastoma; Senescence; Senescent tumor cells.


Conflict of interest statement

Declaration of competing interest The authors declare that they have no known competing financial interests or personal relationships that could have appeared to influence the work reported in this paper.

Figures

Fig 1
Fig. 1
GBM with High p16INK4A Expression Related to Better Prognosis. A IHC analysis for p16INK4A was performed on GBM tissues. The upper and lower panels show p16INK4A-low and p16INK4A-high GBM, respectively. B p16INK4A IHC analysis (left panel) and SA-β-Gal staining (middle panel) were performed using adjacent sections of FFPE and fresh frozen tissues from the same patient. The right panel shows the statistics of the staining results. The p value is calculated using Chi-square test. C IHC analysis for αSMA (a marker for smooth muscle), CD68 (a marker for macrophage), and GFAP (a marker for astrocyte) (lower panels) was performed on serial sections of p16INK4A staining (upper panels) in p16INK4A-low GBM. D Kaplan-Meier Survival analysis was performed according to the iKPS. E Kaplan-Meier Survival analysis was performed according to CDKN2A status and the p16INK4A expression level. The p values in (D-E) are calculated using the Log-rank test.
Fig 2
Fig. 2
GBM with High p16INK4A Expression Exhibits Senescent Phenotype. A The heatmap analysis shows overall gene expression patterns of 11 different samples (N1-3: normal, H1-3: p16INK4A-high GBM, L1-5: p16INK4A-low GBM). B Principal component analysis (PCA) shows the variance among the three different sample groups: normal, p16INK4A-low GBM, and p16INK4A-high GBM. PC1: principal component 1; PC2: principal component 2. C Similarity analysis was performed using sample distances calculated by VST (N1-3: normal, H1-3: p16INK4A-high GBM, L1-5: p16INK4A-low GBM). D GSEA was performed using senescence-related gene sets. E GSEA was performed using a SASPs-related gene set. F GSEA was performed using a proliferation-related gene set. pval: p value; adjp: adjusted p value; ES: enrichment score; NES: normalized enrichment score. The p value and adjusted p value are calculated using statistics from ‘fgsea’ package from R.
Fig 3
Fig. 3
GBM with High p16INK4A Expression Exhibits Higher Immune Cell Infiltration and is Associated with Increased Cancer Cell Death. A The web chart shows the NES of GSEA results related to each hallmark of cancer. The gene sets used for analysis are shown in Table S1. B GSEA was performed using an inflammation-related gene set. C GSEA was performed using IFNγ, TNFα, and IFNα pathway-related gene sets. d-F IHC analysis for CD45, CD11b, and CD3 was performed in GBM cancer tissues. The red arrows indicate immunostained cells in the GBM. The lower right panels show the quantification data. The p value was calculated using the Chi-square test. G GSEA was performed using leukocyte chemotaxis-related gene sets. H GSEA was performed using monocyte, macrophage, granulocyte, and lymphocyte chemotaxis-related gene sets. I GSEA was performed using apoptosis and cell death-related gene sets. J IHC analysis for cleaved caspase-3 was performed in GBM tissues. The red arrows indicate immunostained cells in the GBM. The p value was calculated using the Chi-square test. The p value and adjusted p value from (B-C and G-I) are calculated using statistics from ‘fgsea’ package from R. pval: p value; adjp: adjusted p value; ES: enrichment score; NES: normalized enrichment score.
Fig 4
Fig. 4
In vitro Senescent GBM Model via p16INK4A Overexpression Exhibit Senescence Phenotype. A The protein (upper panel) and mRNA expression levels (lower panel) of p16INK4A (CDKN2A) in SNU201 after transduction with either an empty vector (Empty) or a p16INK4A-overexpression vector (p16INK4A) is shown. kDa: kilodalton. NC: non-transduced SNU201. B The morphology of SNU201 cells post-transduction is depicted in the left panel, with SA-β-Gal staining results in the middle panel and quantification data on the right. C-D Real-time PCR data for representative SASPs and chemokines in SNU201 cells transduced with either vector. E-F IHC analysis for CCL2 and CCL13 in GBM tissues, with quantification data in the lower right panel. Statistical differences in (A-D) were analyzed using Student's t-test while those in (E-F) were analyzed using the Chi-square test.
Fig 5
Fig. 5
The SASPs from Senescent GBM Cells Recruit Immune Cells in vitro. A The left panel shows a migration assay schematic, with quantification of migrated cells in the right panel (Empty: CM from empty vector-transduced SNU201; p16INK4A: CM from p16INK4A-overexpressed SNU201). B The left panel depicts a migration assay with siCCL2 or siCCL13 treatment in p16INK4A-overexpressing SNU201, while the right panel shows CDKN2A (p16INK4A) mRNA expression levels. I The mRNA expression levels of CCL2 and CCL13 are shown in the left and right panels, respectively. J The left panel shows the number of migrated THP-1 cells with siControl or siCCL2 in p16INK4A-overexpressed SNU201, and the right panel shows migrated Jurkat cells with siControl or siCCL13. Statistical differences in (A and C-D) were analyzed using Student's t-test. NC: non-treated control; Empty: empty vector-transduced cells; p16INK4A: p16INK4A-overexpression vector-transduced cells. All graphs present mean ± standard deviation.
Fig 6
Fig. 6
The CCL13 expression is related to prognosis of GBM in TCGA dataset. A The survival graphs of GBM based on CCL13 expression (left panel) and CCL2 expression (right panel) are derived from the TCGA GBM-PanCancer dataset. B The schematic image illustrates how the presence of p16INK4A-high GBM is linked to the tumor immune microenvironment and impacts patient prognosis.

References

    1. Schaff L.R., Mellinghoff I.K. Glioblastoma and other primary brain malignancies in adults: a review. JAMa. 2023;329:574–587. doi: 10.1001/jama.2023.0023. - DOI - PMC - PubMed
    1. Louis D.N., Perry A., Wesseling P., et al. The 2021 WHO classification of tumors of the central nervous system: a summary. Neuro Oncol. 2021;23:1231–1251. doi: 10.1093/neuonc/noab106. - DOI - PMC - PubMed
    1. WCoTE Board. Lyon: International Agency for Research on Cancer; 2021. WHO Classification of Tumours of the Central Nervous System.
    1. Stupp R., Taillibert S., Kanner A.A., et al. Maintenance therapy with tumor-treating fields plus temozolomide vs temozolomide alone for glioblastoma: a randomized clinical trial. JAMa. 2015;314:2535–2543. doi: 10.1001/jama.2015.16669. - DOI - PubMed
    1. Rong L., Li N., Zhang Z. Emerging therapies for glioblastoma: current state and future directions. J. Exp. Clin. Cancer Res. 2022;41:142. doi: 10.1186/s13046-022-02349-7. - DOI - PMC - PubMed

Publication types

MeSH terms

Substances

Associated data